Origin of the high-energy kink or the waterfall effect in the photoemission spectrum of the high-temperature superconductor
Abstract
The high-energy kink or the waterfall effect seen in the photoemission spectra of the cuprates is suggestive of the coupling of the quasiparticles to a high energy bosonic mode with implications for the mechanism of superconductivity. Recent experiments however indicate that this effect may be an artifact produced entirely by the matrix element effects, i.e. by the way the photoemitted electron couples to the incident photons in the emission process. In order to address this issue directly, we have carried out realistic computations of the photo-intensity in (Bi2212) where the effects of the matrix element are included together with those of the corrections to the self-energy resulting from electronic excitations. Our results demonstrate that while the photoemission matrix element plays an important role in shaping the spectra, the waterfall effect is a clear signature of the presence of strong coupling of quasiparticles to electronic excitations.
pacs:
79.60.-i, 74.25.Jb, 74.20.Mn, 74.72.HsAn anomalous ‘high-energy kink’ (HEK) in the dispersion, which gives the associated angle-resolved photoemission spectrum (ARPES) the appearance of a ‘waterfall’ was first seengraf in (Bi2212) cuprate superconductor. Such HEKs or ‘waterfall’ effects have now been established as being a universal feature in the cuprates, and are found along both nodal and antinodal directions with their energy and momentum scales varying with doping and details of the band structuregraf ; moritz . The HEK has been interpreted theoretically as providing evidence for interaction of the quasiparticles with some bosonic mode of the systemMwater ; MJMS with implications for the mechanism of high-temperature superconductivity. Recent experiments show however that the HEK is quite sensitive to matrix element (ME) effects, i.e. to the nature of the potoemission process or the way the incident photon couples with the electronic states of the system in generating the photoemitted electrons. In particular, the ARPES spectra undergo substantial changes in shape as one probes the electronic states by varying the energy of the incident photon or the momentum of the outgoing electron.Int ; Zhou ; DanD In Bi2212, for example, the shape of the ARPES spectrum varies more or less periodically with photon energy from a shape that displays a single band-tail with relatively large intensity giving the spectrum a ‘Y’ shape, to a spectrum which shows the presence of double-tails with a waterfall.Int2 These results have led to speculation that the HEK may be an artifact produced entirely by ME effects.Int ; Int2 On the other hand, for all polarizations and photon energies, the near Fermi surface features are strongly renormalized from LDA values, whereas the band bottom is not. Such a change in dispersion with energy is generally taken to be a genuine signature of a bosonic mode coupling.
In order to address this controversy, we have carried out extensive first principles, one-step photo-intensity computations in Bi2212 in which we include not only the effects of the ARPES matrix element, but also incorporate a model self-energy based on accurate susceptibility calculations which properly reproduce the HEK phenomenologyMwater ; tanmoy6 ; LDA . In this way, we establish conclusively that despite a strong modulation of the spectra due to the ARPES matrix element, a genuine HEK or a waterfall effect is still present in the cuprates, and that its presence indicates a significant coupling to bosons of electronic origin. Given the strength of the coupling and the high associated energy scale, these bosons are likely to play an important role in both the Mott and the superconducting physics of the cuprates. In this connection, we also discuss model ARPES computations based on simplified tight-binding models for the purpose of gaining a handle on the interplay between the matrix element and self-energy effects, and also for delineating the nature of the striking characteristics of the ARPES matrix element such as the crossover from the Y-type spectral shape to the waterfall shape with photon energy.
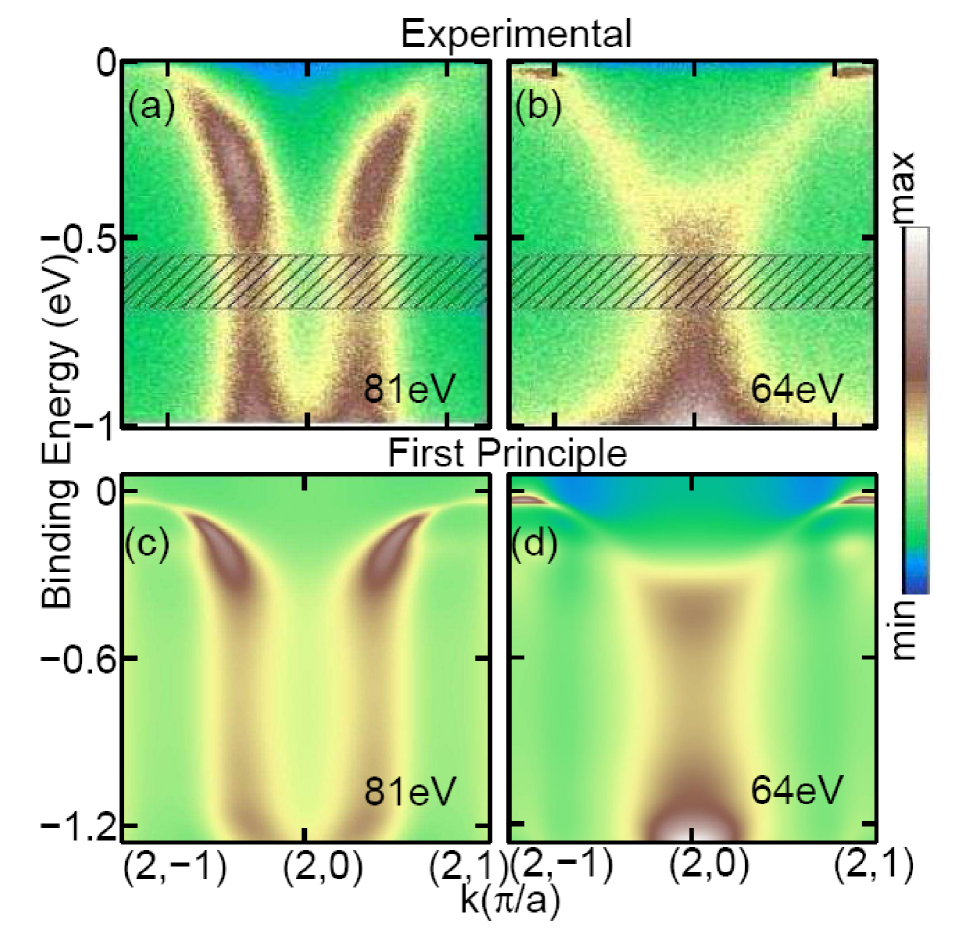
We discuss our key findings with reference to Fig. 1. Note first how the shape of the experimental spectrum changes dramatically at different photon energies. In panel (a) at 81 eV, the spectral intensity presents the appearance of a pair of ‘waterfalls’ with a region of low intensity through the middle of the figure. This is in sharp contrast to the measured spectrum in (b) at 64 eV where we see a ‘Y-shape’ with the two arms of the Y connecting a vertical region of high intensity. Our realistic first-principles photo-intensity computations in which the matrix element as well as self-energy effects are accounted for reproduce the characteristic features of these shapes: The waterfall shape in panel (c) at 81 eV and the Y-shape in panel (d) at 64 eV, even though the arms of the Y in the computed spectrum in (d) are less clearly defined than the corresponding measurements in (b).
For the purpose of delineating the roles of the self-energy and matrix elements in shaping the ARPES spectra, Fig. 2 presents the results of photo-intensity computations based on a simplified two-band tight-binding Hamiltonian which models the low-energy electronic structure of Bi2212.Arun3 ; footAll The real and imaginary parts of the self-energyfootAll within the framework of the two-band model are shown in panel (a) for the antibonding band (AB) [similar results for the bonding band (BB) are not shown for brevity]. The model bands dressed by only the real part of the self-energy are shown in (b), together with the LDA bands at (magenta lines). The real part of the self-energy [solid blue line in (a)] is almost linear in in the low-energy region. We write the slope of the linear part as to define the renormalization coefficient . This leads to a renormalized quasiparticle dispersion , which, e.g., reduces the bi-layer splitting between the AB and BB bands at the antinodal point to , consistent with experimental resultsfootAll ; Int . In contrast, at the point the dressed bands determined by move further away from each other. This is due to the fact that in Bi2212, lies in an energy range where the corresponding self-energy values possess an opposite sign. Moreover, the Green’s function for the anti-bonding band shows multiple poles at the point because the line coincides more than once with in (a), and as a result the anti-bonding band develops an additional splitting. These opposing tendencies at low and high energies, which are seen clearly in the experimental spectra, are an unambiguous signature of strong coupling to a bosonic mode at intermediate energy.
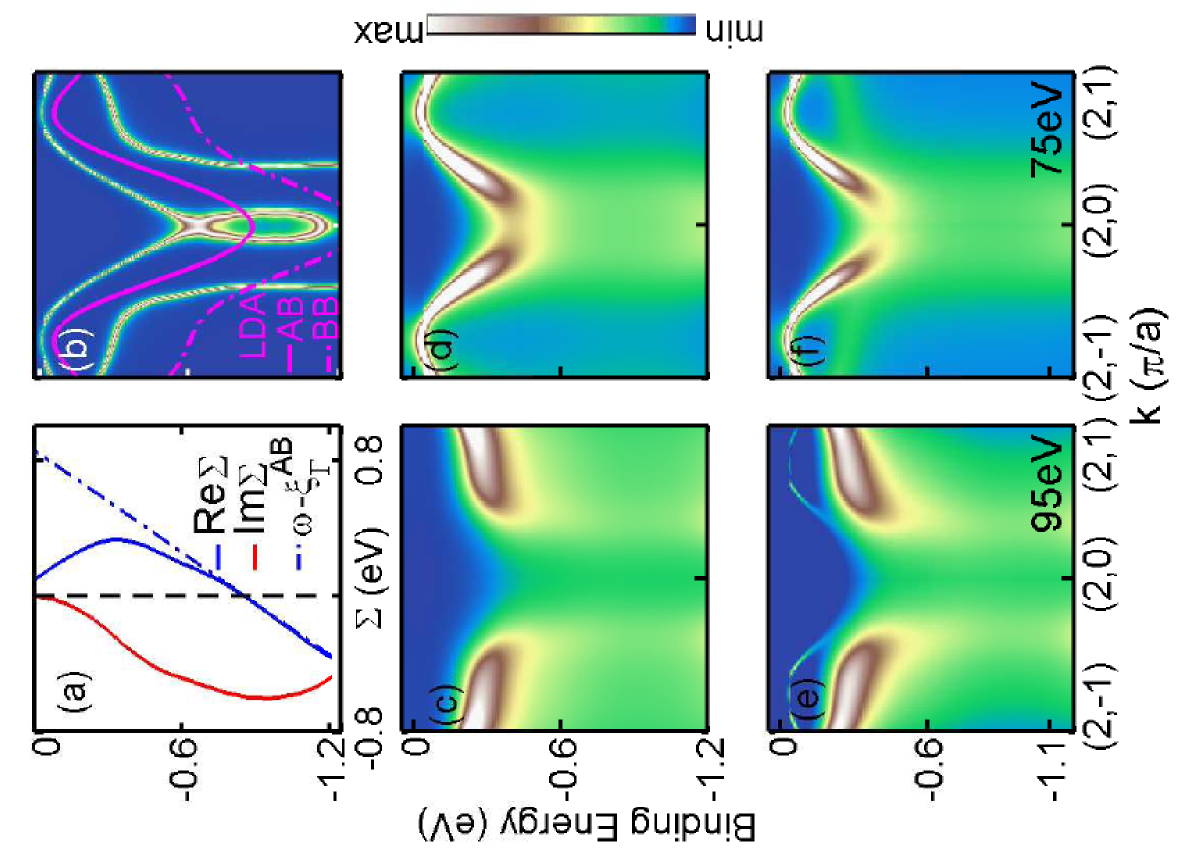
When the imaginary part of the self-energy is turned on, interesting spectral weight modulations emerge, which are shown separately in Fig. 2(c) and 2(d) for the AB and BB bands, respectively. plays a crucial role in redistributing spectral weight such that the weight is shifted from the coherent region near the Fermi energy into incoherent parts at higher energies to produce the HEK features seen experimentallyMwater . However, the differences noted earlier near lead to striking differences in the manifestation of the kink effect in the AB and BB spectra. In AB, the band bottom at lies above the ‘waterfall’ region, and creates a long tail in the dispersion extending to high energies,foot4 so the fully dressed band exhibits the ‘Y’-shaped pattern of panel (c). In contrast, the ‘waterfall’ shape emerges distinctly in the bonding band in panel (d) where the band bottom lies below the boson peak. These two dispersions are remarkably close to the two experimental dispersions observed at different photon energies as seen in panels 1(a) and 1(b)Int2 and provide insight into the nature of the waterfall phenomenon in the spectra.
In order to delineate contributions from different orbitals, we have computed the photo-intensity within the framework of our tight-binding model using the linear electron-photon interaction. The matrix element for the band is then shown straightforwardly to be given byfoot7
| (1) | |||||
Here is the momentum of the ejected electron, denotes the polarization of light with vector potential , and is the spherical harmonic for the angular variables of . The final state is taken to be a free electron state. The initial state is a tight-binding state, which is expanded into atomic orbitals of the atom in the unit cell at position . The form factor
| (2) |
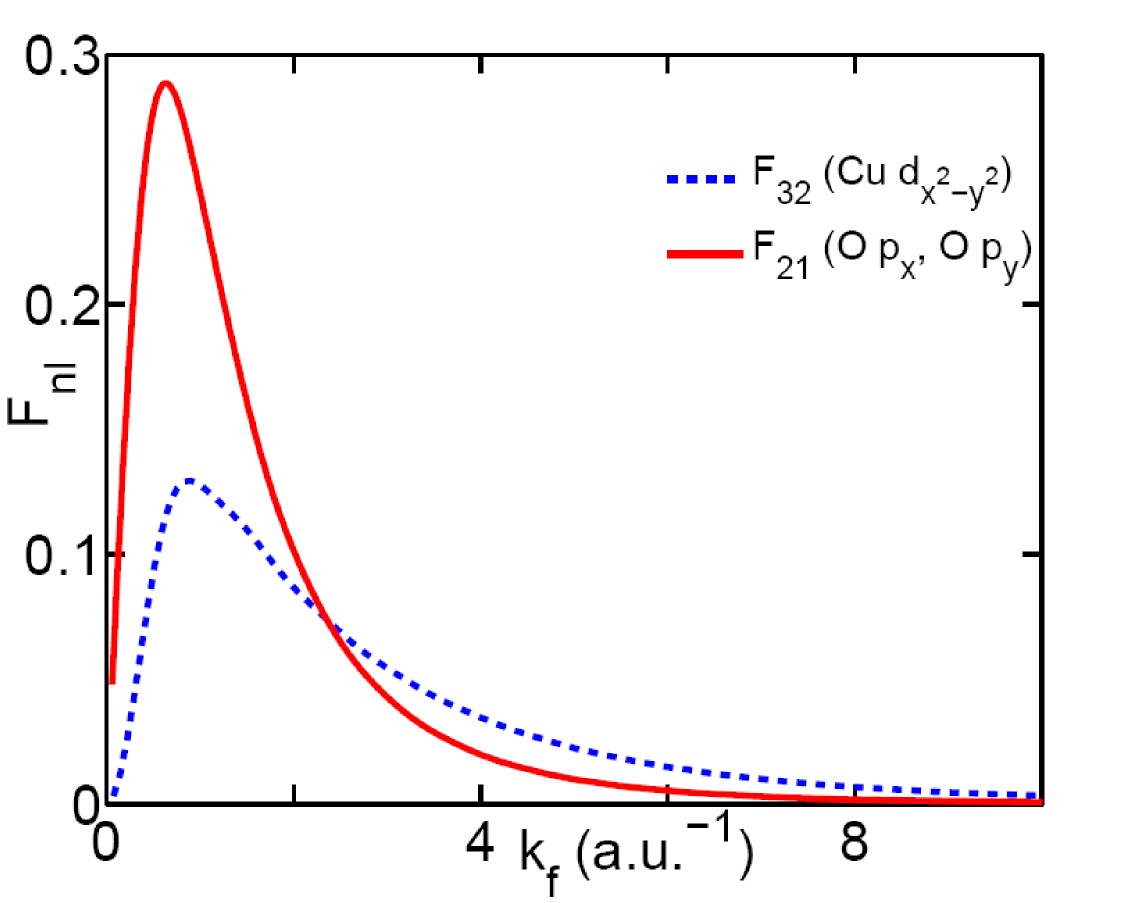
where is a spherical Bessel function, is evaluated numerically using the radial part of the atomic wavefunctionfoot5 ; hermanson ; Atomic . Fig. 3 shows that at low the oxygen contribution for the oxygen and orbitals is dominant, while the Cu contribution for the Cu orbital dominates for . Although Eq. 2 is general, we have used only three orbitals, i.e. Cu , O , and O in expanding the AB and BB bands to obtain the photo-intensities for our illustrative purposes. Finally, Eq. 1 can be recast into a useful form by collapsing all the symmetry information concerning the orbital into the structure factor :
| (3) |
For a bi-layer system, the structure factor of Eq. 3 becomes
| (4) |
where is the two-dimensional structure factor of Eq. 3, the + sign refers to the AB band and the - sign to the BB band. is a reciprocal lattice vector with being the in-plane and the out-of-plane lattice constant, denotes the separation of the CuO2 layers in a bilayer.foot6 ; dimpling The phase factor in Eq. 4 depends on the photon energy through Int2 ; Feng2002
| (5) |
where is the incident photon energy and eV is the binding energy of the electron in the solid at the waterfall, eV is the work function, eV is the inner potential of the crystal and is the total in-plane wave number, which we have taken to be to match the experimental conditions.foot8 Thus, whenever changes by , the spectrum would switch from the odd to the even bilayer, a change that can be induced in view of Eq. 5 via the photon frequency . This behavior is indeed seen in panels (e) and (f) of Fig. 2 where the matrix element is incorporated in the photo-intensity computations using Eqs. 1-5. In particular, at eV in panel (f), the AB band gets highlighted resulting in a Y-shaped spectrum with a tail extending to high energies. In contrast, in panel (e) at eV, the bonding band dominates and spectral shape reverts to that of a waterfall with a double tail.
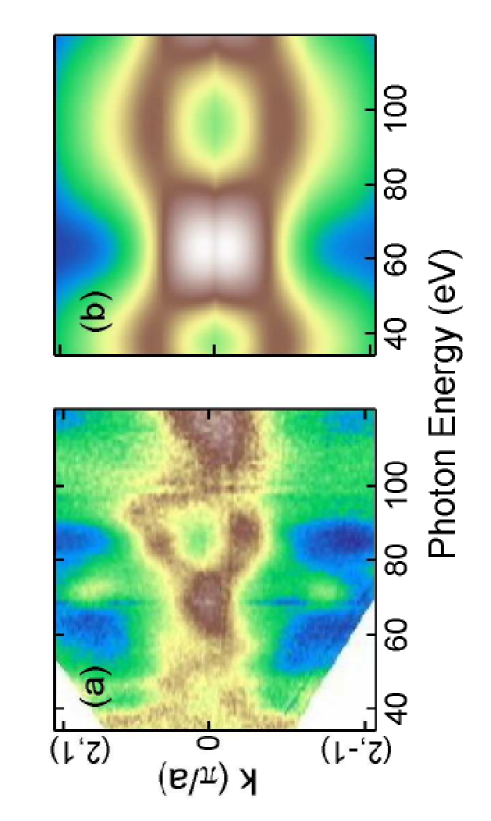
Along the preceding lines, Fig. 4 further discusses the Y-waterfall spectral shape oscillation as a function of the photon energy. For this purpose, we consider in Fig. 4 the integrated spectral weight over the shaded binding energy window shown in Fig. 1(a) or 1(b). The Y-shape is then characterized by a relatively narrow single tail in momentum (vertical axis in Fig. 4), while the waterfall displays a splitting of this feature due to the presence of two tails. The experimental results of Ref. Int2, shown in Fig. 4(a) are seen to be in good accord with the corresponding computations in Fig. 4(b), which are based on the bilayer dispersion of Ref. kzdisp, , some differences between theory and experiment with respect to the onset of Y- or waterfall shape in photon energy notwithstanding. Notably, the theoretical results of Fig. 4(b) account for the effects of ‘dimpling’ of the CuO2 planes (i. e., deviations of the positions of the Cu and O atoms in the crystal structure of Bi2212 from a perfectly planar geometry) by including two bilayer splittings and in modeling the bilayer. When the self-energy correction is then included in the binding energy, , it makes complex in Eq. 5. This complex damps the contribution from the lower CuO2 plane and thus modifies the intensity pattern through interference effects. We find that these corrections do not make much difference in our result. Taken as a whole, the comparisons between the first-principles and model computations of the photo-intensity in Figs. 1, 2 and 4 also indicate that our simpler model with a limited number of orbitals is capable of capturing many salient spectral features in the low energy region and giving insight into their origin.
In summary, we have carried out extensive computations of the photo-intensity in Bi2212 where the effects of the photoemission matrix element as well those of the coupling of the quasiparticles to electronic excitations are included realistically. We thus establish that despite the importance of the matrix element in shaping the spectra, the waterfall effect is a clear signature of the coupling of the electronic system to a high-energy bosonic mode, which bears on the physics of the pseudogap and the mechanism of high-temperature superconductivity. Our analysis of the spectra based on a simplified two-band tight-binding model reveals how the near-Fermi energy bonding and anti-bonding bands associated with the CuO2 bilayers in Bi2212 produce characteristic Y-shape and waterfall shape of the spectrum as a function of the energy of the incident photons. Such a periodic modulation of the spectrum with photon energy may provide a new spectroscopic tool for getting a handle on the structural aspects of the bilayer via the photoemission technique.
Acknowledgements.
We thank J. Lorenzana for useful suggestions. This work is supported by the US Department of Energy, Office of Science, Basic Energy Sciences contract DE-FG02- 07ER46352, and benefited from the allocation of supercomputer time at NERSC, Northeastern University’s Advanced Scientific Computation Center (ASCC), and the Institute of Advanced Computing, Tampere. RSM’s work has been partially funded by the Marie Curie Grant PIIF-GA-2008-220790 SOQCS.References
- (1) J. Graf, et al., Phys. Rev. Lett. 98, 067004 (2007).
- (2) B. Moritz, et al. arXiv:0807.3359 (2007).
- (3) R. S. Markiewicz, S. Sahrakorpi, and A. Bansil, Phys. Rev. B 76 , 174514 (2007).
- (4) A. Macridin, M. Jarrell, T. Maier, and D.J. Scalapino, Phys. Rev. Lett. 99, 237001 (2007).
- (5) D. S. Inosov et al., Phys. Rev. Lett. 99, 237002 (2007).
- (6) Wentao Zhang et al., Phys. Rev. Lett. 101, 017002(2008).
- (7) D. Dessau, unpublished, conference paper SNS07.
- (8) D.S. Inosov et al., Phys. Rev. B 77, 212504 (2008).
- (9) Tanmoy Das, R.S. Markiewicz, and A. Bansil, arXiv:0807.4257 (2008).
- (10) M. Lindroos et al., Phys. Rev. B 65, 054514 (2002).
- (11) R.S. Markiewicz, S. Sahrakorpi, M. Lindroos, Hsin Lin, and A. Bansil, Phys. Rev. B 72, 054519 (2005).
- (12) A -dispersion is also included for the initial state with a TB parameter eV. Self-energy is evaluated as in Ref. tanmoy6, , except that the effect of bilayer splitting is included. This turns out to be a minor correction. Doping is fixed to the optimal regime of Bi2212 with Hubbard eV to obtain a self-consistent renormalization value of . Our bare band bilayer splitting varies from around meV at to meV at ; the corresponding dressed values are meV and meV, respectively.
- (13) We find that tails are typically produced at band bottoms due to the incoherent spectral weight introduced by the self energy.
- (14) The matrix element is obtained as the transition from an initial state to the final state (using the standard Fermi-Golden rule): , where .
- (15) An additional ME effect due to final state coupling to the detector hermanson does not significantly alter these results, and is therefore not included.
- (16) J. Hermanson, Sol. St. Commun. 22, 9 (1977).
- (17) D. D. Koelling and B.N. Harmon, J. Phys. C: Solid St. Phys. 10, 3107 (1975).
- (18) We take the dimpling of the CuO2 planes into account by using two different bilayer distances; for oxygen and for copper dimpling .
- (19) P.A. Miles et al., Physica C 294, 275 (1998).
- (20) D.L. Feng et al., Phy. Rev. B 65, 220501 (2002).
- (21) The value of the inner potential was obtained from an LDA Slab calculation.
- (22) A. Bansil, M. Lindroos, S. Sahrakorpi, and R.S. Markiewicz, Phys. Rev. B 71, 012503 (2005).