Nonthermal X-ray Emission in the N11 Superbubble in the Large Magellanic Cloud
Abstract
We present the results of X-ray spectral analysis of the superbubble around the OB association LH9 in the H II complex N11 in the Large Magellanic Cloud. Using observations from Suzaku, we have modeled the X-ray emission over the energy range 0.2-7.5 keV. We contrained the thermal spectrum below 2 keV using a thermal plasma model found in a previous XMM-Newton study of the N11 region. We find that the hard X-ray emission ( 2 keV) requires a nonthermal power-law component. The photon index of this component was found to be . We performed an energy budget analysis for N11 using the known stellar content of LH9. We found that the observed thermal and kinetic energy in the superbubble is only half of the expected mechanical energy injected by stars.
1 Introduction
Superbubbles (SBs) are formed by the combined actions of stellar winds from massive stars in OB associations and the eventual supernovae (SNe) of those stars (Bruhweiler et al., 1980). The physical structure of a SB is very similar to that of a bubble blown by the stellar wind of an isolated massive star, as modeled by Castor et al. (1975) and Weaver et al. (1977), and more recently by Pittard et al. (2001). The interior of a SB is shock-heated by stellar winds and SN ejecta to K and therefore exhibits diffuse X-ray emission. These regions of rarefied hot gas reach diameters of pc.
The study of SBs in the Galaxy is impeded by the effects of obscuration and confusion in the Galactic plane, making faint, extended objects such as SBs difficult to observe, particularly at X-ray wavelengths. In contrast, the high Galactic latitude and low internal column density of the Large Magellanic Cloud (LMC) allows us a relatively un-obscured view of its population of SBs, and as these SBs are all at roughly equal, known distances (50 kpc; Feast, 1999), we can translate our observations into the physical properties of the SBs.
N11 is the second largest H II region in the LMC after 30 Doradus, and may constitute a more evolved version of this latter nebula (Walborn & Parker, 1992). It harbors several associations of massive stars: LH9, LH10, LH13 and LH14 (Lucke & Hodge, 1970). Its structure is complex and reflects the interactions between the stars and their environment. The combined action of stellar winds and SN explosions from the central cluster LH9 has carved a hollow cavity in the surrounding ISM and created a SB shell pc in diameter. The hot shocked winds/ejecta that fill this cavity emit X-rays and provide the pressure to drive the SB shell expansion (Mac Low et al., 1998). Only SNe outside the SB can produce distinct SN remnants (SNRs) such as N11L at the western edge of the N11 complex (Williams et al., 1999).
Previous studies of the N11 region with ROSAT and XMM-Newton have presented the soft X-ray spectral properties of the SB around LH9 (Mac Low et al., 1998; Nazé et al., 2004). Each study concluded that the soft X-ray component was dominated by a thermal emission characterized by a temperature of keV. Investigations into the high-energy ( keV) properties of N11 were limited in both of these studies: ROSAT was not sensitive to photon energies higher than keV; the XMM-Newton observations suffered from high particle background at these higher energies. The recently launched Suzaku has a moderate angular resolution, , and greater sensitivity to higher energy X-ray photons, providing an excellent tool to study the high-energy diffuse emission in SBs.
In this paper we present the analysis of the X-ray spectrum of the SB around LH9 in N11 using new Suzaku observations. In Section 2 we will provide a description of the observations and data processing procedures. Section 3 will describe the spectral analysis of the main SB in N11 based on the Suzaku observations. In Section 4 we will use the spectral results to perform an energy budget analysis to compare the observed thermal and kinetic energies of the SB to the energy input based on the stellar population of the OB association LH9. We will also discuss the possible mechanisms for the oberved non-thermal X-ray emission.
2 Observations and Data Reduction
The X-ray observatory Suzaku (ASTRO-E2; Mitsuda et al., 2007) includes five X-ray telescopes (XRTs), sensitive to soft X-rays up to keV (Serlemitsos et al., 2007). At the foci of four of the XRTs (XRT-I) are charge-coupled devices (CCD), known as X-ray Imaging Spectrometers (XIS; Koyama et al., 2007). Each CCD chip has an imaging area of pixels, with a corresponding pixels size of . Three XIS CCDs (0,2 and 3) are front-illuminated (FI), and one (XIS1) is back-illuminated (BI). The field-of-view for the XIS CCDs are with effective areas of 340 cm2 (FI) and 390 cm2 (BI) at 1.5 keV. Suzaku is located in a lower orbit than XMM-Newton and Chandra, providing a lower and more stable particle background than other X-ray instruments (Mitsuda et al., 2007).
N11 was observed with Suzaku on 2006 November 7-8 (ID 501091010; PI Williams) for a total of 66.5 ks with a nominal pointing of R.A. , Dec (J2000). Data were acquired on the three front-illuminated imaging CCDs (XIS0, XIS2 and XIS3) and the one back-illuminated CCD (XIS1). The data were processed with the HEASoft v6.6 software suite. We first applied standard filters for bad pixels and event grades111As described in Suzaku ABC Guide: http://heasarc.gsfc.nasa.gov/docs/suzaku/analysis/abc/. We removed time intervals when the source elevation was less than above the Earth’s limb. Additionally, we removed times for when the satellite was above or within 436s of the South Atlantic Anomaly. Finally, we screened out events from the onboard 55Fe calibrator sources. After all of the data screening, we obtained a final exposure time of 22.2 ks.
For the XIS instrumental response, we locally generated response matrices and ancillary response files using the tasks xisrmfgen and xissimarfgen, respectively. The XIS background spectra were taken from a blank sky observation toward the north ecliptic pole region, conducted for 95 ks on 2005 September 2–4. Non-X-ray background spectra were taken from night earth (NTE) observations compiled and available through the Suzaku Science Team. The NTE spectra were weighted according to the magnetic cut-off rigidity of the source observation. Source spectra were extracted using XSELECT from an elliptical region encircling the whole expanding SB around LH9. The spectra were then binned with the task grppha to include a minimum of 10 counts per bin over the entire energy range.
An XMM-Newton observation of N11 was retrieved from the XMM-Newton data archive. Analysis of this observation was previously presented in Nazé et al. (2004). Our data processing procedure was identical to Nazé et al. (2004), and our spectral analysis results were consistent with theirs. We used the resulting thermal model to constrain the low energy spectrum of the Suzaku observations.
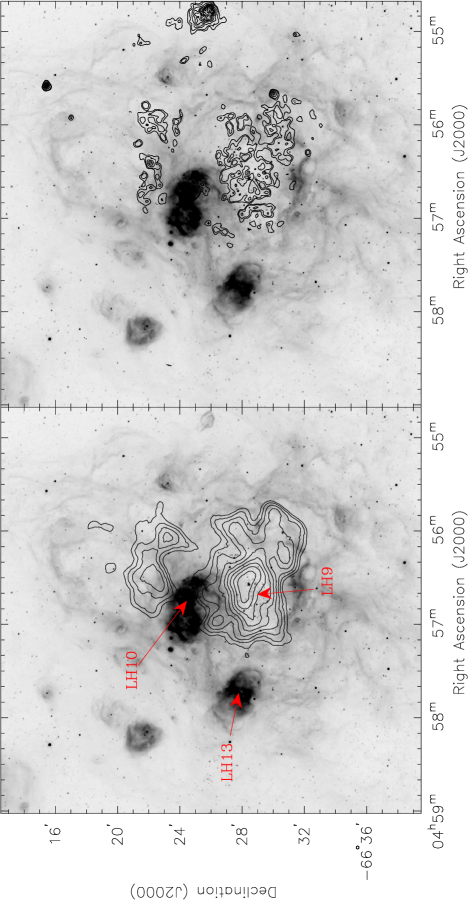
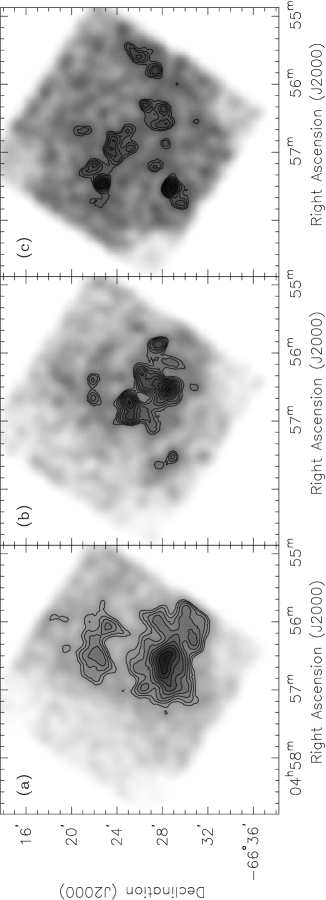
Figure 1 shows the distribution of soft (0.2–1.0keV) X-ray emission overlaid on an H image of the N11 complex from the Magellanic Cloud Emission Line Survey (MCELS; Smith et al., 1998). The XIS contours were generated using a combined image that was binned by a factor of 8 and smoothed with a Gaussian to the effective resolution of the Suzaku telescope . The peak soft X-ray emission in the Suzaku and XMM-Newton images are offset, but lie within the pointing accuracy of Suzaku. The emission peak lies within the evacuated shell of LH9, where the stellar winds of the young stars have blown away the natal gas that formed the cluster. The three strong point sources seen in hard X-rays (Figure 2) lie outside our spectral extraction region.
3 Results
Due to the difference in angular resolution between Suzaku and XMM-Newton, 2′ and , respectively, our extraction regions needed to be quite large. We extracted raw spectra from elliptical regions containing the entire SB around the OB association LH9. The region measured with its major axis aligned along the east-west direction.
The background subtraction in the XMM-Newton spectra yielded count rates too low for meaningful fits above 2 keV, as was the case in Nazé et al. (2004). For these spectra, we limited our fitting to the energy range 0.4–2 keV. The XIS spectra yielded a different challenge. Above 8 keV, the subtraction of the non-X-ray background was problematic, with incomplete subtraction of Ni K and K fluorescence lines. This was not alleviated with the subtraction of the exposure corrected blank-sky data. For these reasons, we limited our spectra fitting range to 0.2–7.5 keV.
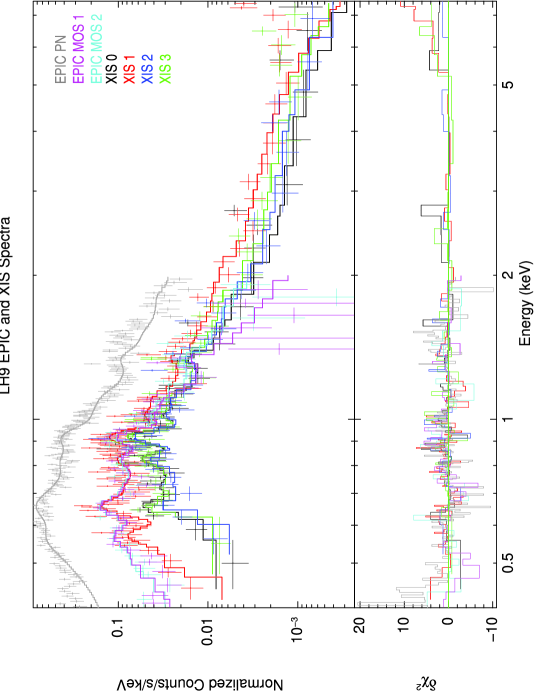
We fit the XMM-Newton and Suzaku spectra separately using XSPEC v12.5.0 distributed with HEASoft 6.6. The XMM-Newton data were used to contrain the low energy ( keV) thermal spectrum of N11. We then used the resulting thermal model as a fixed input to the Suzaku model fit. All fits include a fixed absorption column of cm-2 in the direction of the LMC (Dickey & Lockman, 1990). An additional absorption component was used as a free parameter to account for the local LMC column at the position of N11. The first model fit attempted was a single mekal (Mewe et al., 1985) thermal plasma model, the model found best for the XMM-Newton spectra in Nazé et al. (2004). This single temperature model was unable to fit the Suzaku spectra above 2 keV. We then added a second thermal component using various models in order to fit the high-energy region of the spectra. An additional thermal component with a temperature of keV was able to improve the fit at low energies ( keV), but above 2 keV the models diverged quickly from the observed high-energy spectrum. The only model that produced an improved fit, the non-equilibrium ionization model nei, yielded a gas temperature that was unphysical ( keV) for a system of this age. We therefore ruled out a second thermal contribution to the spectra.
The best fit was achieved with a two-component model consisting of a thermal plasma (mekal) and non-thermal power-law. Initially, we allowed the metallicity to vary freely. The resulting fits did not deviate significantly from the average LMC abundances of 0.3 . This is consistent with our understanding of this system as containing only a small fraction of SN enriched material intermixed with the typical LMC ISM. This also agrees with the results of self-enrichment models by Nava (2008), who found that for OB associations with LMC-like initial conditions no measurable change in metal abundances can be seen in 4-5 Myr, the age of LH9. These current data are not sufficient to constrain abundance variations through SN enrichment over the broad spatial regions required by the Suzaku spatial resolution. We therefore fixed the abundance parameter to 0.3 for the final model, typical of the LMC ISM (Russell & Dopita, 1992). The total absorbed flux in the model is erg s-1 cm-2.
The model indicates that the thermal component of the gas has a temperature of keV, which is in good agreement with the properties of other LMC superbubbles. The error bars are 1- uncertainty. Mac Low et al. (1998) obtained a temperature range of 0.1–0.2 keV to 99% confidence in the ROSAT observation. The temperature determination of Nazé et al. (2004) was keV.
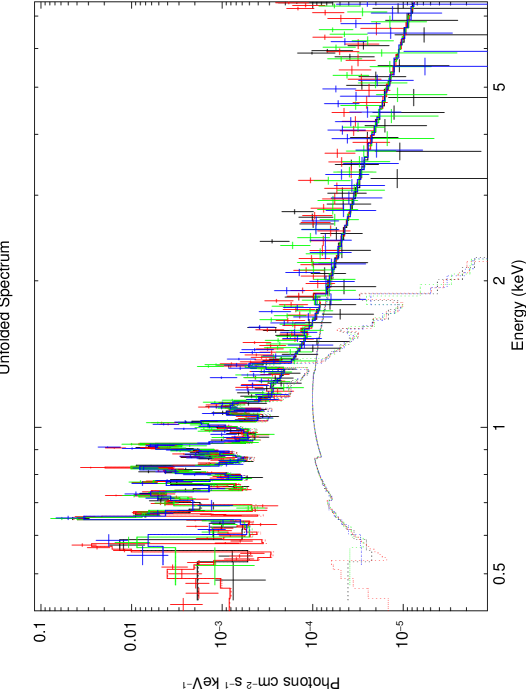
At higher energies ( keV), a non-thermal component is needed to fit the X-ray spectrum. The photon-index () of the best-fit model is , harder than would be expected for a synchrotron mechanism. The flux of the nonthermal emission is erg s-1 cm-2, about 35% of the total flux. Figure 3 shows the final spectral model with the Suzaku and XMM-Newton data. The best-fit parameters are shown in Table 1.
4 Discussion
We have used the observed stellar content of the OB association LH9 in the N11 SB to estimate the mechanical energy injected by stars via fast stellar winds and SN explosions. We have also used optical and radio observations to determine the kinetic energy of the dense ionized and neutral gas in the SB, and X-ray observations to assess the thermal energy of the hot interior gas. The comparison of these quantities were then used to determine an energy budget for the SB. Finally we discuss the observed nonthermal X-ray emission and possible physical mechanisms for this emission.
4.1 Stellar Energy Input
To estimate the stellar energy contribution for N11, we have considered the population of stars in LH 9 as given by Parker et al. (1992). In that study, bolometric magnitudes and effective temperatures (as determined by their spectral types or colors) were used to determine stellar masses and the present-day mass function (PDMF), then the PDMF is further used to determine the initial mass function (IMF) of the OB association. Parker et al. (1992) noted completeness problems for stars with . Ignoring the highest-mass bin due to potential evolutionary effects, Parker et al. found the IMF to have a slope 1.450.1 while Massey et al. (1995) found a IMF slope of 1.380.16. We have adopted a middle value for the IMF of 1.4.
We have used the Starburst99 v5.1 package (Leitherer et al., 1999) to model the stellar energy inputs of N11. Starburst99 requires three basic inputs: an IMF slope, the total mass of stars formed by the OB association in the 1–100 range (essentially a scaling factor for the IMF), and a timescale to integrate the stellar energy inputs over. We use our adopted IMF slope of , and the observed main sequence star counts, to determine the total mass of stars formed by the OB association LH9. We note that the IMF will take the form , where is a constant that can be determined from the star counts. Using the star counts in the 12–15, 15–20, 20–25, and 25–40 bins from Parker et al. (1992), we find 3500200. The error bar reflects the uncertainty caused by integrating over different subsets of the total mass range. To find the total mass of stars formed by the OB association, we integrated over the 1–100 mass range and find a total star mass of 7400400 .
To estimate a timescale, we note that the earliest-type star observed in LH 9 is an O6 V star, with a mass of 40-60 . Such a star would have a main sequence lifetime of 4–5 Myr (Schaerer et al., 1993), and - assuming a single burst of star formation - gives us an estimate of the age of LH 9. The Starburst99 model predicts a total wind input energy of 8.60.51051 ergs at 5 Myr and that 81 supernovae have already occurred, adding 811051 ergs of mechanical energy. The total mechanical energy from LH 9, as predicted from the star counts, is therefore 1721051 ergs. We assume that all of this energy has gone into forming the SB.
4.2 Observed Thermal and Kinetic Energy
Using the best-fit model parameters, we are able to calculate some of the physical conditions within the SB. Since we used the XMM-Newton observations to constrain the thermal spectral fits, we have included those data in our calculations, leading to physical ranges. It should be noted that since our extraction region is very large, the physical estimates will contain hot gas that is not associated with LH9. The figures given here should be regarded as upper limits to the physical parameters within the main shell of N11.
We can estimate the electron density and mass of the thermal gas from the normalization factor for the spectral fits:
where is the distance to N11, is the electron density, is the hydrogen density, and is the volume in cgs units. We assume that the hydrogen and helium is fully ionized, and that ; giving us a total particle density of . The electron density and hot gas mass are then calculated by the expressions
where is the volume filling factor. From these quantities, along with the plasma temperature, we can derive the thermal energy and pressure of the hot gas around LH 9 by the following expressions:
We calculate that the X-ray emitting gas has an electron density of cm-3, and that the total thermal energy for the gas is ergs. The hot gas within the extraction region is calculated to have a total mass of . Finally, the thermal pressure of the emitting gas was calculated to be dyne cm-2.
It is most likely that the volume filling factor will range in value from due to the low density environment of the SB interior. If we adopt a value of for the X-ray emitting gas, a medium value for the likely range, we calculate that the total observed thermal energy in the SB is erg.
Rosado et al. (1996) found that the N11 SB had an H expansion velocity of 45 km s-1 in the shell. For a shell mass of (Dunne, 2007), we calculate that the H II kinetic energy contribution is erg. A survey of the H I distribution of SBs in the LMC (Dunne, 2007) found that the neutral gas bubble was expanding at a rate of 25 km s-1. With an H I mass of we calculate a kinetic energy of erg for the neutral shell. So the total kinetic energy of the ionized and thermal gas is erg, and the total observed energy (thermal plus kinetic) of the SB is erg.
4.3 Energy Budget
The calculated thermal and kinetic energy ( erg) of the N11 SB represents an energy deficit of about % when compared to the mechanical energy injected by the underlying OB association LH9 ( erg). This deficit is similar to that found for N51D by Cooper et al. (2004). In that case, it was shown that the observed thermal and kinetic energy were about 3 times lower than the stellar energy input. Suggested energy loss mechanisms were a large scale blow out, where the hot gas breaks through the shell and escapes into the ambient ISM, and evaporation of dense cool gas into the hot interior of the SB. Neither N51D nor N11 show evidence for blowouts, and radiative losses due to the interface of cool and hot gas at the shell are not sufficient to make up the energy deficit (Cooper et al., 2004).
4.4 Nonthermal X-ray Emission
Our analysis of Suzaku observations of the SB N11 has demonstrated the presence of a nonthermal high-energy component to the spectrum that was not detected in previous ROSAT and XMM-Newton observations. This adds N11 to a small list of regions around OB associations that exhibit diffuse nonthermal X-ray emission: the SBs 30 Doradus C (Bamba et al., 2004; Smith & Wang, 2004) and DEM L192 (N51D, Cooper et al., 2004) in the LMC, and RCW 38 (Wolk et al., 2006) and Westerlund 1 (Muno et al., 2006) in the Milky Way galaxy. Proposed explanations for the nonthermal emission in these objects are synchrotron radiation or inverse Compton scattering of starlight. Each requires the acceleration of electrons to relativistic energies. Repeated SN shocks, turbulence in SNRs and colliding stellar winds, all expected in OB associations, can accelerate the electrons to these energies (Parizot et al., 2004).
In the case of N11, the photon index () is harder than would be expected for a aynchrtron origin. It is more consistent with an inverse compton mechanism. The low angular resolution of the Suzaku observation makes it difficult to separate the individual contributions to the power-law emission, such as emission contributed by the stellar content of LH through the interaction of the stellar winds with the surrounding H II region, or SNR shock interactions with the SB shell. The raw XMM-Newton data indicate the presence of about six faint point sources within the spectral extraction region. Four of these sources seem to have relatively hard X-ray colors, but upon subtraction of background events, there are insufficient remaining photons to do spectral analysis on the sources. At least two of the XMM-Newton point sources contribute to the 1.0-2.0 keV emission along the NW rim of the SB. In the same region, one point source appears to contribute a few counts at energies 2 keV in the Suzaku images. The point sources contribute less than of the total hard X-ray flux that we observe in the SB X-ray emission, an insignificant fraction of the total.
The detection of nonthermal emission in N11, combined with previous SBs, demonstrates that faint nonthermal emission may be present in many SBs where it has been undetected before due to limited high-energy sensitivity. The discovery of a high-energy nonthermal component in N11 indicates that such components may not be uncommon in SBs; further observations with instruments such as Suzaku may be expected to increase the sample of such objects. The origins of such components are not yet fully understood - and, indeed, multiple mechanisms may be at work. If in general they are shown to be due to the presence of recent internal SNR shocks, as is indicated for N11, this will have interesting implications for the study of superbubble evolution and their role as cosmic-ray sources. Due to the complex nature of SB environments, it would be expected that nonthermal emission has multiple origins. With a larger sample we will be able to study more closely the question of what mechanism are generating this emission.
5 Summary
We have obtained Suzaku observations of the H II complex N11 in the LMC. Prominent diffuse X-ray emission is detected from the central SB. We have analyzed the Suzaku XIS data in conjunction with the XMM-Newton EPIC data. We find a main thermal emission component with a temperature of 0.18 keV, consistent with previous analyses of ROSAT and XMM-Newton observations alone. Owing to Suzaku’s high sensitivity at photon energies 3 keV, we are able to extend the spectral analysis to hard X-rays and find a nonthermal X-ray component with a photon index of 1.72. This is consistent with an inverse compton mechanism, though we cannot rule out other mechanisms at this time. This nonthermal component contributes 35% of the total X-ray emission from the analyzed region.
We have performed an energy budget analysis for N11 using the known stellar content of LH9. The total stellar wind energy and supernova explosion energy injected by LH 9 into the SB in the past 5 Myr are 8.60.51051 ergs and 811051 ergs, respectively. The total thermal and kinetic energies retained in the N11 SB are 2.3 0.9 1051 erg and 4.51051 erg, respectively. We find a deficit of in the thermal and kinetic energy stored in the superbubble from the expected mechanical energy injected by the stars. This is similar to that observed in N51D. This could mean that these energy deficits may be common in SBs. More sensitive observations of SBs will help answer this question.
References
- Bamba et al. (2004) Bamba, A., Ueno, M., Nakajima, H., & Koyama, K. 2004, ApJ, 602, 257
- Bruhweiler et al. (1980) Bruhweiler, F. C., Gull, T. R., Kafatos, M., & Sofia, S. 1980, ApJ, 238, L27
- Castor et al. (1975) Castor, J., McCray, R., & Weaver, R. 1975, ApJ, 200, L107
- Chu & Mac Low (1990) Chu, Y.-H., & Mac Low, M.-M. 1990, ApJ, 365, 510
- Cooper et al. (2004) Cooper, R. L., Guerrero, M. A., Chu, Y.-H., Chen, C.-H. R., & Dunne, B. C. 2004, ApJ, 605, 751
- Dickey & Lockman (1990) Dickey, J. M., & Lockman, F. J. 1990, ARA&A, 28, 215
- Dunne (2007) Dunne, B. C. 2007, PhD thesis, University of Illinois at Urbana-Champaign
- Feast (1999) Feast, M. 1999, in IAU Symposium, Vol. 190, New Views of the Magellanic Clouds, ed. Y.-H. Chu, N. Suntzeff, J. Hesser, & D. Bohlender, 542
- Koyama et al. (2007) Koyama, K., et al. 2007, PASJ, 59, 23
- Leitherer et al. (1999) Leitherer, C., Schaerer, D., Goldader, J. D., Delgado, R. M. G., Robert, C., Kune, D. F., de Mello, D. F., Devost, D., & Heckman, T. M. 1999, ApJS, 123, 3
- Lucke & Hodge (1970) Lucke, P. B., & Hodge, P. W. 1970, AJ, 75, 171
- Mac Low et al. (1998) Mac Low, M.-M., Chang, T. H., Chu, Y.-H., Points, S. D., Smith, R. C., & Wakker, B. P. 1998, ApJ, 493, 260
- Massey et al. (1995) Massey, P., Lang, C. C., Degioia-Eastwood, K., & Garmany, C. D. 1995, ApJ, 438, 188
- Mewe et al. (1985) Mewe, R., Gronenschild, E. H. B. M., & van den Oord, G. H. J. 1985, A&AS, 62, 197
- Mitsuda et al. (2007) Mitsuda, K., et al. 2007, PASJ, 59, 1
- Muno et al. (2006) Muno, M. P., Law, C., Clark, J. S., Dougherty, S. M., de Grijs, R., Portegies Zwart, S., & Yusef-Zadeh, F. 2006, ApJ, 650, 203
- Nava (2008) Nava, A. H. 2008, Ph.D. Thesis, U of Oklahoma
- Nazé et al. (2004) Nazé, Y., Antokhin, I. I., Rauw, G., Chu, Y.-H., Gosset, E., & Vreux, J.-M. 2004, A&A, 418, 841
- Parizot et al. (2004) Parizot, E., Marcowith, A., van der Swaluw, E., Bykov, A. M., & Tatischeff, V. 2004, A&A, 424, 747
- Parker et al. (1992) Parker, J. W., Garmany, C. D., Massey, P., & Walborn, N. R. 1992, AJ, 103, 1205
- Pittard et al. (2001) Pittard, J. M., Dyson, J. E., & Hartquist, T. W. 2001, A&A, 367, 1000
- Rosado et al. (1996) Rosado, M., Laval, A., Le Coarer, E., Georgelin, Y. P., Amram, P., Marcelin, M., Goldes, G., & Gach, J. L. 1996, A&A, 308, 588
- Russell & Dopita (1992) Russell, S. C., & Dopita, M. A. 1992, ApJ, 384, 508
- Schaerer et al. (1993) Schaerer, D., Meynet, G., Maeder, A., & Schaller, G. 1993, A&AS, 98, 523
- Serlemitsos et al. (2007) Serlemitsos, P. J., et al. 2007, PASJ, 59, 9
- Smith & Wang (2004) Smith, D. A., & Wang, Q. D. 2004, ApJ, 611, 881
- Smith et al. (1998) Smith, R. C., & MCELS Team 1999, in IAU Symposium, Vol. 190, New Views of the Magellanic Clouds, ed. Y.-H. Chu, N. Suntzeff, J. Hesser, & D. Bohlender, 28
- Walborn & Parker (1992) Walborn, N. R., & Parker, J. W. 1992, ApJ, 399, L87
- Weaver et al. (1977) Weaver, R., McCray, R., Castor, J., Shapiro, P., & Moore, R. 1977, ApJ, 218, 377
- Williams et al. (1999) Williams, R. M., Chu, Y.-H., Dickel, J. R., Smith, R. C., Milne, D. K., & Winkler, P. F. 1999, ApJ, 514, 798
- Wolk et al. (2006) Wolk, S. J., Spitzbart, B. D., Bourke, T. L., & Alves, J. 2006, AJ, 132, 1100
| Model Parameter | LH9 |
|---|---|
| Column Density ( cm-2) | |
| Plasma Temperature (keV) | |
| Thermal Flux (absorbed) ( erg s-1 cm-2) | 25.4 |
| Thermal Flux (unabsorbed) ( erg s-1 cm-2) | 954 |
| Photon Index () | |
| Nonthermal Flux (absorbed) ( erg s-1 cm-2) | 29.6 |
| Nonthermal Flux (unabsorbed) ( erg s-1 cm-2) | 46.8 |
| (d.o.f) | 544 (442) |
,