Limits on Nonstandard Forces in the Submicrometer Range
Abstract
We report the search for a nonstandard force by measuring the Casimir forces in the 0.48–6.5 m range. By comparing the data and the theory of the Casimir force, we have obtained constraints for the parameter of the Yukawa-type deviations from Newtonian gravity. The obtained limits are more stringent than previous limits in the 1.0–2.9 m range. Furthermore, we have obtained lower limits for the fundamental scale for gauged baryon number in the bulk. In particular, for six extra dimensions, the limits on are stringent in the range .
pacs:
04.80.Cc, 06.30.Gv, 11.25.Wx, 12.20.FvQuantum electrodynamics predicts that particle-antiparticle pairs will be continuously created and annihilated in vacuum. This microscopic phenomenon results in a macroscopic force between conductors, called the Casimir force Casimir . We have focused on the fact that the existence of a macroscopic force that lies outside the standard model can produce deviations from the Casimir force. Therefore, we developed a high-precision apparatus for detecting the anomaly MasudaSasakiAraya . A number of innovative theories that shatter the conventional concepts of time-space and fundamental interactions predict that nonstandard forces become obvious in the range in which the Casimir force is dominant Dimopoulos0 ; Arkani2 ; Dimopoulos . In particular, the proposed apparatus is effective for demonstrating a number of models that assume extra dimensions. We can investigate such nonstandard forces that revolutionize fundamental physics by searching for deviations from standard quantum electrodynamics.
The Casimir force, as predicted by standard quantum electrodynamics, between a flat conductor and a spherical conductor is expressed by
| (1) |
where is the distance between the conductors and is the radius of the spherical lens. When calculating the Casimir force between real metals, corrections for the properties of the metals (such as finite conductivity, nonzero temperature, and surface roughness) must be taken into account. Accurate computations can be performed for the finite conductivity and the roughness corrections (see the review paper Bordag0 ). However, four different models for the nonzero temperature correction have been proposed Bordag0 ; Bostrom2 ; Svetovoy2 ; Genet ; Klimchitskaya3 . Of these four models, two have been discounted based on experimental measurements Decca0 . The discrepancy between the nonzero temperature corrections calculated using the remaining two models is much smaller than the experimental accuracy. Thus, the existence of a nonstandard force can be demonstrated by searching for deviations between the theoretical and experimental Casimir forces.
During the last decade, various experimental demonstrations of the Casimir force have been reported. Since Lamoreaux’s measurement by a torsion balance Lamoreaux1 , devices Mohideen1 ; Decca3 ; Decca2 such as atomic force microscopes or microelectromechanical systems have frequently been used to measure the Casimir force. However, torsion balances have several advantages over other devices for probing nonstandard forces. These include a high sensitivity to macroscopic forces, because a torsional period on the order of 1000 s is attainable, and the availability of materials with large radius of curvature, which generate large macroscopic forces.
On the other hand, special care must be taken to ensure that the distance between the conductors remains constant when using torsion balances. This is the case not only because torsion balances are sensitive to disturbances such as seismic motions and ground tilts, but also because distance fluctuations produce large systematic errors as a result of the strong dependence of the Casimir force on distance. Various noises, including thermal noise and detection noise, have been reported in torsion balance experiments Lambrecht Lamoreaux0 . However, there has never been a quantitative estimation of the extent to which seismic motions and ground tilts affect the measurement of a macroscopic force in the sub-micrometer range. Thus, we have developed a torsion balance to measure macroscopic forces in the sub-micrometer range and estimated the effects due to the seismic motions and tilt effects MasudaSasakiAraya .
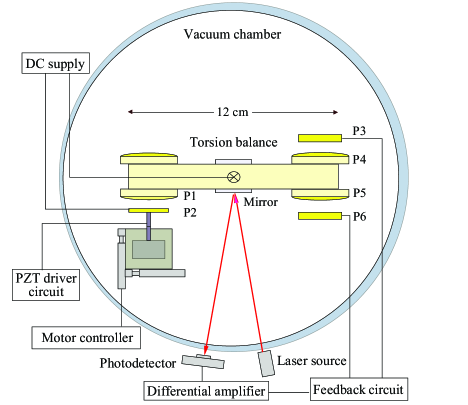
A schematic diagram of the present setup is shown in Fig. 1 (details are shown in MasudaSasakiAraya ). A spherical lens and a flat plate for generating the force are used to avoid the difficulty in the alignment of parallelism. We use optical lenses made of BK7 glass as substrates for both plates. Spherical lens P1 has a radius of 20 mm, a thickness of 5 mm, a radius of curvature of 207 mm, and the root mean square amplitude of its surface roughness was measured to be 22 nm. Flat plate P2 has a radius of 15 mm, a thickness of 2 mm, and the root mean square amplitude of its surface roughness is nominally less than 10 nm. These surfaces were metalized by evaporation coating a chromium layer with a thickness of 20 nm and then evaporation coating a gold layer with a thickness of 1000 nm.
The torsion balance is a copper bar that is suspended above the center of gravity by a tungsten wire of diameter 60 m and length 400 mm and the torsion constant of the wire is Nm/rad. The torsion angle can be obtained by an optical lever with a helium-neon laser and a photodiode. The angular resolution of the photodiode was measured to be 2.3 mV/rad, and the angular sensitivity was measured to be rad/ at 1 mHz.
A feedback system is used to measure the macroscopic forces by a null method. The torsion angle is maintained in order to maintain a certain position during the measurement. The signal of the torsion angle is integrated, filtered, and then converted into the feedback voltage in the analog feedback circuit. The position of the torsion balance is controlled by applying voltages and to plates P3 and P6 respectively, where is the bias voltage. The feedback response was adjusted to give a unity gain frequency of approximately 0.04 Hz. An electric force corresponding to is applied to the torsion balance, where is the derivative of the capacitance of the plates. The feedback coefficient was calibrated to be N/mV.
The variation of the force acting on plates P1 and P2 is determined by measuring the feedback voltage. Flat plate P2 is attached to the piezoelectric translator (PZT) on a motorized stage and faces the spherical plate P1. The dependence of displacement of the PZT on applied voltage (11.0 m at a bias voltage of 100 V ) was calibrated with a Michelson interferometer. The PZT was used only along the calibrated routes and the repeatability error in distance is measured to be 0.3 . These instruments were set in a vacuum chamber and a pressure on the order of 0.1 Pa was maintained during measurements.
In order to determine the absolute distance between plates P1 and P2, we use the dependence of the electric force on distance. If a bias voltage is applied between a flat plate and a spherical lens, the electrostatic force for is given by , where is the contact potential difference and is the dielectric constant. The contact potential difference between two metallic surfaces is caused by the different work functions of different metals or the distribution of surface charges. If the bias voltage is varied with an amplitude of at a certain distance , the variation in the electrostatic force is given by
| (2) |
First, we measured while the bias voltage was changed in steps of 10 mV at a certain distance. By fitting the data to Eq. (2), we obtained mV and m. We then measured the force as a function of distance by bringing plate P2 close to plate P1 with a constant step of 0.3 m from a distance of approximately 6.5 m. A bias voltage is applied between plates P1 and P2 to diminish the electric force. After obtaining data at a distance of approximately 0.5 m, we returned the plate to approximately 6.5 m and began the next cycle in the same manner. Each step requires 600 s, including a dead time of 200 s, and one cycle requires approximately 4 h. The final data comprises 587 points in the 0.48–6.5 m range.
The obtained data correspond to the force variation , where is the attractive force between the plates as a function of distance. All data were divided into independent bins with the width of 0.1 to 0.3 m, fitted with a linear function defined within each bin. Then, to ensure the quality of data analysis, 28 data points with 2.5 far from the fitted function were rejected, which are 5 of the obtained data. Within the scope of the standard interaction theory, each data point conceals the residual electrostatic and the Casimir force variations. The difference in the electric force when the distance is varied with a constant step at a constant bias voltage can be expressed as
| (3) |
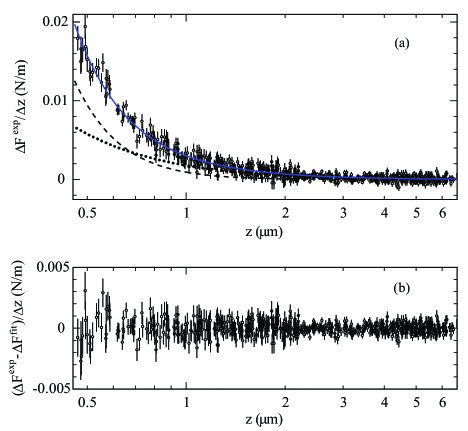
In order to reveal the electric force and the Casimir force, the data of with the statistical errors in the whole range of the 0.48–6.5 m were fitted simultaneously to the sum of 2 functions: the expected electrostatic force Eq. (3) whose residual voltage difference is a fit parameter and the Casimir force without assuming any nonstandard interaction. The statistic error in distance is estimated from 0.3 relative fluctuation of the movement of the PZT actuation. As a result, the residual voltage difference in Eq. (3) is determined to be 20.0 0.2 mV. The minimized value of is obtained to be . The fairly reasonable goodness of fit qualifies the high level of agreement between the data and the standard interaction theory of Casimir force. The data with the functions of the electric force (dotted), the Casimir force (dashed) with taking into account the conductivity and roughness effects, and the total best-fit curve (solid) as the sum of 2 functions are as shown in Fig. 2(a). The comparison between data and best-fit function is also shown in Fig. 2(b).
Experimental systematic errors were obtained by independently measuring the uncertainties in force and distance. The uncertainty in force has a 1 relative error by measuring the feedback coefficient. The uncertainty in distance of 13 nm is estimated from combining the offset error and 0.3 relative fluctuation of the movement of the PZT actuation. is slightly changed into and with the same total function as obtained above, as data are artificially shifted by in the force and 13 nm in the distance respectively. Still the data fairly agree with the hypothesis of the total force composed of the residual electric and the standard Casimir force.
We then obtained the limits on nonstandard forces at around one micrometer. The potential of the nonstandard forces are generally expressed as the Yukawa-type potential,
| (4) |
where for is the density of matter, is the distance between two bodies, is the strength parameter; and is the range parameter. Assuming that the geometry of this experiment is employed, the nonstandard force is expressed from Bordag2 as , where for , and 3 is the density of BK7, chrome, and gold, respectively, and are the parameters used in Eq. (25)-(27) in Bordag2 .
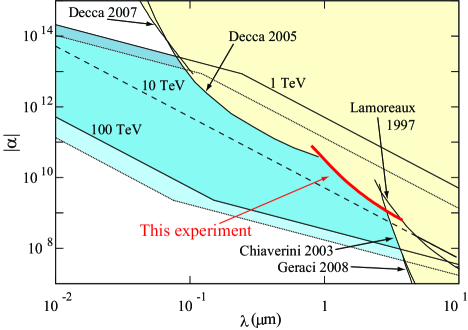
We performed 2-parameter-fit between the data and the sum of 3 functions of the electric force, the Casimir force, and the Yukawa-type forces, simultaneously using 2 fit parameters of in Eq. (3) and in Eq. (4) as changing the fixed parameter of in Eq. (4). The 2 limit on is obtained in each bin and then combined with the limit. In order to take into account systematic errors, limits on are obtained by shifting data by 1 in the force and 13 nm in the distance, simultaneously. And then the most conservative 2 limits are shown in Fig. 3. Different limits of Lamoreaux’s experiment are used in different papers (for example Decca2 and Long ). An overestimate of the accuracy of Lamoreaux’s experiment was reported Lambrecht . In particular, the error in the distance was not considered. Thus, we used the conservative 1 limits used in Long in Fig. 3. The other limits used in Fig. 3 are at 95 CL. As a result, the limits on obtained by this experiment are more stringent than previous limits in the 1.0–2.9 m range.

Using the limits on , we can search for nonstandard forces predicted by particle physics. In the theory of gauged baryon number in the bulk, it is predicted that the forces are more than five times stronger than gravity at less than 1 mm Dimopoulos0 . There are two important parameters to describe the theoretical model, and , where represents the strength of gauge coupling in dimensions and is the fundamental energy scale, which is thought to be on the order of TeV Dimopoulos0 ; Arkani2 ; Dimopoulos . The other lower limits on have been indirectly obtained from astrophysical observations. As limits on the model of graviton in the bulk, based on the observation of PSR J0952+0755, it was reported that , , 25.5, 2.77 for one, two, three, and four extra dimensions, respectively Hannestad . It has been reported that the limits that apply for extra dimensions in the graviton case now apply to extra dimensions in the gauged baryon number in the bulk. However, it has also been reported that if there are fast decay channels for the Kaluza-Klein particles or if the dimensions are not of equal size, the constrains could be further weakened Dimopoulos0 .
We have obtained experimental limits on the gauged baryon number in the bulk by measuring the Casimir forces in the sub-micrometer range. In particular, for and , the obtained limits are as shown in Fig. 4. In this calculation, it is assumed that ultraviolet cutoff scale =, as described in Dimopoulos0 . These limits are obtained for 1 and 2, where is defined as the ratio of vacuum expectation divided by . As a result, in the case of and , the obtained limits are stronger than previous limits in the range .
We have demonstrated that we can probe the essence of particle physics by searching the vacuum, which means the ground state of energy, with a tabletop experiment. The experimental sensitivity of the present study is limited by seismic vibrations MasudaSasakiAraya , and we will explore unknown interactions more comprehensively in the sub-micrometer range not only by using an advanced attenuation system but also by using high-precision displacement measurements with feedback frequency much higher than that of dominant seismic vibration.
We thank Professor A. Araya (University of Tokyo) and Professor Y. Higashi (KEK) for the use of their instruments and their useful technical suggestions. The present research was supported by KAKENHI (14047208 and 17654047) and cooperative use of the Mizusawa VERA Observatory, NAOJ.
References
- (1) H. B. G. Casimir, Proc. K. Ned. Akad. Wet. 51, 793 (1948).
- (2) M. Masuda, M. Sasaki, and A. Araya, Class. Quant. Grav. 24, 3965 (2007).
- (3) S. Dimopoulos and A. A. Geraci, Phys. Rev. D 68, 124021 (2003).
- (4) N. Arkani-Hamed, S. Dimopoulos and G. Dvali, Phys. Rev. D 59, 086004 (1999).
- (5) S. Dimopoulos and G. Giudice, Phys. Lett. B. 379, 105 (1996).
- (6) M. Bordag et al., Phys. Rep. 353, 1 (2001).
- (7) M. Bostrom and B. E. Sernelius, Phys. Rev. Lett. 84, 4757 (2001).
- (8) V. B. Svetovoy and M. V. Lokhanin, Phys. Lett. A 280, 177 (2000).
- (9) C. Genet, A. Lambrecht, and S. Reynaud, Phys. Rev. A 62, 012110 (2000).
- (10) G. L. Klimchitskaya and V. M. Mostepanenko, Phys. Rev. A 63, 062108 (2001).
- (11) R. S. Decca et al., Ann. Phys. 318, 37 (2005).
- (12) S. K. Lamoreaux, Phys. Rev. Lett. 78, 5 (1997).
- (13) U. Mohideen and A. Roy, Phys. Rev. Lett. 81 4549 (1998).
- (14) R. S. Decca et al., Phys. Rev. D 75, 077101 (2007).
- (15) R. S. Decca et al., Phys. Rev. Lett. 94, 240401 (2005).
- (16) A. Lambrecht et al., Class. Quant. Grav. 22, 5397 (2005).
- (17) S. K. Lamoreaux and W. T. Buttler, Phys. Rev. E 71, 036109 (2005).
- (18) M. Bordag, B. Geyer, G. L. Klimchitskaya, and V. M. Mostepanenko, Phys. Rev. D 58, 075003 (1998).
- (19) J. C. Long et al., Nature (London) 421, 922 (2003).
- (20) S. Hannestad and G. G. Raffelt, Phys. Rev. D 67, 125008 (2003).
- (21) J. Chiaverini, S. J. Smullin, A. A. Geraci, D. M. Weld, and A. Kapitulnik, Phys. Rev. Lett. 90, 151101 (2003).
- (22) A. A. Geraci, S. J. Smullin, D. M. Weld, J. Chiaverini, and A. Kapitulnik, Phys. Rev. D 78, 022002 (2008).