Testing the Evolutionary Sequence of High Mass Protostars with CARMA
Abstract
We present 1″ resolution CARMA observations of the 3 mm continuum and 95 GHz CH3OH masers toward 14 candidate high mass protostellar objects (HMPOs). Dust continuum emission is detected toward seven HMPOs, and CH3OH masers toward 5 sources. The 3 mm continuum sources have diameters AU, masses between 21 and 1200 , and volume densities cm-3. Most of the 3 mm continuum sources are spatially coincident with compact H II regions and/or water masers, and are presumed to be formation sites of massive stars. A strong correlation exists between the presence of 3 mm continuum emission, 22 GHz H2O masers, and 95 GHz CH3OH masers. However, no 3 mm continuum emission is detected toward ultracompact H II regions lacking maser emission. These results are consistent with the hypothesis that 22 GHz H2O masers and CH3OH masers are signposts of an early phase in the evolution of an HMPO before an expanding H II region destroys the accretion disk.
Subject headings:
stars: formation – masers1. Introduction
The evolutionary sequence of low mass star formation is broadly understood. Gravity in a prestellar core eventually overcomes the thermal, turbulent, magnetic and rotational support to form a protostar. This protostar is surrounded by an envelope and accretion disk, and launches a bipolar outflow. As the protostar accretes mass, the surrounding envelope and disk are cleared by the winds and outflows until no more mass is left to accrete (see, e.g., McKee & Ostriker, 2007).
High mass protostars share many of the same observational characteristics as their low mass counterparts: outflows (Zhang et al., 2001), jets (Caratti O Garatti et al., 2008), envelopes (Molinari et al., 1996) and possibly disks (Cesaroni et al., 2005). However, the elevated radiation environment that accompanies high mass stars raises the question as to what degree high mass star formation is merely a scaled version of low mass star formation. Answering that question is not straightforward, partly because high mass star forming regions are less common than the low mass counterparts, and tend to be more distant. The greater distance, coupled with the propensity of HMPOs to form in clusters and the disruptive influence of jets, outflows and H II regions, complicates interpretation of the observations (Zinnecker & Yorke, 2007). Therefore, to study the initial conditions of high mass star formation, it is important to identify young HMPOs before their surroundings have been altered by energetic processes.
Surveys for high mass protostars have been conducted over the years at a variety of wavelengths. Optical and radio continuum surveys of the galactic plane have identified H II regions in which massive star formation is already well underway (e.g. Maršálková, 1974; Altenhoff et al., 1979; Haynes et al., 1979). Wood & Churchwell (1989) used the IRAS catalog to search for far-infrared sources associated with ultracompact H II (UCHII) regions and high mass protostars embedded in dense cores. Massive star formation is thought to be associated with Infrared Dark Clouds (IRDCs), which are seen in absorption against the diffuse mid-infrared background of the galactic plane (Perault et al., 1996; Egan et al., 1998). The masses of IRDCs suggest that they may form stellar clusters (Rathborne et al., 2006, 2007), and IRDCs are known to host both protostars and starless cores (Wang et al., 2006). More recently, surveys with the Spitzer Space Telescope such as GLIMPSE (Benjamin et al., 2003) have identified HMPOs based on mid-infrared colors (Kumar & Grave, 2007; Cyganowski et al., 2008).
High mass star formation also coincides with a variety of masers, as demonstrated by targeted surveys of known HMPOs and blind surveys of the galactic plane (e.g. Szymczak, Hrynek, & Kus, 2000; Pandian et al., 2007). Interferometric observations have shown that water masers (at 22.2 GHz) are associated with J-shocks from jets and winds ejected by massive YSOs (Torrelles et al., 2003; Goddi et al., 2005; Moscadelli et al., 2005). Methanol masers (at 6.7 GHz) are less understood, but are thought to trace the shock where a jet meets the ambient circumstellar gas (De Buizer, 2003) and/or the innermost portions of a disk around a protostar (Edris et al., 2005). Hydroxyl maser emission (at 1.7 GHz) may also come from a disk around an accreting protostar (Edris et al., 2005), and is also associated with both H II and UCHII regions (Edris et al., 2007).
Although there are many tracers of high mass star formation (masers, radio continuum, infrared objects), they are not always spatially coincident or even found within the same object. Over the years, various observations of HMPOs have been unified under a common evolutionary sequence (see reviews by Garay & Lizano, 1999; Menten, Pillai, & Wyrowski, 2005; Beuther et al., 2007; Zinnecker & Yorke, 2007). IRDCs are thought to host the youngest protostars, perhaps surrounded by accretion disks and driving jets and outflows. The disk, jet, and outflow system are conducive for the formation of H2O, CH3OH, and possibly OH maser emission. This evolutionary stage is also distinguished by dust emission from the disk and envelope around the protostar. The development of an H II region is suppressed initially by the continued accretion of material onto the star (Walmsley, 1995). As the protostar increases in mass, temperature, and luminosity, an H II region forms that is initially gravitationally bound to the star and remains compact in size (Keto, 2002). Eventually the protostar becomes massive enough to produce an H II region that escapes the stellar gravitational potential (Keto, 2007). The H II region expands to engulf the accretion disk and envelope, which destroys the source of the masers, jets, and outflows (Lo et al., 1975; Genzel & Downes, 1977; Codella & Felli, 1995; Codella et al., 2004). This evolutionary sequence has provided a framework to explain a multitude of observations (e.g. Molinari et al., 1996; Beuther et al., 2002b; Minier et al., 2005; van der Tak & Menten, 2005).
An observational prediction of this evolutionary sequence is that compact dust continuum emission from an accretion disk or envelope will be present in HMPOs containing maser emission (Codella et al., 2004). At a more advanced stage when the H II region has grown, maser emission will be suppressed and dust emission from the disk and envelope should be at a much reduced level. Single dish maps of the dust emission exist for a number of HMPOs (Beuther et al., 2002a), but no clear correlation is present between the dust continuum luminosity and the presence of maser emission. However, the resolution of these observations (11″) is insufficient to distinguish compact emission around HMPOs from the ambient dense core. Interferometric observations have achieved significantly higher resolution (5″), but they cover a limited range of presumed evolutionary states and are insufficient to test the proposed evolutionary sequence (Molinari et al., 2002; Beltrán et al., 2004; Cesaroni et al., 2005; Zhang et al., 2007; Reid & Matthews, 2008).
In this paper, we present high resolution (1″) CARMA observations of the dust continuum and 95 GHz CH3OH maser emission toward 14 HMPOs to test the evolutionary sequence for massive stars described above. The HMPO sample was selected to cover the primary evolutionary stages in this model. With the order of magnitude improvement in angular resolution over previous single dish surveys, we can isolate any compact dust emission originating from a disk or envelope associated with an HMPO. In §2, we describe the sample of HMPOs in our survey, and the available ancillary information regarding their evolutionary state. The new CARMA observations are described in §3 and the observational results are presented in §4. In §5, we compare our results with the proposed evolutionary sequence for massive stars.
2. Sample
We drew a sample of 14 high-mass protostellar candidates from the survey of Sridharan et al. (2002). The HMPOs in the Sridharan et al. (2002) list have IRAS colors of UCHII regions (Wood & Churchwell, 1989), are detected in the CS J=2–1 survey of Bronfman et al. (1996), are bright at FIR wavelengths ( Jy, Jy), are north of 20° declination, and are not detected above 25 mJy in the 5 GHz radio continuum surveys of Gregory & Condon (1991), Wright et al. (1994) and Griffith et al. (1994).
The properties of the HMPOs selected for this study are summarized in Table 1. The HMPOs have a bolometric luminosity between and . The distances to the sources range from 1.7 to 10.5 kpc, where the near-far distance ambiguity has been resolved through a variety of methods as described in Sridharan et al. (2002). The dense cores associated with the HMPOs have masses of 400-10000 contained within a 1 pc region. We adopted the velocity and association with cm-continuum emission, H2O masers and CH3OH masers for each source given in Sridharan et al. (2002). The 3.6 cm radio continuum emission was observed with the VLA in B-array with a sensitivity of 1 mJy, and the coordinates of the detections were kindly provided by H. Beuther (private communication). The 1.2 mm continuum fluxes and positions were measured with MAMBO on the IRAM 30m telescope at a resolution of 11″ (Beuther et al., 2002a). The association with OH masers is presented in Edris et al. (2007), and were detected with the Nancay radio telescope and the GBT.
The 14 HMPOs that we observed were divided into three categories depending on the presence or absence of cm-continuum emission indicative of an UCHII region, 6.7 GHz CH3OH masers, or 22 GHz H2O masers. In order of increasing age according to the proposed evolutionary sequence (Lo et al., 1975; Genzel & Downes, 1977; Codella & Felli, 1995), our sample contains (1) five sources with (CH3OH or H2O) maser emission but no cm-continuum, (2) five sources with both cm-continuum and maser emission, and (3) four sources with cm-continuum but no maser emission. For each of these three categories, the range of distances ( kpc, kpc, kpc, respectively) and luminosities ( , , ) sampled are similar. We centered each CARMA map on the position of the peak 1.2 mm continuum emission derived from 11″ resolution single-dish observations (Beuther et al., 2002a). Note that in Sridharan et al. (2002) the source IRAS 183450641 is associated with both maser and cm-continuum emission. For the purposes of this survey, we consider IRAS 183450641 to be a maser-only HMPO because the masers and 1.2 mm continuum peak are coincident to within 1″, but the cm-continuum emission is offset from the maser position by 44″, or 2 pc.
3. CARMA Observations
Continuum and spectral line observations in the 3 mm window were obtained with CARMA (Combined Array for Research in Millimeter-wave Astronomy). CARMA is a 15 element interferometer consisting of nine 6.1 meter antennas and six 10.4 meter antennas. Data were taken in the CARMA B-array configuration between 2007 December 24 and 2008 February 11. The projected baselines in this configuration range from 65m to 800m. The CARMA correlator records signals in three separate bands, each with an upper and lower sideband. Two bands were configured for maximum bandwidth (468 MHz with 15 channels per band) to observe continuum emission, providing a total continuum bandwidth of 1.87 GHz. One band was configured with 31 MHz bandwidth across 63 channels (with a resolution of 0.488 MHz or 1.6 per channel) to observe the hyperfine lines of CH3CN (5–4) in the lower sideband (from 92.959 to 92.987 GHz) and CH3OH (80,8–) in the upper sideband (at 95.2 GHz). The FWHM of the synthesized beam with natural weighting of the visibilities is 1″ (see Table 2), and the largest angular scale that can be accurately imaged in the maps is 5″. The half-power beam width of the 10.4m antennas is 73″ at the observed frequencies.
The observing sequence was to integrate on a primary phase calibrator for 2.5 minutes, an HMPO for 7 minutes, and a secondary phase calibrator for 2.5 minutes. This cycle was repeated for 3 hours for each HMPO. Calibration and imaging were done using the MIRIAD data reduction package (Sault et al., 1995). The sources observed, along with the phase center, calibrators and the noise in the resultant continuum maps and spectra are listed in Table 2. The secondary calibrator was used to test the accuracy of the phase transfer from the primary calibrator. A passband calibrator (3C454.3) was observed for fifteen minutes in each set of observations, and radio pointing was performed every two hours thereafter. Absolute flux calibration was accomplished using Neptune, Uranus and MWC349 as primary flux calibrators and 3C454.3 as a secondary flux calibrator. Based on the repeatability of the quasar fluxes, the estimated random uncertainty in the measured source fluxes is %. Because we spent only 3 hours on each of the fourteen HMPOs we had sufficient signal to noise to detect CH3CN in only one source, IRAS 20126+4104, and the CH3CN observations are not discussed further.
4. Results
Here we present the CARMA 3 mm continuum and 95 GHz CH3OH maps and compare them with maps of 6.7 GHz CH3OH and 22 GHz H2O masers and radio continuum emission taken from the literature. We derive masses for the 3 mm detections, and present evidence for outflows eminating from these sources.
4.1. 3 mm continuum
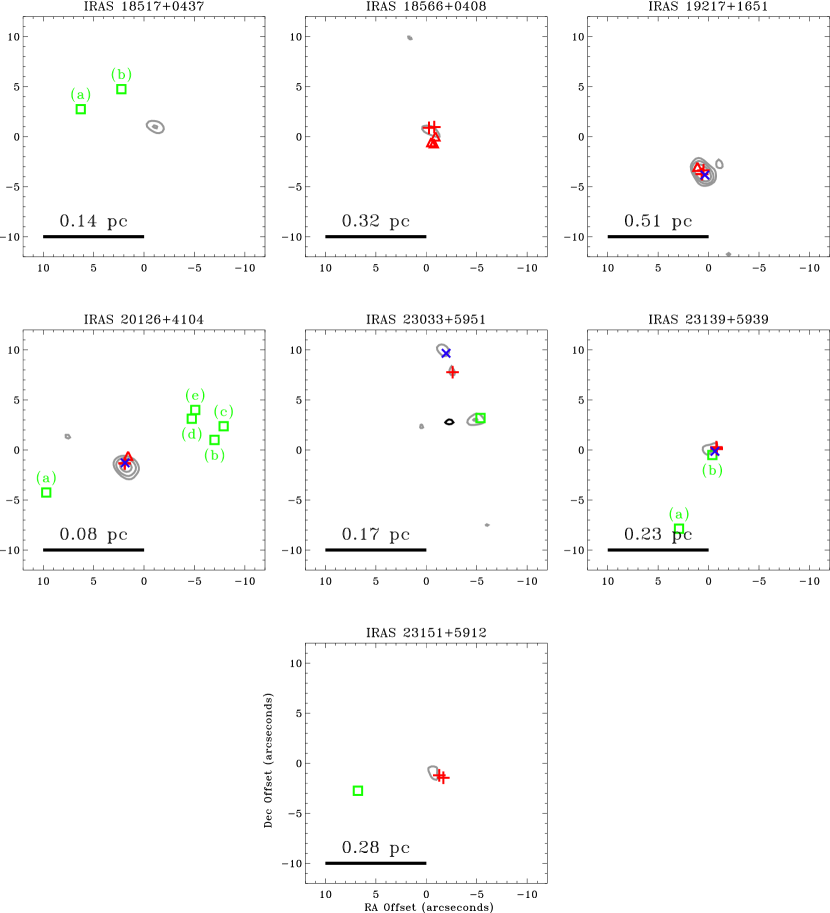
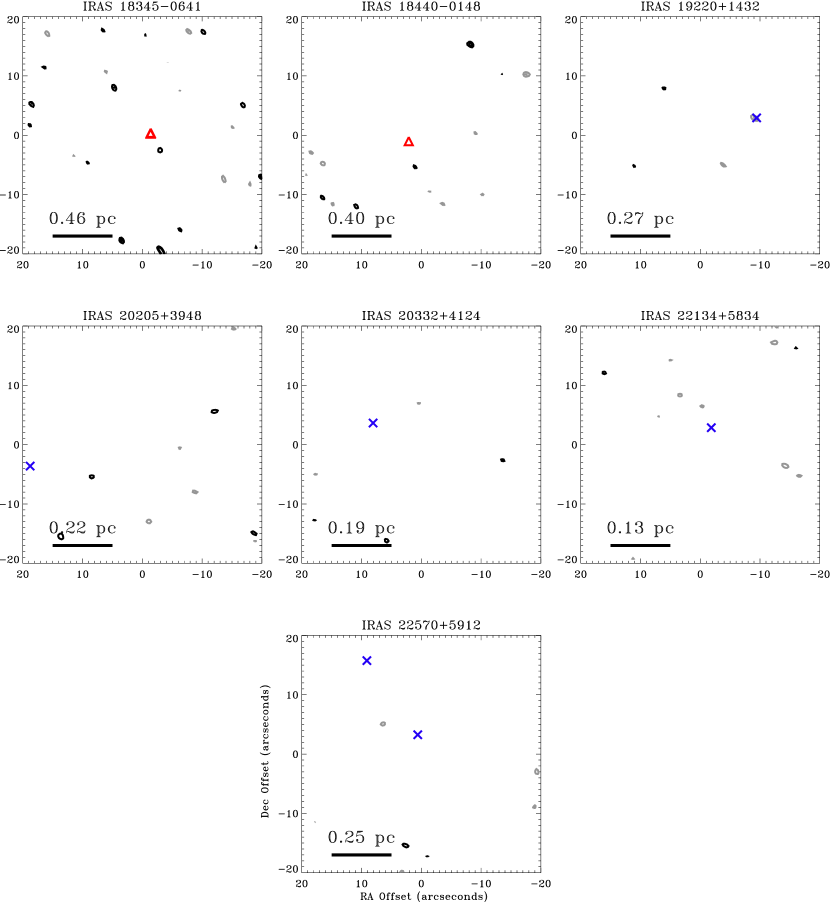
We detect 3 mm continuum emission toward seven of the fourteen HMPOs at the 3 level or greater. Contour plots of the 3 mm flux density for the detections are presented in Figure 1, and plots of the non-detections are shown in Figure 2. The sources IRAS 23033+5951 and IRAS 19217+1651 are resolved into three and two components, respectively. None of the detected sources are more than a factor of 2 larger than the 1″ beam of our maps. The secondary phase calibrators, assumed to be point sources, have the same range of sizes as the detected HMPOs, so all of the 3 mm detections are consistent with point sources at 1″ resolution blurred by seeing effects. The CARMA observations are sensitive to angular scales as large as 5″, and resolve out the majority of the extended emission associated with the star-forming regions seen in the 1.2 mm single dish maps (Beuther et al., 2002a).
The positions and measured flux densities of the 3 mm continuum sources are listed in Table 3. The brightest 3 mm continuum source detected in each map is located within 6″ of the centroid of the larger scale core traced by single dish 1.2 mm continuum emission as measured by Beuther et al. (2002a). Given the 11″ resolution of the 1.2 mm observations and the difficulty in finding the exact center of non-symmetric intensity distributions, the offsets between the 3 mm and 1.2 mm positions are most likely not significant.
4.2. Masers
We detect 95 GHz CH3OH emission toward five HMPOs. Two of the sources (IRAS 23033+5951 and IRAS 23151+5912) have a single CH3OH emission detection, and three (IRAS 18517+0437, IRAS 20126+4104 and IRAS 23139+5939) have multiple detections. Spectra for each of the detections are shown in Figure 3, and spectral parameters are summarized in Table 4. The 95 GHz CH3OH lines are bright (with brightness temperatures around a few hundred Kelvin), narrow (unresolved at 1.6 resolution) and spatially unresolved. Therefore the inferred brightness temperatures are lower limits and the lines are likely to be masing.
The five HMPOs that have 95 GHz CH3OH masers are also detected in the 3 mm continuum. The location of the presumed masers are marked on the 3 mm contour maps in Figure 1. Two 95 GHz CH3OH masers are coincident with the 3 mm continuum emission to within 0.6″ (or 2000-3000 AU), while the other nine masers are separated by 104 AU from the 3 mm continuum peaks (see Table 4). The projected spatial offsets are consistent with the expectation that the 95 GHz masers are collisionally pumped at the interface between outflows and the interstellar medium (Minier & Booth, 2002). All of the CH3OH lines are found within 2 of the systemic velocity of the HMPO, implying that the masers form in the colliding gas. Our finding that the maser line is found at nearly the same velocity as the ambient medium is consistent with the results of Minier & Booth (2002), who find that this maser line is often, but not always, at the systemic velocity of the HMPO.
The location of known centimeter continuum sources, H2O masers, and CH3OH masers are marked on the contour maps in Figures 1 and 2. Six of the seven CARMA 3 mm continuum detections (all except IRAS 18517+0437) were included in an interferometric survey of 22 GHz H2O and 6.7 GHz CH3OH masers by Beuther et al. (2002b). Water masers have been identified toward all six cores detected with CARMA, and three of these cores also have 6.7 GHz CH3OH masers. For HMPOs with both 22 GHz H2O and 6.7 GHz CH3OH masers, the two types of masers are spatially coincident to within 1-2″. Both types of masers also fall within 1″ of our 3 mm continuum positions, as shown in Figure 1. Of the multiple 3 mm components resolved in IRAS 19217+1651 and IRAS 23033+5951, one is coincident with H2O masers in each of the HMPOs.
4.3. Radio Continuum
Four of ten 3 mm continuum sources are located within 1″ of a 3.6 cm radio continuum source. The 3 mm continuum emission for these objects may originate from free-free or thermal dust emission. If we assume that the sources in our sample are typical of other UCHII regions, the free-free emission will be optically thick (i.e. ) for GHz, and optically thin () for higher frequencies (Hunter et al., 1998; Turner & Beck, 2004; Zapata et al., 2008; Hunter et al., 2008). For a “typical” UCHII radio continuum spectrum, the expected 3 mm continuum flux density from free-free emission will be less than a factor of 2.7 higher than the 3.6 cm flux density. We estimate the relative contributions of free-free and dust emission to the observed 3 mm flux density using available data from the literature.
The source IRAS 19217+1651 was observed with the VLA by Garay et al. (2007), who measured a 7 mm flux density of mJy towards the brighter of the two CARMA detections at 3 mm. The 3mm flux density of the brighter component is mJy; an additional calibration uncertainty of 10% should be included in both the 7 mm and 3 mm flux density measurements. The 7 mm detection is consistent with optically thin free-free emission (Garay et al., 2007), and implies that the free-free contribution to the 3 mm flux density is 46 mJy. The HMPO IRAS 20126+4104 was observed with the VLA between 20 cm and 7 mm by Hofner et al. (2007), who conclude that free-free emission should contribute 4 mJy at 3 mm, which is a small fraction of the mJy detected with CARMA. Our CARMA observations detect three regions of 3 mm emission towards the HMPO IRAS 23033+5951, of which the northernmost is associated with 3.6 cm emission of 1.7 mJy (Sridharan et al., 2002). For a “typical” UCHII radio continuum spectrum, the free-free emission would contribute less than 4.6 mJy of the mJy detected with CARMA. The HMPO IRAS 23139+5939 has a flux density of 1.4 mJy at 3.6 cm (Sridharan et al., 2002), so we assume that the free-free emission contributes no more than 3.8 mJy of the mJy detected with CARMA at 3 mm. For regions without 3.6 cm emission, we assume that dust accounts for all of the observed 3 mm flux density.
4.4. Masses
We derive the total (gas and dust) mass for each of the CARMA continuum detections from the observed 3 mm flux density, assuming optically thin emission from isothermal dust, using the equation
| (1) |
where is the integrated flux density, is the fraction of 3 mm emission from dust, is the distance, is the dust emissivity and is the Planck function. The value of the dust emissivity is extrapolated from a value of cm2 g-1 at 250 µm assuming a power law spectral index of (Hildebrand, 1983, i.e. ). For 95 GHz continuum observations, the mass can be derived as
| (2) |
where we use the Rayleigh-Jeans approximation to the Planck function and assume a temperature of 50 K. Since the 3 mm continuum emitting regions are not resolved by our observations, a lower limit on the volume density is derived assuming spherical geometry with a diameter equal to the resolution and a mean molecular weight per free particle of 2.37. Estimated masses and densities for the individual 3 mm continuum sources are summarized in Table 3. The dominant source of uncertainty in the derived masses is the dust emissivity, which is uncertain by a factor of a few (Hildebrand, 1983).
The masses of the sources detected in the CARMA 3 mm continuum maps range between 21 and 1200 with volume densities in excess of 108 cm-3. These masses and densities can be compared to the large scale core traced by single dish 1.2 mm continuum maps (Beuther et al., 2002a). Assuming that the large scale core and the compact clumps have the same temperature and dust emissivity, we find that the compact 3 mm sources contain 20% of the total core mass, and have volume densities that are larger by a factor of 1000 than the average core density.
4.5. Outflows
All 14 HMPO candidates in our sample were observed by Sridharan et al. (2002) with the CSO or IRAM 30 m telescopes to measure the CO (2–1) line profile. All were seen to have broad-line wings consistent with bipolar outflows, suggesting that outflow activity is common in these high-mass star forming regions. The Sridharan et al. (2002) survey also searched for SiO (2–1) emission, another common outflow tracer, from 12 of the 14 HMPO candidates in our sample (all except IRAS 18517+0437 and IRAS 20332+4124), resulting in seven detections. Of the seven HMPO candidates with SiO (2–1) emission, six are associated with 3 mm continuum emission detected by CARMA, and none of the HMPO candidates without SiO (2–1) emission were detected with CARMA. Furthermore, of the five HMPO candidates that have nearby 95 GHz CH3OH maser emission, four are also associated with SiO (2–1) emission and the fifth was not included in the survey of Sridharan et al. (2002). However, the resolution of the single-dish observations (10-30″) is not sufficient to determine whether or not the HMPOs detected with CARMA are driving any these outflows.
Interferometric observations have reported detections of outflows from 5 of the 14 HMPOs in our CARMA survey:
1) Zhang et al. (2007) observed SiO (2–1) at 5″ resolution towards the HMPO IRAS 18566+0408, and found that the emission traces a collimated outflow, originating from the position of the CARMA 3 mm continuum detection.
2) SiO (2–1) and CO (2–1) emission from the HMPO IRAS 19217+1651 were observed by Beuther et al. (2004) at 2-6″ resolution. There is a bipolar outflow seen in both transitions, originating from the position of the CARMA 3 mm continuum source.
3) IRAS 20126+4104 has been observed at high resolution by Shepherd et al. (2000), who report the presence of a N-S oriented molecular outflow and a NW-SE oriented jet centered on the position of the CARMA continuum source. Shocks identified by H2 and [S II] emission trace the jet, and are coincident with the positions of the 95 GHz CH3OH masers detected by CARMA, in agreement with the hypothesis that these maser lines are collisionally pumped at the interface between jets/outflows and the ambient medium around the protostar.
4) CARMA found three 3 mm continuum peaks towards IRAS 23033+5951, one associated with 3.6 cm emission, one with a H2O maser, and one with 95 GHz CH3OH maser emission. This region has been studied by Reid & Matthews (2008), who study the outflows in this region at 6″ resolution. There are at least two outflows in this region, one identified by HCO+ (1–0) emission, and one identified by CH3OH (2–1) and SiO (2–1) emission. The CARMA 3 mm continuum source coincident with the H2O maser is most likely to be driving the SiO outflow, and it is unclear what drives the HCO+ outflow or is exciting the 95 GHz CH3OH maser.
5) The 3 mm continuum source detected with CARMA in IRAS 23151+5912 is coincident with “Peak 1” in the 875 µm continuum map of Beuther et al. (2007) and with the 3.4 mm and 1.3 mm continuum source detected by Qiu et al. (2007). There are at least two outflows, identified by SiO (2–1) and (8–7) emission, in this region, one oriented roughly W-E and the other N-S (Beuther et al., 2007; Qiu et al., 2007). The outflows are likely driven by two protostars, and it is not clear if the 3 mm continuum emission detected with CARMA corresponds to one or both protostars, or if the 95 GHz CH3OH maser is related to the interaction between the W-E outflow and the ambient medium.
5. Discussion
One proposed evolutionary sequence for HMPOs is that they originate from low or intermediate mass protostars that are accreting material from the surrounding core, presumably via a circumstellar disk (Beuther et al., 2007). As the protostar increases in mass, an H II region ultimately forms that eventually expands and halts accretion. While it is unclear if H2O or 6.7 GHz CH3OH masers originate from the disk or outflow, the observational evidence suggests these masers trace an early stage of evolution before the H II region has expanded significantly (Lo et al., 1975; Genzel & Downes, 1977; Walsh et al., 1998; Codella et al., 2004). In this scenario, a young HMPO with an accretion disk would be identified by its water and/or methanol masers and mm-wavelength thermal emission from the dust around the protostar. When the HMPO is “intermediate aged”, an UCHII region detectable with cm-wavelength continuum emission would grow but will not immediately disrupt the accretion, so masers and dust thermal emission would also be present. As the UCHII region expands, it will destroy the disk and cut off the masers. We now evaluate whether or not the CARMA observations are consistent with this evolutionary sequence.
First, we discuss if the compact sources detected in the CARMA 3 mm continuum maps signify the presence of a high mass protostar. The masses of the compact sources range between 21 and 1200 contained within a region 10,000 AU in diameter. Thus these compact 3 mm continuum sources are substantially denser and more massive than the dense cores found in nearby clouds known to be forming low mass stars. Even if we assume only 10% of the core mass forms into a star, a mid B-type star can potentially form in these cores. Moreover, four of the 3 mm continuum sources are spatially coincident with compact H II regions, confirming directly the presence of a high mass star. Therefore, we assume that all of the compact 3 mm continuum sources represent dense dust and gas surrounding a high mass star or protostar. We cannot determine if the material is distributed in a disk or compact envelope (e.g. Beltrán et al., 2004; Cesaroni et al., 2005; Reid & Matthews, 2008), however, as the dust continuum emission is unresolved by these observations.
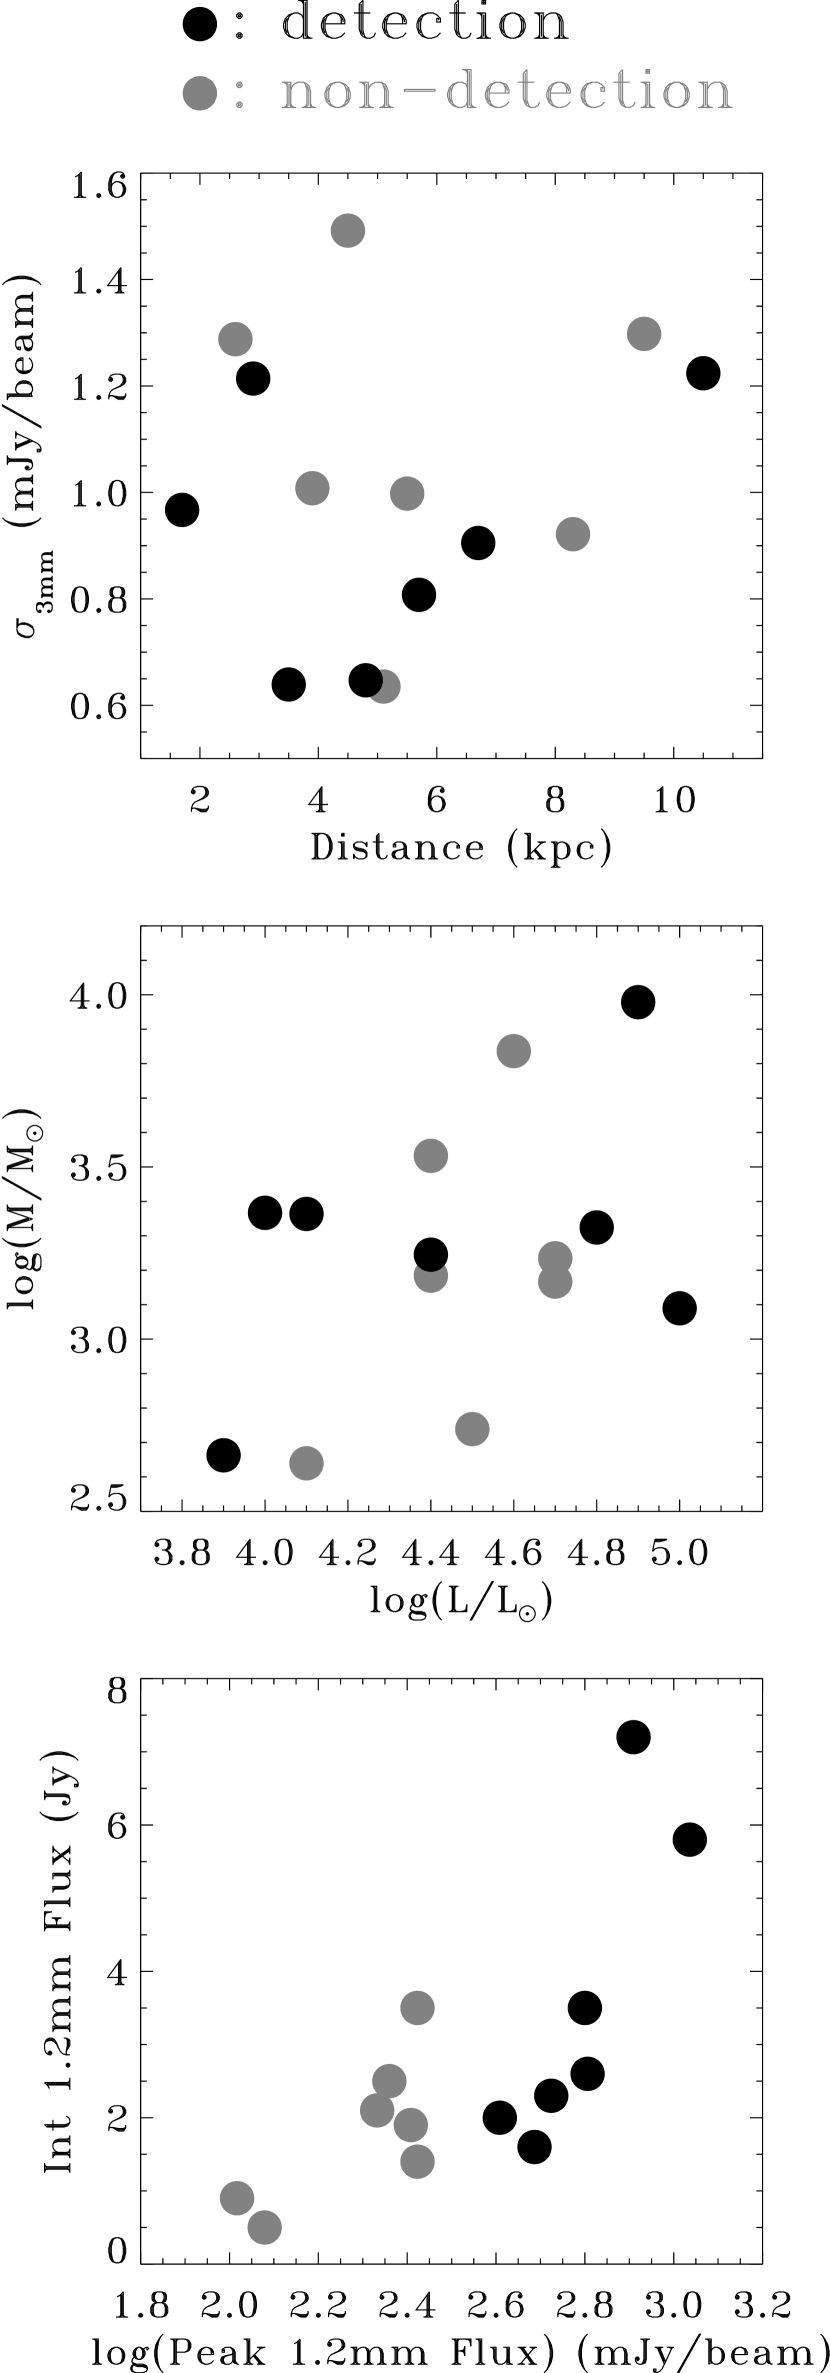
Since 3 mm continuum emission is detected toward 7 of the 14 HMPOs in our survey we investigate whether the 50% detection rate is set by physical differences between the high mass cores or by selection bias. A bias may be introduced since the HMPOs span a factor of 6 in distance and a factor of 10 in luminosity, but the sensitivity in each of the CARMA maps is approximately the same. In the top panel of Figure 4, we plot the noise in the CARMA 3 mm continuum maps as a function of the distance to the HMPO for sources with (black circles) and without (gray circles) CARMA continuum detections. No clear differences in the noise characteristics or source distances are found between the two samples. The middle panel shows the core masses derived from single dish 1.2 mm continuum maps versus the bolometric luminosity of the core. Again, sources with and without 3 mm CARMA continuum detections share similar distributions, indicating that the CARMA observations did not preferentially detect cores with the highest mass or luminosity. Finally, the bottom panel in Figure 4 shows how the peak flux density in the MAMBO single dish 1.2 mm continuum maps varies with the integrated 1.2 mm flux density. We detect (at the level) 3 mm continuum emission from all seven of the HMPOs with 1.2 mm peak fluxes above 300 mJy/(11″)2, while none of the seven HMPOs below that threshold are detected.
Is there an observational bias for detecting only those sources with the highest peak surface brightnesses at 1.2 mm, or is there an intrinsic difference between those cores above and below the 300 mJy/beam threshold? The peak 1.2 mm flux densities in our sample are all 100 mJy/beam. If the 1.2 mm flux density in the 11″ single dish beam originates from an unresolved disk or envelope, we would expect to observe flux densities of 4 mJy/beam at 3 mm assuming an emissivity spectral index of , which is appropriate for disks (Beckwith & Sargent, 1991). The noise in the 3 mm continuum maps is approximately 1 mJy/beam, and all 14 HMPO candidates would be detectable at level if the central emission were compact.
Given that all 14 HMPO candidates could have been detected with CARMA, we consider whether differences in the CARMA 3 mm continuum detection rate versus peak 1.2 mm flux density could be explained by the presence or absence of an unresolved disk or envelope. The median integrated 3 mm flux density detected with CARMA is 10 mJy, which, assuming an emissivity spectral index of , would contribute 180 mJy/beam of emission at 1.2 mm. This is approximately equal to the difference between the peak 1.2 mm flux densities of the faintest HMPOs detected by CARMA ( 400 mJy/beam @ 1.2 mm) and the brightest HMPOs not detected with CARMA ( 250 mJy/beam). Thus the lack of CARMA detections around sources with low peak 1.2 mm flux densities, but otherwise large integrated 1.2 mm flux densities and far-infrared luminosities, may indicate that a compact disk or envelope has dissipated around these sources.
Since the detection rate of 3 mm sources is not strongly biased by the range of distances, masses and luminosities in our sample, we investigate if the evolutionary stage correlates with the detection rate of compact 3 mm sources. The signposts of the age sequence that we are testing, in order of increasing age, are: (1) presence of 6.7 GHz CH3OH and/or 22 GHz H2O maser emission and no cm continuum emission, (2) both maser and cm continuum emission, and (3) cm continuum emission but an absence of masers (Lo et al., 1975; Genzel & Downes, 1977; Codella et al., 1994; Codella & Felli, 1995). For each of the 14 massive cores in our survey, we list the presence of 3 mm continuum, cm continuum, and maser emission in Table 5.
We detect 3 mm continuum emission from 3/5 of the “youngest” HMPOs, 4/5 of the “intermediate” aged HMPOs and 0/4 of the “oldest” HMPOs. Thus, the 3 mm continuum emission is preferentially detected toward the sources with maser emission, consistent with the proposed evolutionary sequence for high mass stars. Further, we would expect that the H2O masers and the 6.7 GHz CH3OH masers to be nearly coincident with the compact 3 mm sources, since VLBI observations suggest that these masers originate from shocks associated with winds or jets near the base of the molecular outflow (Goddi et al., 2005; Moscadelli et al., 2005). All thirteen H2O masers with interferometric positions, and five of the eight 6.7 GHz CH3OH masers, are in fact located within 1.5″ of a compact 3 mm continuum source. It is possible that the CH3OH maser sources without associated 3 mm continuum emission may have too low of disk or envelope mass to be detected in our observations.
In summary, all of the H2O and most of the 6.7 GHz CH3OH maser emission appear to be related to massive disks or envelopes, but these disks/envelopes are not present toward sources that have radio continuum emission but no maser emission. The probability of association between HMPOs with 3 mm continuum emission and HMPOs with 22 GHz H2O masers and 6.7 GHz CH3OH masers is 98% and 71%, respectively. These 3 mm continuum sources are also likely to be driving outflows, and there is a 98% likelihood that 3 mm continuum emission is associated with two possible outflow tracers, SiO (2–1) emission and 95 GHz CH3OH masers. There is a 99.8% likelihood of association between these two spectral lines. These observations are consistent with the hypothesis that as an H II region around a high mass protostar expands, it destroys the surrounding disk and envelope, and consequently shuts off the source of the outflows and H2O and CH3OH masers.
6. Summary
In this paper we tested the hypothesis that H2O and CH3OH masers are signposts of an early phase in the evolution of a high mass protostellar object before an expanding UCHII region has destroyed the accretion disk. We used CARMA to observe the 3 mm continuum emission at 1″ resolution around a sample of HMPOs with and without masers and cm continuum emission. We also observed the 95 GHz CH3OH line to determine its association with the thermal emission from dust surrounding the protostars.
We detect (at significance) 3 mm continuum emission from all seven HMPOs with MAMBO 1.2 mm continuum peak fluxes (taken from Beuther et al. 2002a) above 300 mJy/(11″)2, while none of the seven HMPOs with peak fluxes below this threshold were detected in our survey. We argue that this is not merely an observational selection effect, because all 14 HMPO candidates could have been detected in the CARMA maps if their 1.2 mm peak fluxes originated from disks or compact envelopes, and were therefore concentrated into the 1″ CARMA beam. The detection rate of HMPOs at 3 mm is not correlated with distance to the HMPO, the 1.2 mm integrated flux detected with MAMBO, the total luminosity of the HMPO or its mass (see Figure 4).
All seven HMPOs detected at 3 mm are associated with H2O masers, and only two of the seven HMPOs not detected at 3 mm are associated with H2O masers. The 22 GHz H2O masers and 95 GHz CH3OH lines are significantly (98% probability) associated with the detection rate of 3 mm continuum emission. There is no significant association between the detection rate of 3 mm continuum and 6.7 GHz CH3OH or 1.7 GHz OH masers or cm continuum emission. The presence of SiO (2–1) emission in the study of Sridharan et al. (2002) was also a useful predictor of CARMA 3 mm continuum detections (98% probability) and 95 GHz CH3OH masers (99.8% probability).
The general picture of the evolution of high-mass protostars is consistent with our observations that the 3 mm continuum emission comes from a disk and/or compact envelope around an HMPO. Our observations suggest that H2O masers are associated with these disks/envelopes, and that they are present both prior to and during the formation of an UCHII region. When the UCHII region disrupts the disk and compact envelope around the HMPO, the H2O and 95 GHz CH3OH masers are likely to be cut off and the 3 mm continuum emission falls below our threshold of detectability.
References
- Altenhoff et al. (1979) Altenhoff, W. J., Downes, D., Pauls, T., & Schraml, J. 1979, A&AS, 35, 23
- Arce & Sargent (2006) Arce, H. G., & Sargent, A. I. 2006, ApJ, 646, 1070
- Beckwith & Sargent (1991) Beckwith, S. V. W., & Sargent, A. I. 1991, ApJ, 381, 250
- Beltrán et al. (2004) Beltrán, M. T., Cesaroni, R., Neri, R., Codella, C., Furuya, R. S., Testi, L., & Olmi, L. 2004, ApJ, 601, L187
- Benjamin et al. (2003) Benjamin, R. A., et al. 2003, PASP, 115, 953
- Beuther et al. (2002a) Beuther, H., Schilke, P., Menten, K. M., Motte, F., Sridharan, T. K., & Wyrowski, F. 2002a, ApJ, 566, 945
- Beuther et al. (2002b) Beuther, H., Walsh, A., Schilke, P., Sridharan, T. K., Menten, K. M., & Wyrowski, F. 2002b, A&A, 390, 289
- Beuther et al. (2004) Beuther, H., Schilke, P., & Gueth, F. 2004, ApJ, 608, 330
- Beuther et al. (2007) Beuther, H., Zhang, Q., Hunter, T. R., Sridharan, T. K., & Bergin, E. A. 2007, A&A, 473, 493
- Bronfman et al. (1996) Bronfman, L., Nyman, L.-A., & May, J. 1996, A&AS, 115, 81
- Caratti O Garatti et al. (2008) Caratti O Garatti, A., Froebrich, D., Eislöffel, J., Giannini, T., & Nisini, B. 2008, A&A, 485, 137
- Cesaroni et al. (2005) Cesaroni, R., Neri, R., Olmi, L., Testi, L., Walmsley, C. M., & Hofner, P. 2005, A&A, 434, 1039
- Codella et al. (1994) Codella, C., Felli, M., Natale, V., Palagi, F., & Palla, F. 1994, A&A, 291, 261
- Codella & Felli (1995) Codella, C., & Felli, M. 1995, A&A, 302, 521
- Codella et al. (2004) Codella, C., Lorenzani, A., Gallego, A. T., Cesaroni, R., & Moscadelli, L. 2004, A&A, 417, 615
- Cragg et al. (2002) Cragg, D. M., Sobolev, A. M., & Godfrey, P. D. 2002, MNRAS, 331, 521
- Cyganowski et al. (2008) Cyganowski, C. J. et al. 2008, astroph-0810.0530
- De Buizer (2003) De Buizer, J. M. 2003, MNRAS, 341, 277
- Edris et al. (2005) Edris, K. A., Fuller, G. A., Cohen, R. J., & Etoka, S. 2005, A&A, 434, 213
- Edris et al. (2007) Edris, K. A., Fuller, G. A., & Cohen, R. J. 2007, A&A, 465, 865
- Egan et al. (1998) Egan, M. P., Shipman, R. F., Price, S. D., Carey, S. J., Clark, F. O., & Cohen, M. 1998, ApJ, 494, L199
- Elitzur et al. (1989) Elitzur, M., Hollenbach, D. J., & McKee, C. F. 1989, ApJ, 346, 983
- Ellingsen (2007) Ellingsen, S. P. 2007, MNRAS, 377, 571
- Garay & Lizano (1999) Garay, G., & Lizano, S. 1999, PASP, 763, 1049
- Garay et al. (2007) Garay, G., Rodríguez, L. F., & de Gregorio-Monsalvo, I. 2007, AJ, 134, 906
- Genzel & Downes (1977) Genzel, R., & Downes, D. 1977, A&AS, 30, 145
- Goddi et al. (2005) Goddi, C., Moscadelli, L., Alef, W., Tarchi, A., Brand, J., & Pani, M. 2005, A&A, 432, 161
- Gregory & Condon (1991) Gregory, P. C., & Condon, J. J. 1991, ApJS, 75, 1011
- Griffith et al. (1994) Griffith, M. R., Wright, A. E., Burke, B. F., & Ekers, R. D. 1994, ApJS, 90, 179
- Haynes et al. (1979) Haynes, R. F., Caswell, J. L., & Simons, L. W. J. 1979, Australian Journal of Physics Astrophysical Supplement, 48, 1
- Hildebrand (1983) Hildebrand, R. H. 1983, QJRAS, 24, 267
- Hofner et al. (2007) Hofner, P., Cesaroni, R., Olmi, L., Rodríguez, L. F., Martí, J., & Araya, E. 2007, A&A, 465, 197
- Hunter et al. (1998) Hunter, T. R., Neugebauer, G., Benford, D. J., Matthews, K., Lis, D. C., Serabyn, E., & Phillips, T. G. 1998, ApJ, 493, L97
- Hunter et al. (2008) Hunter, T. R., Brogan, C. L., Indebetouw, R., & Cyganowski, C. J. 2008, ApJ, 680, 1271
- Keto (2002) Keto, E. 2007, ApJ, 580, 980
- Keto (2007) Keto, E. 2007, ApJ, 666, 976
- Kumar & Grave (2007) Kumar, M. S. N., & Grave, J. M. C. 2007, A&A, 472, 155
- Lo et al. (1975) Lo, K. Y., Burke, B. F., & Haschick, A. D. 1975, ApJ, 202, 81
- Maršálková (1974) Maršálková, P. 1974, Ap&SS, 27, 3
- McKee & Ostriker (2007) McKee, C. F., & Ostriker, E. C. 2007, ARA&A, 45, 565
- Menten, Pillai, & Wyrowski (2005) Menten, K. M., Pillai, T., & Wyrowski, F. 2005, IAU Symposium 227, eds R. Cesaroni, R., M. R. Felli, E. Churchwell, and M. Walmsley (Cambridge University Press: Cambridge), 23
- Minier & Booth (2002) Minier, V., & Booth, R. S. 2002, A&A, 387, 179
- Minier et al. (2005) Minier, V., Burton, M. G., Hill, T., Pestalozzi, M. R., Purcell, C. R., Garay, G., Walsh, A. J., & Longmore, S. 2005, A&A, 429, 945
- Molinari et al. (1996) Molinari, S., Brand, J., Cesaroni, R., & Palla, F. 1996, A&A, 308, 573
- Molinari et al. (2002) Molinari, S., Testi, L., Rodríguez, L. F., & Zhang, Q. 2002, ApJ, 570, 758
- Moscadelli et al. (2005) Moscadelli, L., Cesaroni, R., & Rioja, M. J. 2005, A&A, 438, 889
- Pandian et al. (2007) Pandian, J. D., Goldsmith, P. F., Deshpande, A. A. 2007, ApJ, 656, 255
- Perault et al. (1996) Perault, M., et al. 1996, A&A, 315, L165
- Qiu et al. (2007) Qiu, K., Zhang, Q., Beuther, H., & Yang, J. 2007, ApJ, 654, 361
- Rathborne et al. (2006) Rathborne, J. M., Jackson, J. M., & Simon, R. 2006, ApJ, 641, 389
- Rathborne et al. (2007) Rathborne, J. M., Simon, R., & Jackson, J. M. 22007, ApJ, 662, 1082
- Reid & Matthews (2008) Reid, M. A., & Matthews, B. C. 2008, ApJ, 675, 1343
- Sault et al. (1995) Sault, R. J., Teuben, P. J., & Wright, M. C. H. 1995, Astronomical Data Analysis Software and Systems IV, 77, 433
- Shepherd et al. (2000) Shepherd, D. S., Yu, K. C., Bally, J., & Testi, L. 2000, ApJ, 535, 833
- Sridharan et al. (2002) Sridharan, T. K., Beuther, H., Schilke, P., Menten, K. M., & Wyrowski, F. 2002, ApJ, 566, 931
- Szymczak, Hrynek, & Kus (2000) Szymczak, M., Hrynek, G., & Kus, A. J. 2000, A&AS, 143, 269
- Torrelles et al. (2003) Torrelles, J. M., et al. 2003, ApJ, 598, L115
- Turner & Beck (2004) Turner, J. L., & Beck, S. C. 2004, ApJ, 602, L85
- van der Tak & Menten (2005) van der tak, F. F. S., & Menten, K. M. 2005, A&A, 2005, 437, 947
- Walmsley (1995) Walmsley, M. 1995, RevMexAA, 1, 137
- Walsh et al. (1998) Walsh, A. J., Burton, M. G., Hyland, A. R., & Robinson, G. 1998, MNRAS, 301, 640
- Wang et al. (2006) Wang, Y., Zhang, Q., Rathborne, J. M., Jackson, J., & Wu, Y. 2006, ApJ, 651, L125
- Wood & Churchwell (1989) Wood, D. O. S., & Churchwell, E. 1989, ApJ, 340, 265
- Wright et al. (1994) Wright, A. E., Griffith, M. R., Burke, B. F., & Ekers, R. D. 1994, ApJS, 91, 111
- Zapata et al. (2008) Zapata, L. A., Leurini, S., Menten, K. M., Schilke, P., Rolffs, R., & Hieret, C. 2008, AJ, 136, 1455
- Zhang et al. (2001) Zhang, Q., Hunter, T. R., Brand, J., Sridharan, T. K., Molinari, S., Kramer, M. A., & Cesaroni, R. 2001, ApJ, 552, L167
- Zhang et al. (2007) Zhang, Q., Sridharan, T. K., Hunter, T. R., Chen, Y., Beuther, H., & Wyrowski, F. 2007, A&A, 470, 269
- Zinnecker & Yorke (2007) Zinnecker, H., & Yorke, H. W. 2007, ARA&A, 45, 481
| IRAS Name | Group11Group 1: With 22 GHz H2O and/or 6.7 CH3OH masers and no cm continuum, Group 2: With 22 GHz H2O and/or 6.7 CH3OH masers and cm continuum, Group 3: Without 22 GHz H2O or 6.7 CH3OH masers and with cm continuum | distance22From Sridharan et al. (2002) | VLSR22From Sridharan et al. (2002) | log(Ltotal/ )22From Sridharan et al. (2002) | Peak (1.2 mm)331.2 mm continuum flux densities from Beuther et al. (2002a), measured in a 11″ beam | Integrated (1.2 mm)331.2 mm continuum flux densities from Beuther et al. (2002a), measured in a 11″ beam | Core Mass44Mass of gas and dust inferred from 1.2 mm continuum flux densities, taken from Beuther et al. (2002a) |
|---|---|---|---|---|---|---|---|
| (kpc) | ( ) | (mJy/beam) | (Jy) | ( ) | |||
| 183450641 | 1 | 9.5 | 95.9 | 4.6 | 265 | 1.4 | 6860 |
| 184400148 | 1 | 8.3 | 97.6 | 4.7 | 120 | 0.5 | 1717 |
| 18517+0437 | 1 | 2.9 | 43.9 | 4.1 | 812 | 7.2 | 2310 |
| 18566+0408 | 1 | 6.7 | 85.2 | 4.8 | 486 | 1.6 | 2110 |
| 23151+5912 | 1 | 5.7 | 54.4 | 5.0 | 406 | 2.0 | 1229 |
| 19217+1651 | 2 | 10.5 | 3.5 | 4.9 | 640 | 2.6 | 9518 |
| 20126+4104 | 2 | 1.7 | 3.8 | 3.9 | 1087 | 5.8 | 460 |
| 20332+4124 | 2 | 3.9 | 2.0 | 4.4 | 265 | 3.5 | 1529 |
| 23033+5951 | 2 | 3.5 | 53.1 | 4.0 | 631 | 3.5 | 2327 |
| 23139+5939 | 2 | 4.8 | 44.7 | 4.4 | 530 | 2.3 | 1759 |
| 19220+1432 | 3 | 5.5 | 68.8 | 4.4 | 256 | 1.9 | 3406 |
| 20205+3948 | 3 | 4.5 | 1.7 | 4.5 | 104 | 0.9 | 548 |
| 22134+5834 | 3 | 2.6 | 18.3 | 4.1 | 229 | 2.5 | 436 |
| 22570+5912 | 3 | 5.1 | 46.7 | 4.7 | 215 | 2.1 | 1469 |
| IRAS Name | RA11Phase center positions taken from 1.2 mm coordinates listed in Beuther et al. (2002a) | Dec11Phase center positions taken from 1.2 mm coordinates listed in Beuther et al. (2002a) | Phase Calibrators | Resolution22FWHM synthesized beam size with natural weighting | Continuum Noise | Noise/channel33Channel width of 0.488 MHz |
|---|---|---|---|---|---|---|
| J2000 | J2000 | () | (mJy/beam) | (mJy/beam) | ||
| 183450641 | 18:37:17.02 | 06:38:30.70 | 1751+096,1743038 | 1.60.7 | 1.3 | 62 |
| 184400148 | 18:46:36.56 | 01:45:21.20 | 1751+096,1743038 | 1.60.7 | 0.9 | 34 |
| 18517+0437 | 18:54:14.32 | +04:41:39.69 | 1751+096,1743038 | 1.40.7 | 1.2 | 49 |
| 18566+0408 | 18:59:10.02 | +04:12:14.69 | 1751+096,1743038 | 1.60.7 | 0.9 | 26 |
| 19217+1651 | 19:23:58.77 | +16:57:44.80 | 1751+096,1925+211 | 1.50.7 | 1.2 | 31 |
| 19220+1432 | 19:24:20.05 | +14:38:03.60 | 1751+096,1925+211 | 1.40.7 | 1.0 | 32 |
| 20126+4104 | 20:14:25.86 | +41:13:33.99 | BLLAC,2007+404 | 1.40.8 | 1.0 | 37 |
| 20205+3948 | 20:22:20.87 | +39:58:15.00 | BLLAC,2007+404 | 1.60.8 | 1.5 | 78 |
| 20332+4124 | 20:34:59.72 | +41:34:49.40 | BLLAC,2007+404 | 1.20.6 | 1.0 | 39 |
| 22134+5834 | 22:15:09.51 | +58:49:05.99 | BLLAC,2007+404 | 1.50.8 | 1.3 | 61 |
| 22570+5912 | 22:59:05.37 | +59:28:19.18 | BLLAC,0102+584 | 1.00.8 | 0.6 | 30 |
| 23033+5951 | 23:05:25.31 | +60:08:06.28 | BLLAC,0102+584 | 1.00.8 | 0.6 | 22 |
| 23139+5939 | 23:16:10.45 | +59:55:28.48 | BLLAC,0102+584 | 1.00.8 | 0.6 | 26 |
| 23151+5912 | 23:17:21.02 | +59:28:48.48 | BLLAC,0102+584 | 1.20.7 | 0.8 | 34 |
| IRAS Name | RA | Dec | ()11Difference between the measured 3 mm continuum source and the 1.2 mm core (see Table 1) | 22Fraction of 3 mm emission from dust (see Section 4) | Mass | Density | ||
|---|---|---|---|---|---|---|---|---|
| J2000 | J2000 | () | (mJy/beam) | (mJy) | ( ) | (108 cm-3 ) | ||
| 18517+0437 | 18:54:14.24 | +04:41:40.7 | (1.1, 1.0) | 8.51.4 | 162 | 1.0 | 74 | 8.6 |
| 18566+0408 | 18:59:09.99 | +04:12:15.3 | (0.4, 0.6) | 4.41.2 | 102 | 1.0 | 250 | 2.3 |
| 19217+1651 | 19:23:58.81 | +16:57:41.1 | ( 0.6,3.7) | 553 | 661 | 0.3 | 1200 | 2.9 |
| 19217+1651 | 19:23:58.70 | +16:57:42.0 | (1.1,2.8) | 4.91.3 | 92 | 1.0 | 540 | 1.3 |
| 20126+4104 | 20:14:26.03 | +41:13:32.6 | ( 1.8,1.4) | 181 | 332 | 0.9 | 47 | 27 |
| 23033+5951 | 23:05:24.65 | +60:08:09.3 | (4.9, 3.0) | 4.40.9 | 81 | 1.0 | 54 | 3.6 |
| 23033+5951 | 23:05:24.97 | +60:08:14.2 | (2.5, 7.9) | 2.30.6 | 61 | 1.0 | 40 | 2.7 |
| 23033+5951 | 23:05:25.09 | +60:08:16.3 | (1.7,10.0) | 3.40.9 | 81 | 0.4 | 21 | 1.4 |
| 23139+5939 | 23:16:10.45 | +59:55:28.6 | ( 0.0, 0.1) | 2.80.5 | 122 | 0.7 | 110 | 2.7 |
| 23151+5912 | 23:17:20.94 | +59:28:47.6 | (0.8,0.9) | 3.51.2 | 82 | 1.0 | 140 | 2.2 |
| IRAS Name | RA | Dec | separation11Projected separation between 95 GHz CH3OH maser position and nearest 3 mm continuum peak. Uncertainties estimated from signal to noise of the maser and continuum detections. | VLSR | FWHM | |
|---|---|---|---|---|---|---|
| J2000 | J2000 | (104 AU) | (Jy) | ( ) | ( ) | |
| 18517+0437 (a) | 18:54:14.74 | +04:41:42.6 | 2.220.05 | 2.98 | 43.4 | 1.2 |
| 18517+0437 (b) | 18:54:14.46 | +04:41:44.6 | 1.480.05 | 1.60 | 43.9 | 1.4 |
| 20126+4104 (a) | 20:14:26.72 | +41:13:29.8 | 1.400.01 | 2.72 | 4.2 | 1.5 |
| 20126+4104 (b) | 20:14:25.24 | +41:13:34.9 | 1.570.01 | 1.46 | 2.1 | 2.2 |
| 20126+4104 (c) | 20:14:25.16 | +41:13:36.4 | 1.790.01 | 2.92 | 2.4 | 2.0 |
| 20126+4104 (d) | 20:14:25.44 | +41:13:37.3 | 1.390.01 | 6.14 | 2.9 | 1.4 |
| 20126+4104 (e) | 20:14:25.41 | +41:13:37.9 | 1.490.01 | 6.35 | 2.9 | 1.3 |
| 23033+5951 | 23:05:24.59 | +60:08:09.4 | 0.160.04 | 4.55 | 54.3 | 1.4 |
| 23139+5939 (a) | 23:16:10.86 | +59:55:20.7 | 4.070.13 | 0.44 | 44.6 | 1.7 |
| 23139+5939 (b) | 23:16:10.40 | +59:55:28.0 | 0.330.13 | 1.23 | 45.9 | 1.8 |
| 23151+5912 | 23:17:21.90 | +59:28:45.7 | 4.300.22 | 1.87 | 52.8 | 1.4 |
| IRAS Name | Group11Group 1: With 22 GHz H2O and/or 6.7 CH3OH masers and no cm continuum, Group 2: With 22 GHz H2O and/or 6.7 CH3OH masers and cm continuum, Group 3: Without 22 GHz H2O or 6.7 CH3OH masers and with cm continuum | 3 mm Continuum22This study | 3.6 cm Continuum33Sridharan et al. (2002) | H2O Maser33Sridharan et al. (2002) | CH3OH Maser33Sridharan et al. (2002) | CH3OH Maser22This study | OH Maser44Edris et al. (2007) |
|---|---|---|---|---|---|---|---|
| 22 GHz | 6.7 GHz | 95 GHz | 1.7 GHz | ||||
| 183450641 | 1 | N | N | Y | Y | N | Y |
| 184400148 | 1 | N | N | N | Y | N | Y |
| 18517+0437 | 1 | Y | N | Y | Y | Y | N |
| 18566+0408 | 1 | Y | N | Y | Y | N | Y |
| 23151+5912 | 1 | Y | N | Y | N | Y | N |
| 19217+1651 | 2 | Y | Y | Y | Y | N | Y |
| 20126+4104 | 2 | Y | Y | Y | Y | Y | Y |
| 20332+4124 | 2 | N | Y | Y | N | N | N |
| 23033+5951 | 2 | Y | Y | Y | N | Y | N |
| 23139+5939 | 2 | Y | Y | Y | Y | Y | Y |
| 19220+1432 | 3 | N | Y | N | N | N | Y |
| 20205+3948 | 3 | N | Y | N | N | N | N |
| 22134+5834 | 3 | N | Y | N | N | N | N |
| 22570+5912 | 3 | N | Y | N | N | N | N |