Abstract
This paper examines the interplay of opinion exchange dynamics and communication network formation. An opinion formation procedure is introduced which is based on an abstract representation of opinions as –dimensional bit–strings. Individuals interact if the difference in the opinion strings is below a defined similarity threshold . Depending on , different behaviour of the population is observed: low values result in a state of highly fragmented opinions and higher values yield consensus. The first contribution of this research is to identify the values of parameters and , such that the transition between fragmented opinions and homogeneity takes place. Then, we look at this transition from two perspectives: first by studying the group size distribution and second by analysing the communication network that is formed by the interactions that take place during the simulation. The emerging networks are classified by statistical means and we find that non–trivial social structures emerge from simple rules for individual communication. Generating networks allows to compare model outcomes with real–world communication patterns.
Introduction
Many societal processes are ultimately based on the mutual interactions among individuals with diverse opinions, attitudes and lifestyles. The processes of inter–personal communication and opinion exchange play a crucial role in the formation of social structures and networks. Examining the interplay of opinion exchange and communication network formation is the main issue addressed by this study.
Therefore, an opinion formation model inspired by the abstract agent model presented in [6] is introduced. Opinions are represented as a series of bits, which we find an interesting approach to the modelling of attitudes and beliefs, since human thinking can be represented in terms of polarities (yes/no, good/bad, young/old, etc.). And moreover, we are used to measuring information in bits.
Such an abstract bit–string approach has been used in the simulation of consumer–producer behaviour [6] as well as in the context of labour market analysis [5] where bit–strings represent products (or job offers) and needs (worker skills). Here, each bit–string represents an agent opinion and a procedure of agent–agent interaction is specified based on assumptions from social comparison theory [15] and in opinion formation models [7, 12, 3, 26, 27].
This paper is organized in the following way. We start reviewing previous approaches to the modelling of opinion exchange dynamics. After this, we give an explanation of our model. This is followed by a numerical analysis, in which the opinion evolution is considered before looking at the emerging networks of communication activity. A discussion of the results concludes this work.
Related Work
The most important observation from studying computer models of social influence and opinion dynamics is probably that interaction rules by which interacting agents tend to become more alike in their beliefs do not necessarily lead to a population in which all the individuals share the same opinion. To put it in Axelrod’s words ([7], p.223): >>Local convergence can lead to global polarization.<< This dynamic effect which contrasts common intuition has been shown and analysed in a large number of different opinion formation models (e.g., [7, 10, 12, 26, 3, 18]).
All these models are based on two principles: (1.) two individuals are more likely to communicate with one another if they already share a number of opinion features (i.e., their opinions are similar); and (2.) communication further increases this number of shared features (i.e., individuals become even more alike). Approaches differ mainly in their representation of opinion. Some models use continuous representations (e.g., [12, 3]) whereas others assume opinions to be a set of features which can take different (discrete) values [7, 10]. Also populations in which agents may have only two possible choices (yes/no) have been studied frequently (e.g., [26, 16, 29, 30, 19]).
Depending on the control parameters, opinion models give rise to quite a variety of population structures, from a highly fragmented population in which only few individuals share the same opinion, to homogeneity or, in between these two regimes, to a stable state with several differently sized groups. These three behaviour classes111Behaviour classes refer to qualitative different behaviours that potentially result from a simulation model. have been reported in several previous studies on opinion dynamics (e.g., [7, 10, 12, 26, 3, 18, 30]). Moreover, in the transition regime, group sizes were found to follow a power law distribution [10]. For a detailed report with particular focus on such statistical properties of social dynamics processes the reader is referred to [9].
The social network structure which is assumed to underlie the opinion exchange dynamics is another important aspect. In opinion formation studies as well as in other disciplines, often a static network determining which agents may interact with one another is imposed. In social influence models this is referred to as an agent’s neighbourhood. Only recently, the co–evolution of agent states and networks formed by processes (based on the states) receive more attention (see [17] for an inter–disciplinary, recent review). Simultaneously, adaptive network approaches that focus on the interplay of opinion dynamics and network formation have been further developed [18, 30, 25, 4].
In reference [18], a parameter is used to determine whether agents form their opinion based on the opinions of connected agents or if they re–link to an agent having the same opinion. This simple model was found to undergo the same phase transition from diverse to homogeneous opinions as reported above. The effect of giving agents the possibility of cutting links, if they do not achieve agreement with their neighbours, is also studied in [30]. The study presented in [4] starts from a random network determining the possible communication links between the agents. The similarity between two linked agents (which evolves in time since the opinions of interacting agents are updated) is used to assign a frequency of interaction. In this way, dynamic network structures emerge without the need for specifying conditions for cutting social links.
In this paper, we also avoid introducing further assumptions for re–wiring the network. Instead, the network design is based on the communication that effectively takes place among the agents.
Model Definition
The opinion formation model implemented for this study bases on a bit–string representation as used in [6] concerning the simulation of consumer–producer behaviour and in [5] for the analysis of labour market dynamics. In these examples, bit–strings represent products (or, respectively, work offers) and needs (skills). The exchange is based on the matching of these two strings. Here, this concept is used in the modelling of opinion exchange where a series of bits represents an agent opinion, and interaction between agents takes place if their opinion strings are similar. Two agents are willing to interact with one another if the matching of their opinion strings is below (or equal to) a certain similarity threshold denoted by . The interaction process is illustrated in Fig. 1.
In the beginning agents are generated and a random bit–string is assigned to them. In the interaction process, two agents, say according to Fig. 1, meet at random. But they are only willing to communicate about an issue (one element of the bit–string), if the number of unequal bits (i.e., the hamming distance ) is below or equal to a similarity threshold . If the hamming distance between the two agents is below the threshold (), they exchange ideas about an issue. As a result of that the agent chosen first ( in the example) adopts the opinion of the concerning that issue by flipping the respective bit.222Since the probability of an agent to be the first one is equal for all individuals during the iteration process, all the agents have an equal chance to imitate or to be imitated. The same assumption about who imitates who is made by Axelrod in [7]. In this way the principles of similarity and imitation which form the basis of most opinion models (e.g., [7, 10, 12, 26, 3, 18]) are integrated.
The model is implemented so that during a single time step all the agents have the chance to interact with one another. Therefore one time step of the model corresponds to interactions of pairs of randomly chosen agents . We exclude self–interaction (), but we do not force all agents to be chosen exactly one time (with the result that some may be chosen twice and other ones are not chosen at all in that iteration).
In order to understand better the opinion exchange dynamics among the agents, we keep track of the interactions that take place in the course of the simulation. We introduce an interaction matrix which stores all the interaction activity. is of size and the element saves the number of times and interacted in some way. Therefore, each time two chosen agents are sufficiently similar (), we increase and by one. Note that and are also increased if agents already share the same opinion. The matrix corresponds to a weighted graph, in which edges represent the communication lines between different agents. Additional information about who imitates who, and which agents are imitated is stored separately.
To summarize. Starting from an initial random population, at each time step pairs of agents (, ) are chosen, and if the distance is below the threshold (), the agent switches one of the bits that have been unequal. In other words, if individuals are close enough they have the opportunity to become even closer. Otherwise, they just do not communicate at all. As they split apart groups are formed. In the next section, we discuss the characteristics of the groups that emerge from this process.
Behaviour Classification
In order to obtain a classification of the general dynamic behaviour of the model, a series of systematic tests has been performed. For this purpose, we looked at different numbers of dimensions used in the opinion representation and respectively different threshold values . Note that considering the ratio of the two parameters might also be of interest, since it accounts for the relative similarity required for two agents to interact. It would also be favourable as the number of model parameters would be reduced.
However, in order to be clear about the interdependence of the two parameters, we first tested all the configurations and respectively , and looked at the number of groups of individuals that share exactly the same opinion (denoted by ). A group in this sense can be formalized as
| (1) |
where is the reference opinion string shared by all the members of the group . A particular group comprises all the agents , whose opinions equals , (that is the hamming distance ). Consequently, is defined as the number of groups with at least one member. With groups defined in this way, the maximum number of possible groups is
| (2) |
As opinions are represented as a series of bits, there are possible opinion strings. But in the case that the number of agents is below that number (), then the maximum number of groups with at least one member is equal to (i.e., ).
The model behaviour can be classified by using as an indicator for different kinds of behaviour. The case where is near the theoretical maximum ( or respectively as described above) represents the cases in which the public opinion remains highly fragmented, since there are many groups with only few members (or even just a single one). The other extreme is represented by in which case all the agents belong to a single giant group, that is: the society of agents reaches global consensus.
In Fig. 2 this classification of the model behaviour with respect to and is shown using a parameter grid formed by and . agents have been used for the experiments and five simulation runs have been performed for each parameter configuration.333On the whole, runs with agents have been performed. The two additional grids represent the iteration number required to reach the stable state (middle) and the variance of (r.h.s) observed over the five realizations. Note that the stable state, in which no further opinion exchange is possible, is always reached, though the number of iterations required to reach it differs tremendously.
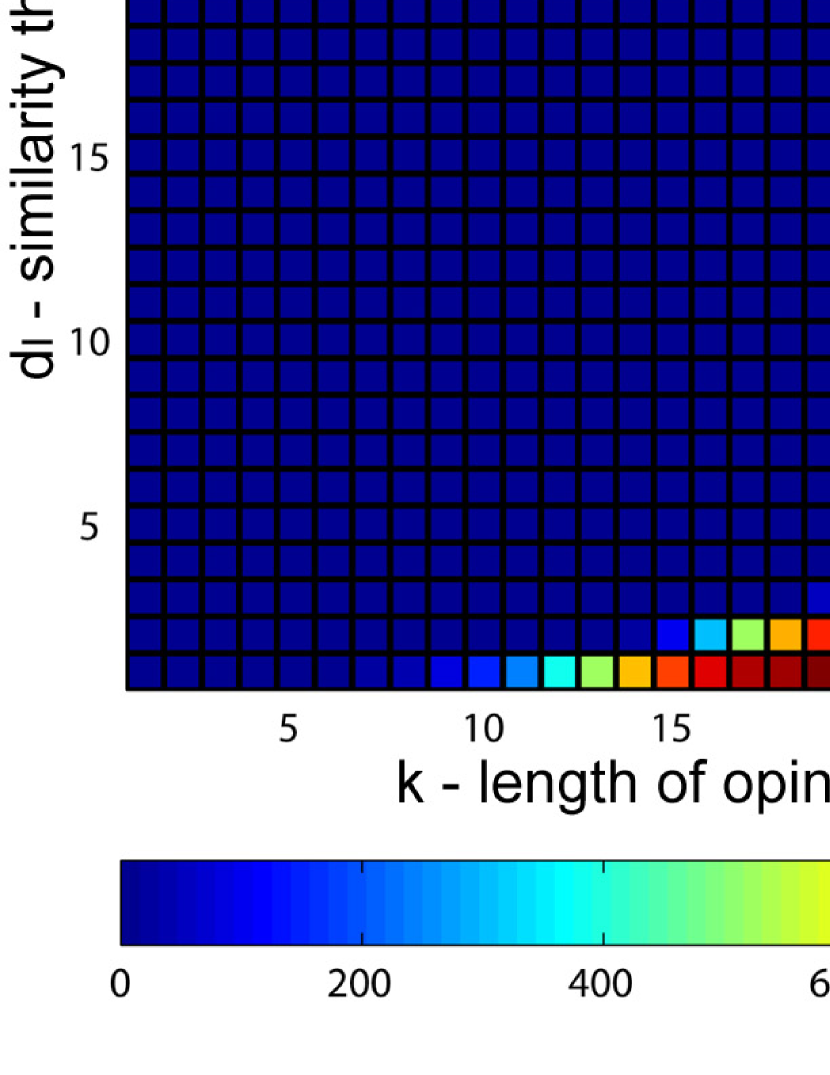
Fig. 2 makes clear that a transition takes place from a population in which all opinions are the same (blue region with ) to a population in which basically all the agents have different opinions (dark red with ). The third and in fact most interesting behaviour is observed in the area of transition in between these two extremes. It will be considered using a specific parameter constellation in the following section.
Group Size Distribution
In order to get a better idea of the model behaviour in transition, we concentrate on the example and in the following two sections. The influence of the population size is studied after that. From the images in Fig. 2 we assume that the critical behaviour can be observed for , where an average number of groups was found with a very high variance. In a second series of systematic experiments, now using 100 simulation runs, we subsequently increase the threshold from and look at the distribution of group sizes in stable state. The results are presented in Fig. 3.
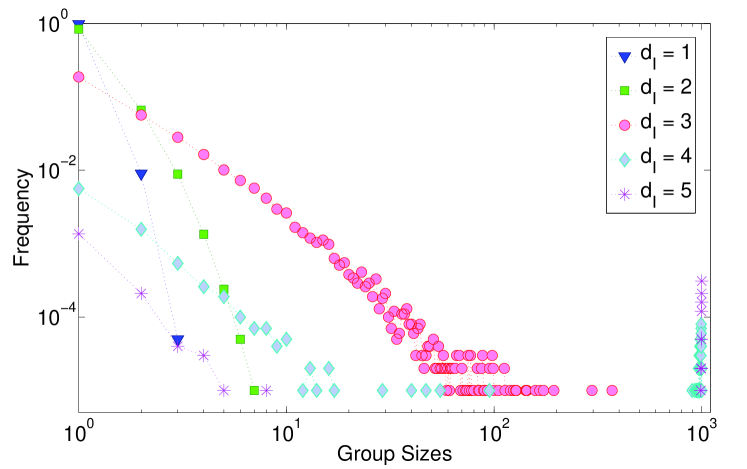
It becomes clear that, for and , is indeed at the border between the two qualitatively different behaviours: homogeneity and fragmentation. It therefore displays the model behaviour in the phase transition. Moreover, Fig. 3 shows that groups scale according to a power law for , which was also reported in the phase transition of the Axelrod model in [10].
For only very small groups are present, whereas for the likeliness of small groups to form subsequently decreases and agents are very likely to meet in a single giant group (global consensus). Note, however, that for several intermediate group sizes are also observed that show a power law scaling for group sizes up to 20 members.
Communication Networks
The analysis of the groups that consist of individuals sharing the same opinion is an interesting issue, looking at the communication activities that led to this state, on the other hand, can reveal important additional information of how a certain state is reached. From the network point of view, we can consider that agents are the nodes of a communication network and that edges represent communication lines. In order to keep track of the communication activity within such a network, we introduced the interaction matrix which stores all the interactions that take place in the course of the simulation. We also compute the adjacency matrix , the elements of which are if and if . Matrix accounts for communication lines between the agents, but not for the intensity (i.e., the frequency) of communication between them.
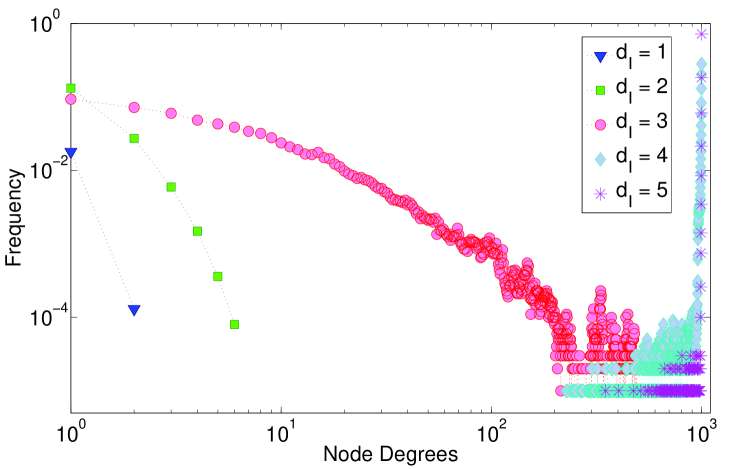
In Fig. 4 the degree distribution of the communication network computed on the basis of is visualised. Degree distributions are used frequently in the classification of complex networks (e.g., [2, 8, 17, 13]). The data displayed in Fig. 4 represents the same 100 realisations performed for the group size analysis shown in Fig. 3.
The distribution shows that for the frequency with which node degrees of one or two (represented by the blue triangles) have been observed is around , which makes clear that the great majority of the nodes has a zero degree, i.e., they are isolated nodes. For , still, the majority of nodes is isolated, but there are agents connected to up to six others. All in all, for low values of the differences between the agents maintain, because initially, the distance between most agents is larger than . Therefore, interaction becomes unlikely and the communication network is very weakly connected.
The degree distributions for and are quite different from the prior examples. They display the characteristics of a highly connected (quasi–complete) network. In the course of 100 simulations no node with a degree below 200 was found which means that the weakest connected agent is still connected to more than 200 other agents. Moreover, the larger is chosen, the more close the final network is to the complete graph.444For the percentage of node degrees smaller than 900 was 0.08%. This is because potentially all the agents are allowed to interact with all the others (complete graph), and with an increased threshold value more of these interactions really take place since the condition is more likely to be satisfied.
An interesting property is observed when comparing the degree distribution for to the group size distribution in Fig. 3 as it results using the same values . As shown in Fig. 3, small minority groups of agents may form in these cases, although these agents interacted with at least 200 others (as we know from Fig. 4), i.e., they are not isolated at all. We conclude that intensive communication behaviour does not automatically make agents adopt the opinion of the largest group, agents (or small groups of agents with up to ten members) may have an individual >>outsider<< opinion even though the communication activity involved many agents from different groups.
From the network point of view the phase transition from highly fragmented opinions to global consensus as reported above now becomes the transition from a weakly connected network (i.e., reduced communication activity for ) to a complete network (in which all the agents communicate with all the others for ). The degree scaling behaviour in between these two regimes () represents the model behaviour in the phase transition.
The distribution of the degrees for as shown in Fig. 4 displays the characteristics of a non–trivial network structure (compare also the network shown in Fig. 8). The distribution is significantly different from distributions found in random networks. Fig. 4 indicates that the scaling of the degrees is according to a power law, at least for the upper tail with degrees below 100. This means that the network is scale–free. For connectivities around 100 slight deviations are visible and for degrees in the region from 300 to 500 we cannot any longer assume a power law behaviour.
Further analysis using a larger number of experiments555In the physics literature (e.g., [10, 18]) often realizations are used. might reveal the reasons for these irregularities, and they will also make us more confident about the power law distribution indicated by Fig. 4. Another equally important issue to provide us with a more complete picture of the model behaviour is the influence of the populations size.
Influence of the Population Size
In order to be able to compare the model outcomes for realizations using different numbers of agents (), it is convenient to use the relative number of groups after stabilization given by . In the case of opinion fragmentation since . In the case a global consensus is reached we have and therefore . For the intermediate states the relative number of groups stays between zero and one ().
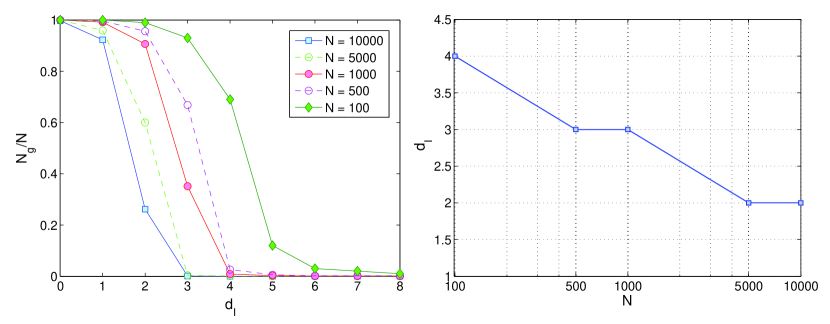
In the l.h.s. of Fig. 5, the relative number of groups in stable state is shown for and as a function of the threshold . In all simulations an opinion string of length is used. Each data point in Fig. 5 represents the average of determined over 10 repeated simulation runs. Let’s call the threshold values at which the transition from fragmentation to consensus takes place. With each increase of the population size from to the values at which transition behaviour is observed () decreases.
The r.h.s of Fig. 5 makes this clear. It shows the >>critical<< values as a function of the population size. For a certain , has been chosen to correspond to those 10 repeated simulation runs in which the variance in the values of is maximal, as a high variance is a suitable indicator for transition behaviour (compare also Fig. 2). The r.h.s of Fig. 5 shows the decrease of the with the population size . Note the logarithmic scale used for the number of agents on the horizontal axis. As the grows 10 times larger, the critical threshold decreases by one.
In Fig. 5 the influence of on the model behaviour is evaluated on the basis of the average value and the variance of a series of relative numbers of groups, . A further interesting aspect is the influence of the population size on the group sizes in stable state and the interaction network formed as the result of the opinion exchange process. For and (both displaying the characteristics of transition behaviour) the group size and the degree distributions are presented and compared in Fig. 6.
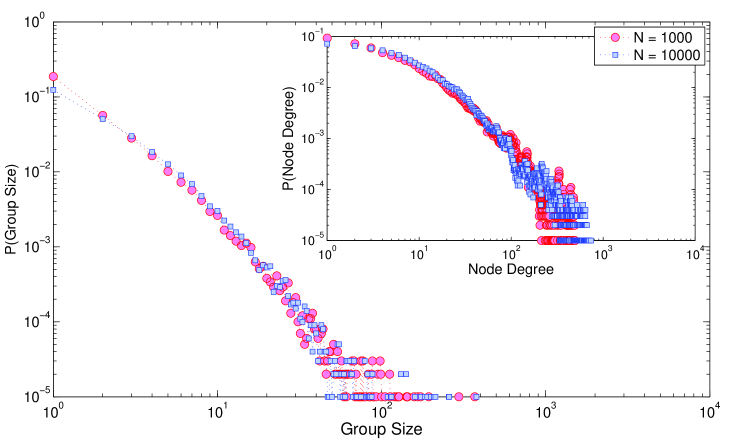
We observe in Fig. 6 that there is no remarkable difference between the groups formed in a population of 10000 agents compared to the example of 1000 agents considered previously. The degree distribution shown in the inset of Fig. 6 displays the same scaling behaviour for both cases as well. This indicates that in the phase transition the observed interaction patterns as well as the statistical properties of the grouping behaviour after stabilisation is invariant to changes of the population size. Moreover, observing the same power law scaling of the degrees for and confirms that the opinion exchange process as presented in this paper yields scale–free communication networks.
The observed power law scaling can be an interesting issue for the validity of the model, since such a behaviour is shown to be a property of many real–world networks (compare [2, 8, 11, 23, 22, 20]). The invariance of the communication patterns to the population size (as indicated by Fig. 6) is another important issue for the comparison with real–world network data, since empirical network studies often consider a large number of participants (up to several millions).
Networks as a Link to Reality
Recently, a critical account by Sobkowicz ([28]) revealed that among the vast literature on opinion formation models, there are very few attempts to link the simulation results to real–world data. The main reason for this is that high–quality data of opinion spread in real societies is not available. However, recent analyses of real–world communication networks ([23, 22, 20]) have led to a better understanding of human communication activity. The network view on opinion exchange processes introduced in this paper, enables that simulation outcomes be compared to this new insights. This may be of great value in the refinement and calibration of opinion models.
One example of networks that can be adequate in the comparison are phone call networks (e.g., [1, 23, 22]). As in our model, these networks are constructed by one–to–one communication. In [23] and [22], Onnela et al. extensively analyse the structure of a mobile phone network constructed by observing the communication activity of several million users during 18 weeks. They explain that the data serves as >>a proxy for the underlying social network<< ([23], p. 3) and therefore of human communication patterns. For any opinion model to be of explanatory value (as an explanatory candidate in the words of Epstein [14]), it is necessary that realistic network structures (macro–behaviour) are formed by the interaction process implemented in the model, so that simulated communication patterns compare to the real–world exchange processes.
In a qualitative sense, the degree distributions of the interaction networks in the phase transition shown throughout this paper (Fig. 4 and 6) relate to observations made on real–world communication networks. A scaling according to a power law as shown for call graphs by Onnela et al. in [23, 22] (compare Fig. 1A in [22]) as well as by Aiello et al. in [1] (Fig. 1 and 2), is observed in the present model of opinion exchange. Another confirming observation is the percentage of nodes in the largest connected component. In the mobile network study ([23, 22]) it consists of 84% of the nodes and in our networks this percentage is found to be in between 75 and 85%. The qualitative similarity may be a useful starting point for future calibration of the opinion model.
One has to take into account in such a comparison that the real–world examples consist of several millions of nodes (e.g., 3.9 million in [23, 22]) and that the largest network created in the course of this study has (only) 10000 participants. However, as the previous section revealed, the degree scaling did not change with an increasing population size.
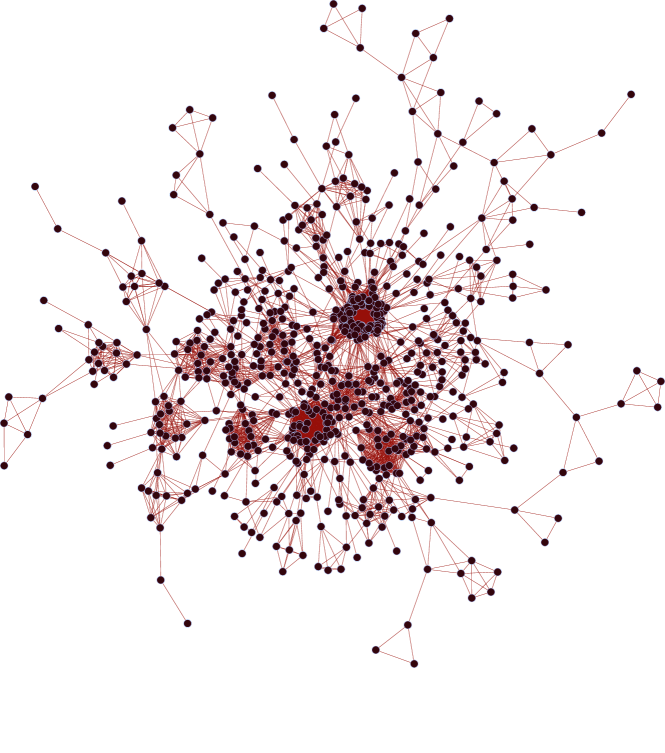
The emergence of very complex, non–trivial social structures from simple opinion exchange processes becomes also visible in the example network presented at the very end of this paper (in Fig 8). Agents do not have any knowledge of the global properties of the network nor is there any routine by which they urge to improve their position in the network. Nevertheless, we observe the formation of various clusters that among themselves are strongly connected, and also the emergence of individuals that connect between different clusters becomes visible. Having a high centrality, but only a small number of social contacts to sustain, such nodes are considered to have a high importance in the social network (compare [17] and references therein).
While the generation of networks provides us with the possibility of linking the simulation model and reality at the level of global structure, the use of bit–strings in the opinion representation allows for a connection of agent opinions and real survey data. For instance, questions like >>are you currently satisfied with the work of politician X?<< or >>which of the following issues you think should be regulated/not regulated by the government?<< can be used to set up an agent population with opinions distributed according to the results of a questionnaire. Repeated surveys might even allow for comparison of real data to the simulated opinion exchange dynamics.
Future Developments
Besides being scale–free, real–world networks are typically characterized by some other statistical properties. Many posses a relatively small average diameter (small–world property) and a high clustering. So far our analysis did not consider these properties in the analysis of the emerging network of opinion exchange activity. Classifying the networks using additional statistical network measures, such as betweenness centrality, diameter and clustering measures like the continuous clustering coefficient introduced in [24], is one essential issue to be addressed in the future.
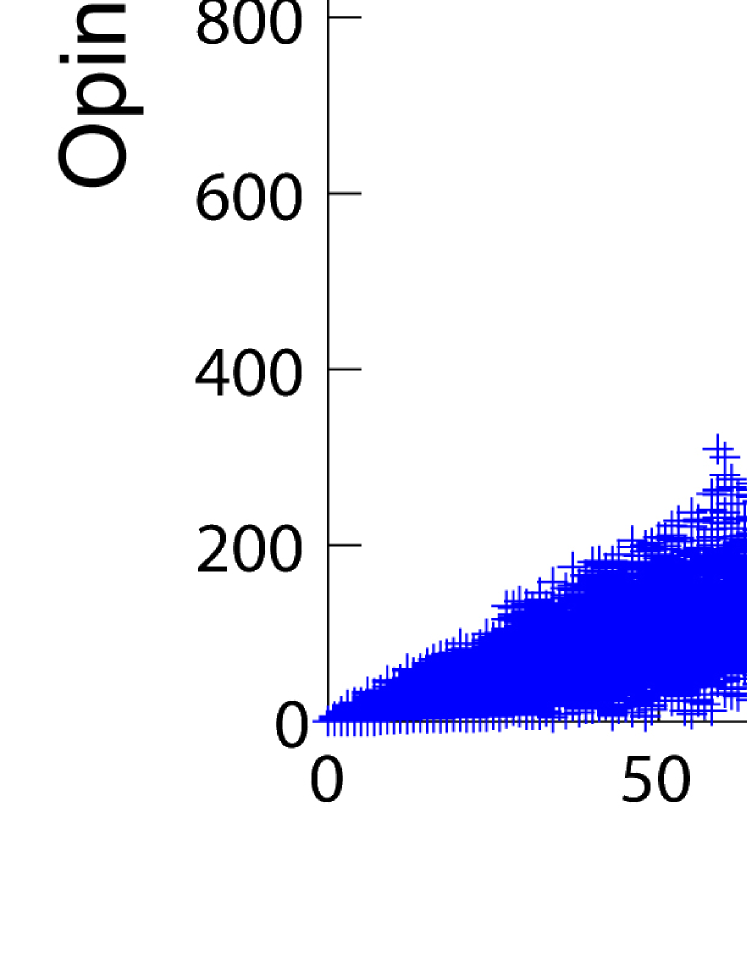
Looking at opinion dynamics from the perspective of networks allows for a series of additional analyses, one of which is shown in Fig. 7. The data stored during the 100 simulation runs for and is used in this analysis. In Fig. 7, the number of opinion changes is plot with respect to the degree of the nodes. Surprisingly, we observe strong irregularities in the exchange behaviour. For node degrees around 100 and around 320 significantly more opinion exchange is observed than for neighbouring degrees. This might be an indication that critical connectivity level exists, and that the nodes once they reached this connectivity enter a larger community of agents which gives them a whole group of new communication partners. Such a reasoning may also explain the scaling of the degree distribution for degrees larger than 100. Future research has to clarify these effects.
Due to the high flexibility of the bit–string description adopted in this work, a series of model refinements can be implemented without much effort. For instance, splitting the string into two and using one sub–string for (say) the private live and the other for the professional relations will allow to generate two different networks and to study the interrelation between the two. Considering parts of the string as fixed, accounting for fixed attributes like gender, can also be a reasonable extension to the model. And along this line, a recent study showed that cross–gender communication is more frequent and more intensive than communication among the same gender [20], which reveals that besides similarity also differences attract in some cases. An adaptation of the interaction rule such that for a part of the bit–string difference is more appealing than similarity is another candidate for future refinement of the model.
Another future development will concern the validation of the opinion dynamics model. Initial assumptions of the model can be grounded on previous research and on literature, and they can also be validated through some empirical studies. In this case, the assumptions of similarity and imitation follow Axelrod’s well–known and discussed dissemination of culture model. The model outcomes which are the communication network and the group sizes will be the subject of future research, aiming to compare them to some real–world networks and group configurations as outlined in the previous section.
Conclusions
Like other authors in the opinion formation field, we explore the mechanisms through which similarity leads to interaction and interaction leads to still more similarity. Network properties seem a natural way to describe the structural patterns that come out from those multi–agent interactions. In this context, the main purpose of this paper is to discuss the potential of networks to emerge endogenously from local interactions without explicitly specifying rules for network linking. This facilitates comparisons of model results to real–world social networks.
We show that complex network structures emerge from a simple process of communication between individuals that have no information on the global properties of the network. This indicates that a crucial role in the formation of social structures and associations is played by the mutual interactions among individuals with diverse opinions, attitudes and lifestyles.
In the context of opinion dynamics, considering which networks result from simulations with different model parameters made visible that the phase transition from highly fragmented public opinion to homogeneity in models of social influence is due to the communication activity that is allowed by a certain parameter constellation. A few critical values play the fundamental role.
We have followed a biological inspiration, where opinion change compares to a mutation mechanism that allow for the adoption of a new position with respect to a certain issue in the agents mind. Such an abstract bit–string approach has been used in the context of labour market analysis [5] where bit–strings represent job offers and worker skills. It was also applied to model innovation in a market–oriented context where producers and consumers try to improve their matching in what concerns products and needs [6]. We envision that the application of the notion of opinion exchange presented in this paper could bring relevant improvement to the way the underlying population structures were represented in those earlier approaches.
Acknowledgements
The authors kindly acknowledge the helpful comments of two anonymous reviewers, making us aware of the importance to study different population sizes. This project was supported by FCT Portugal, Project PDCT/EGE/60193/2004.
References
- [1] Aiello, W., Chung, F. R. K., and Lu, L., A random graph model for massive graphs, in STOC (2000), pp. 171–180.
- [2] Albert, R. and Barabasi, A.-L., Statistical mechanics of complex networks, Reviews of Modern Physics 74 (2002) 47–97.
- [3] Amblard, F. and Deffuant, G., The role of network topology on extremism propagation with the relative agreement opinion dynamics, Physica A: Statistical Mechanics and its Applications 343 (2004) 725–738.
- [4] Amblard, F. and Jager, W., Network shapes resulting from different processes of interaction, in proceedings of The 5th Conference of the European Social Simulation Association, Italy (2008).
- [5] Araújo, T. and Weisbuch, G., The labour market on the hypercube, Physica A, Statistical Mechanics and its Applications 387 (2008) 1301–1310.
- [6] Araújo, T. and Mendes, V. R., Innovation and self-organization in a multiagent model, Advances in Complex Systems 12 (2009) 233–253.
- [7] Axelrod, R., The dissemination of culture: A model with local convergence and global polarization, The Journal of Conflict Resolution 41 (1997) 203–226.
- [8] Barrat, A., Barthélemy, M., Pastor-Satorras, R., and Vespignani, A., The architecture of complex weighted networks, Proceedings of the National Academy of Sciences of the United States of America 101 (2004) 3747–3752.
- [9] Castellano, C., Fortunato, S., and Loreto, V., Statistical physics of social dynamics, Reviews of Modern Physics 81 (2009) 591–646.
- [10] Castellano, C., Marsili, M., and Vespignani, A., Nonequilibrium phase transition in a model for social influence, Physical Review Letters 85 (2000) 3536–3539.
- [11] Chung, F. and Lu, L., Complex Graphs and Networks (American Mathematical Society, 2006).
- [12] Deffuant, G., Neau, D., Amblard, F., and Weisbuch, G., Mixing beliefs among interacting agents, Advances in Complex Systems 3 (2001) 87–98.
- [13] desJardins, M., E. Gaston, M., and Radev, D., Introduction to the special issue on ai and networks, AI Magazine 29 (2008) 11–15.
- [14] Epstein, J. M., Remarks on the Foundations of Agent-Based Generative Social Science, chapter 34 (Elsevier B. V., 2006).
- [15] Festinger, L., A theory of social comparison processes, Human Relations 7 (1954) 117–140.
- [16] Galam, S., The dynamics of minority opinions in democratic debate, Physica A: Statistical and Theoretical Physics 336 (2004) 56–62.
- [17] Gross, T. and Blasius, B., Adaptive coevolutionary networks: a review, Journal of The Royal Society Interface 5 (2008) 259–271.
- [18] Holme, P. and Newman, M., Nonequilibrium phase transition in the coevolution of networks and opinions, Physical Review E 74 (2006) 1–5.
- [19] Jiang, L.-l., Hua, D.-y., and Chen, T., Nonequilibrium phase transitions in a model with social influence of inflexible units, Journal of Physics A: Mathematical and Theoretical 40 (2007) 11271–11276.
- [20] Leskovec, J. and Horvitz, E., Planetary-scale views on a large instant-messaging network, in WWW ’08: Proceeding of the 17th international conference on World Wide Web (ACM, New York, NY, USA, 2008), ISBN 978-1-60558-085-2, pp. 915–924, doi:http://doi.acm.org/10.1145/1367497.1367620.
- [21] NWB-Team, Network workbench tool (2006), http://nwb.slis.indiana.edu, indiana University, Northeastern University, and University of Michigan.
- [22] Onnela, J. P., Saramaki, J., Hyvonen, J., Szabo, G., Lazer, D., Kaski, K., Kertesz, J., and Barabasi, A. L., Structure and tie strengths in mobile communication networks, Proceedings of the National Academy of Sciences 104 (2007) 7332–7336.
- [23] Onnela, J.-P., Saramäki, J., Hyvönen, J., Szabó, G., De Menezes, M. A., Kaski, K., Barabási, A.-L., and Kertész, J., Analysis of a large-scale weighted network of one-to-one human communication, New Journal of Physics 9 (2007) 1–27.
- [24] R. Vilela Mendes, T. A. and a, F. L., Reconstructing an economic space from a market metric, Physica A 323 (2003) 635–50.
- [25] Rosvall, M. and Sneppen, K., Dynamics of opinions and social structures, http://arxiv.org/abs/0708.0368 (2007).
- [26] Schweitzer, F., Meinungsbildung, kommunikation und kooperation aus physikalischer perspektive, Physik Journal 2 (2003) 57–62.
- [27] Schweitzer, F. and Behera, L., Nonlinear voter models: The transition from invasion to coexistence, The European Physical Journal B - Condensed Matter and Complex Systems 67 (2008) 301–318.
- [28] Sobkowicz, P., Modelling opinion formation with physics tools: Call for closer link with reality, Journal of Artificial Societies and Social Simulation 12 (2009) 1.
- [29] Sznajd-Weron, K., Dynamical model of ising spins, Phys. Rev. E 70 (2004) 037104.
- [30] Zanette, D. and Gil, S., Opinion spreading and agent segregation on evolving networks, Physica D: Nonlinear Phenomena 224 (2006) 156–165.