Phonon surface mapping of graphite: disentangling quasi–degenerate phonon dispersions
Abstract
The two-dimensional mapping of the phonon dispersions around the point of graphite by inelastic x-ray scattering is provided. The present work resolves the longstanding issue related to the correct assignment of transverse and longitudinal phonon branches at . We observe an almost degeneracy of the three TO, LA and LO derived phonon branches and a strong phonon trigonal warping. Correlation effects renormalize the Kohn anomaly of the TO mode, which exhibits a trigonal warping effect opposite to that of the electronic band structure. We determined the electron–phonon coupling constant to be 166 in excellent agreement to calculations. These results are fundamental for understanding angle-resolved photoemission, double–resonance Raman and transport measurements of graphene based systems.
The lattice dynamics of most “standard” materials are well known nowadays and can be routinely described by ab-initio methods based on density–functional perturbation theory DFPT . The phonon dispersion relations of graphite and graphene have already been determined by inelastic neutron scattering D105 , inelastic x-ray scattering (IXS) maultzsch04 ; mohr07-ixs , double–resonance Raman scattering c887 ; q953 and electron energy loss spectroscopy aizawa90 . After the first ab-initio calculations kresse95 ; pavone96 had been corroborated by IXS maultzsch04 ; mohr07-ixs ; bosak07-graphit , the story for graphite seemed closed ludger04-phonon . However, the phonon dispersions of graphite and graphene - a single layer of graphite - have continued to present surprises in recent years: (i) two Kohn anomalies kohn62-anomaly at the Brillouin zone (BZ) center () and corner () were predicted theoretically ando06-tophonon ; piscanec04-kohn and (ii) for charged graphene/graphite, the (electronic) non-adiabatic effects at were predicted theoretically lazerri06-kohn and confirmed experimentally by Raman scattering mauri07-bo ; kim07-elphon . Very similar observations have been made for carbon nanotubes mauri07-kohncarbon ; das07-transport ; farhat07-kohn ; avouris07-kohn ; sasaki08-kohn . The precise understanding of the Kohn anomaly is highly significant for electron–phonon coupling (EPC) and thus of prime importance for the quantitative description of superconductivity in graphite intercalation compounds hannay65-gicsuperconductivity ; mauri-cac6 , electronic transport in the high bias regime, and for the (double) resonant Raman scattering thomsen00d ; c887 . The latter is now commonly used to distinguish single-layer graphene from double- and multi-layer graphene ferrari07-graphene ; Graf07 .
Qualitatively, the Kohn anomaly of the transversal optical (TO) branch at the point is well described by density functional theory (DFT) piscanec04-kohn . However, its magnitude is severely underestimated by DFT basko08-elph ; lazzeri08 . Electron-electron correlation leads to an enhancement of the EPC at . This can be quantitatively calculated lazzeri08 with the –approximation which also gives very good results for the electronic band-structure of graphite (see, e.g., Ref. alex06-correlation ). Although the EPC at can be derived from the IXS and Raman linewidth measurements lazzeri06-linewidth the experimental determination of the EPC close to the point lazzeri08 is still missing. The experiments needed to unravel the details of the phonon dispersions are extremely challenging because three phonon branches are overlapping in a small energy window and the phonon energies have a the strong dependence on doping. Thus, in order to overcome this problem there is an urgent need to map the full two–dimensional phonon dispersion relations around point in a similar manner as done routinely for electron energy dispersions by angle–resolved photoemission spectroscopy (ARPES).
In this Letter we present a mapping of the detailed two–dimensional phonon dispersion relation around the point of graphite single crystals measured by IXS. The phonon dispersion perpendicular to the graphene layers in graphite is practically zero for the phonon modes around marzari05 ; ludger04-phonon and thus we can use graphite to test the phonons of graphene. We prove that at , the two branches with LA and LO character and the branch with TO character are almost triply degenerate due to the Kohn anomaly which brings down the TO branch in energy. The phonon mode assignment is carried out by explicit comparison of the measured and calculated IXS intensities in the two–dimensional map and used to disentangle overlapping phonon modes. Using the present unambigous assignment of the phonon branches and previously measured electron dispersions around we determine the value of the EPC entirely from experiments and find quantitative agreement to calculations.
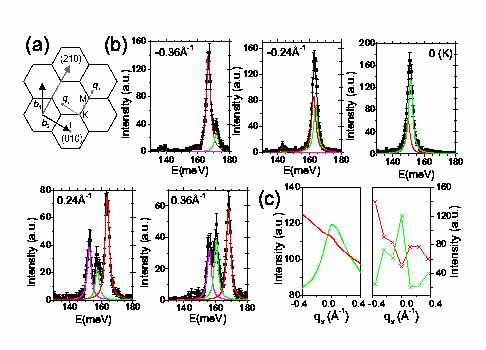
The experiments were performed on beamline ID28 at the ESRF, utilizing the silicon (999) setup which yields monochromatized synchrotron light of 17794 eV, providing a total energy resolution of 3.3 meV krisch03-id28 . The beam size at the sample position was 60 30 . As the spectrometer is equipped with nine analyzers, nine IXS spectra were recorded simultaneously, thus allowing an efficient coverage of the relevant portion of the phonon dispersion branches. Single crystalline graphite samples with about 1 cm diameter and 100 thickness were mounted on a goniometer. In Fig. 1(a) the scattering geometry and the coordinate system used throughout this work is shown. We collected IXS spectra along the line starting from the (010) reciprocal lattice point in the (210) direction. We have purposely chosen this line since calculations of the IXS intensities reveal the highest intensity for the TO mode in the (010) BZ.
The phonon frequencies are the eigenvalues of , where is the dynamical matrix at the wavevector q and is the carbon mass. The DFT dynamical matrix is computed using linear response DFPT , with the exchange-correlation of Ref. PBE and other computational details as in Ref. piscanec04-kohn . The Kohn anomaly of the TO branch near is entirely determined piscanec04-kohn ; lazzeri08 by the contribution (to ) of the phonon self-energy between bands (defined in Eq.1 of Ref. lazzeri08 ). In particular, the TO branch corresponds to the eigenvector of with the eigenvalue that is largest in modulo. is proportional to the square of the EPC between the bands near the Fermi level. In Ref. lazzeri08 it was shown that DFT underestimates and that from the more accurate calculations is larger by a factor . Here, following Ref. lazzeri08 , we compute the dynamical matrices as
where is a constant independent of q. determines the slope of the TO branch near . shifts rigidly the TO branch with respect to the other branches. cannot be computed easily (see footnote 24 of Ref. lazzeri08 ) and is fitted to reproduce the present measurements. Furthermore DFT slightly overestimates (in a systematic manner) the phonon frequencies of the branches not affected by the Kohn anomaly, thus all the frequencies are scaled by -1.3 % to simplify the comparison with measurements.
Selected raw IXS spectra along the direction are shown in Fig. 1(b). These spectra contain the contributions of three phonon modes. A lineshape analysis using Lorentzians yields the position and intensity of each mode which are assigned to the LA, LO and TO branches. Note that this characterization of phonon eigenvectors is only strictly valid for very small away from and we identify the phonon branches in the whole BZ according to their characterization close to marzari07 . From symmetry considerations LO and LA modes are degenerate at the point. Our results clearly show that LO/LA and TO are almost degenerate at and close to the point. This is in striking contrast to previously determined phonon dispersionsmaultzsch04 ; mohr07-ixs and can not be explained by the standard DFT phonon calculations maultzsch04 . Our mode assignment is based on a comparison of the measured and calculated IXS intensities as shown in Fig. 1(c) and further supported by a comparison to the calculated phonon frequencies as shown later. It is clear that the calculated and experimental IXS intensities of LO and TO show the same pattern and thus we can safely assign the TO mode as the one with higher intensity along the considered path in the (010) BZ.
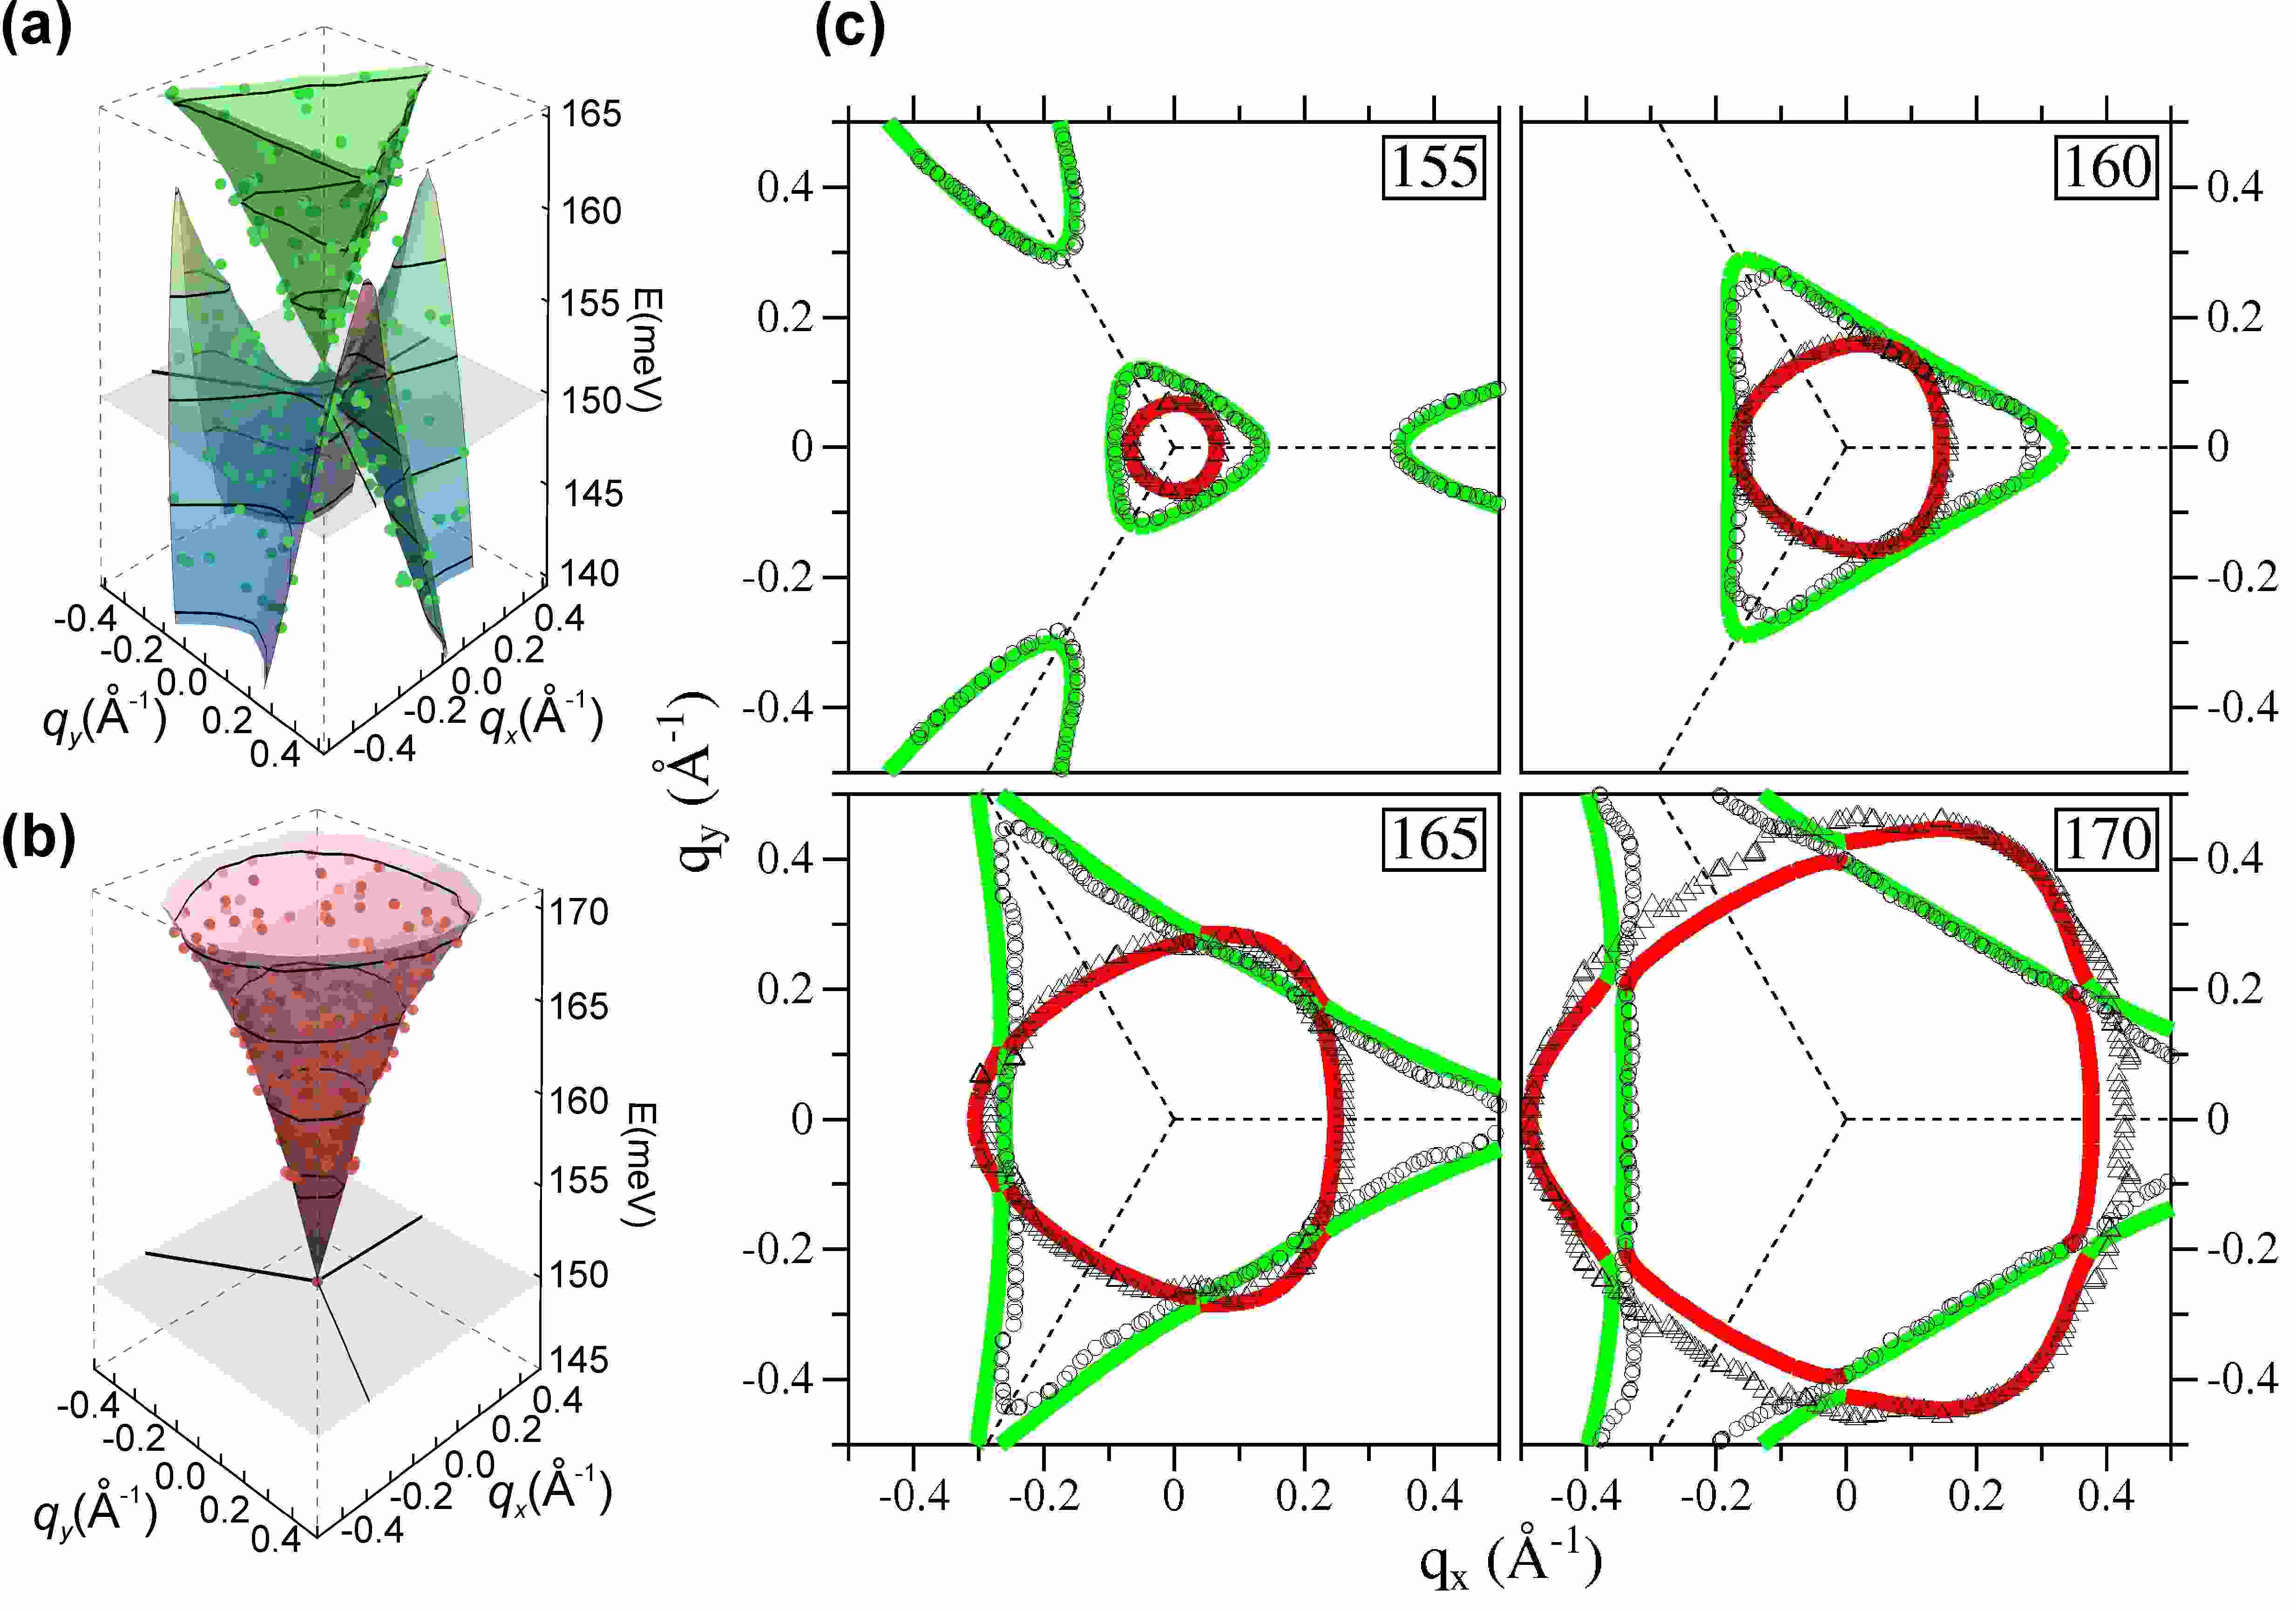
From the maxima of the Lorentzians a set of 100 data points is obtained in the plane in a region of 0.6 around the point, which is further extended by the application of symmetry operations. In Fig. 2(a,b) the raw experimental data points around the point are shown. From these data points the three–dimensional surfaces of the phonon dispersion relations are interpolated using spline functions. The interpolated phonon maps are used for further data analysis. The phonon trigonal warping effect for the LA,LO and TO modes around the point is illustrated from the phonon equi–energy contours shown in Fig. 2(c) along with the calculations. Notably, the experiments and calculations are in excellent agreement to each other which further supports the mode assignment performed above. Interestingly, the phonon trigonal warping effect of the TO mode is opposite to the electronic trigonal warping effect, i.e. the slope of the TO phonon branch is higher in direction, whereas the electronic bands have a higher slope in direction alex06-correlation . For the LA and LO modes, the phonon trigonal warping has the same angular dependence as for the electronic bands. The fact that the equi–energy contour of the TO mode is almost circular, is also in agreement with the angular dependence of the kink due to EPC in the quasiparticle dispersion measured by ARPES, where no change of the kink position, i.e. the energy of the coupling phonon alex08-kc8 was observed. Furthermore, the observed contour for the TO mode can explain why the Raman linewidth of the G’ peak depends weakly on the exciting laser energy. The trigonal warping of electrons and the TO phonons is opposite, canceling the effects of enlarging/shrinking of the Raman linewidths. Furthermore it is clear that the LO and TO branches cross along the high-symmetry direction but undergo anti-crossing along all the other directions.
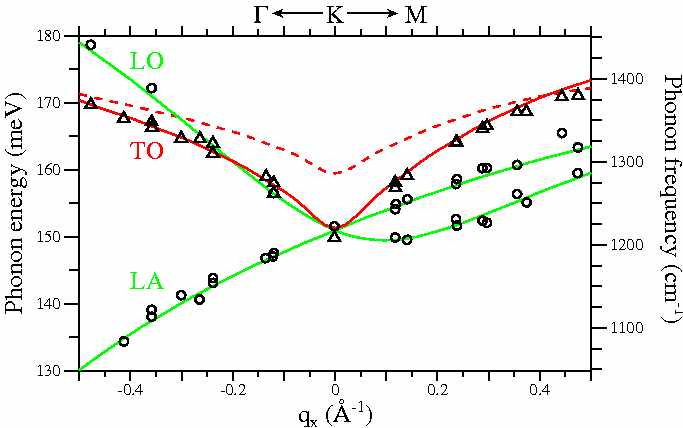
In a final Fig. 3 we show the phonon dispersions along the high–symmetry lines and compare it to previous DFT calculations and our results. It can be observed that (1) the three branches are almost touching each other at (2) the LO and TO branches cross each other in direction and (3) the proper inclusion of the electron-electron correlation (through the approach) in the calculation of the EPC is crucial to obtain a good agreement with the experiment. Indeed calculations are in almost perfect agreement with measurements while DFT calculations severely underestimate the phonon slope of the TO branch and thus the EPC at and overestimate the phonon energy. For precise description of the experimental phonon dispersion relation, we provide simple fit formulas for phonon dispersions of the TO and LO branches. The TO phonon dispersion is given by
| (1) |
and the LO phonon dispersion is best fit by
| (2) |
Here and denote the phonon energies in meV of TO and LO branch, respectively, is the phonon wavevector measured in units from point [see Fig. 1(a)] and the angle away from the direction. From these fits we obtain the slope of the TO branch at , meV, from which we can derive an experimental value for the square of the EPC constant between bands at , piscanec04-kohn . Indeed, (see Eq. (10) of piscanec04-kohn ),
| (3) |
where is defined in lazzeri08 , and all the parameters on the right hand side were experimentally determined in this work or previously by ARPES alex06-correlation . In particular, meV is the the TO phonon energy at , ms-1 alex06-correlation ; alex07-tbgw the Fermi velocity, the carbon atom mass and the in-plane lattice constant. Using Eq.(3), we obtain which is in excellent agreement to the theoretical value of lazzeri08 and is to be compared to much lower DFT value of lazzeri08 . Finally, concerning the temperature dependence of the energy ordering and the LO-TO difference at , we performed experiments at three different temperatures (300K, 150K and 15K) and find no change in the ordering and a slight increase in the energy difference at with decreasing temperature (2.2 meV instead of 0.7 meV).
In summary we have disentangled overlapping phonon branches and mapped the 2D phonon surfaces at the point of graphite using a combination of IXS and calculations. Excellent agreement for the phonon energies was found once many–body effects at the level are considered. The three highest branches around point are almost triply degenerate, in stark contrast to previous measurements and DFT calculations maultzsch04 ; mohr07-ixs . Furthermore the Kohn anomaly of the TO phonon branch at was directly measured by IXS and the EPC was determined entirely from experiments. An opposite trigonal warping of the TO phonon branch as compared to the electrons and the LO phonon branch was found. This is important for understanding the angular dependence of the kink in the quasiparticle dispersion as measured by ARPES in graphite intercalation compounds and graphene and the linewidth of double–resonant Raman scattering.
A.G. acknowledges an APART fellowship from the Austrian Academy of Sciences and a Marie Curie Individual Fellowship (COMTRANS) from the EU. J.S. acknowledges support from Spanish MICINN (grants MAT2007-60087 and ENE2008-04373) and Generalitat de Catalunya (2005SGR00535). AR and LW are funded by Spanish MEC (FIS2007-65702-C02-01), ”Grupos Consolidados UPV/EHU del Gobierno Vasco” (IT-319-07) and EC-I3 ETSF project (Contract 211956). Calculations were done at IDRIS and Mare Nostrum ”Red Espanola de Supercomputacion”.
References
- (1) S. Baroni et al. Rev. Mod. Phys. 73, 515 (2001).
- (2) R. Al-Jishi et al. Phys. Rev. B 26, 4514 (1982).
- (3) J. Maultzsch et al. Phys. Rev. Lett. 92, 75501 (2004).
- (4) M. Mohr et al. Phys. Rev. B 76, 035439 (2007).
- (5) R. Saito et al. Phys. Rev. Lett. 88, 027401 (2002).
- (6) G. G. Samsonidze et al. Phys. Rev. Lett. 90, 027403 (2003).
- (7) T. Aizawa et al. Phys. Rev. B 42, 11469 (1990).
- (8) G. Kresse et al. Europhys. Lett. 32, 729 (1995).
- (9) P. Pavone et al. Physica B 219&220, 439 (1996).
- (10) A. Bosak et al. Phys.Rev. B 75, 153408 (2007).
- (11) L. Wirtz et al. Solid State Comm. 131, 141 (2004).
- (12) E. J. Woll et al. Phys. Rev. 126, 1693 (1962).
- (13) T. Ando. J. Phys. Soc. Japan 75, 124701 (2006).
- (14) S. Piscanec et al. Phys. Rev. Lett. 93, 185503 (2004).
- (15) M. Lazzeri et al. Phys. Rev. Lett. 97, 266407 (2006).
- (16) S. Pisana et al. Nat. Mat. 6, 198 (2007).
- (17) J. Yan et al. Phys. Rev. Lett. 98, 166802 (2007).
- (18) N. Caudal et al. Phys. Rev. B 75, 115423 (2007).
- (19) A. Das et al. Phys. Rev. Lett. 99, 136803 (2007).
- (20) H. Farhat et al. Phys. Rev. Lett. 99, 145506 (2007).
- (21) J. C. Tsang et al. Nat. Nano. 2, 725 (2007).
- (22) K. Sasaki et al. Phys. Rev. B 78, 235405 (2008).
- (23) N. Hannay et al. Phys. Rev. Lett. 14, 225 (1965).
- (24) M. Calandra et al. Phys. Rev. Lett. 95, 237002 (2005).
- (25) C. Thomsen et al. Phys. Rev. Lett. 85, 5214 (2000).
- (26) A. Ferrari et al. Phys.Rev.Lett. 97, 187401 (2006).
- (27) D. Graf et al. Nano Lett. 7, 238 (2007).
- (28) D. Basko et al. Phys. Rev. B 77, 041409 (2008).
- (29) M. Lazzeri et al. Phys. Rev. B 78, 081406 (2008).
- (30) A. Grüneis et al. Phys. Rev. Lett. 100, 037601 (2008).
- (31) M. Lazzeri et al. Phys. Rev. B 73, 155426 (2006).
- (32) N. Mounet et al. Phys. Rev. B 71, 205214 (2005).
- (33) M. Krisch. J. Raman Spectroscopy 34, 628 (2003).
- (34) K. B. J.P. Perdew et al. Phys. Rev. Lett. 77, 3865 (1996).
- (35) N. Bonini et al. Phys. Rev. Lett. 99, 176802 (2007).
- (36) A. Grüneis et al. cond-matt 0808-1613 (2008).
- (37) A. Grüneis et al. Phys. Rev. B 78, 205425 (2008).