\collaborationCOMPASS Collaboration
The gluon polarisation in the nucleon has been determined by detecting charm production via meson decay to charged and in polarised muon scattering off a longitudinally polarised deuteron target. The data were taken by the COMPASS Collaboration at CERN between 2002 and 2006 and corresponds to an integrated luminosity of 2.8 fb-1. The dominant underlying process of charm production is the photon–gluon fusion to a pair. A leading order QCD approach gives an average gluon polarisation of at a scale and at an average gluon momentum fraction . The longitudinal cross-section asymmetry for production is presented in bins of the transverse momentum and the energy of the meson.
PACS: 13.60.-r, 13.88.+e, 14.20.Dh, 14.70.Dj
keywords: Inelastic muon scattering; Spin; Asymmetry; Gluon polarisation \submittedsubmitted to Physics Letters
{Authlist}
The COMPASS Collaboration
M. Alekseev\Irefturin_p,
V.Yu. Alexakhin\Irefdubna,
Yu. Alexandrov\Irefmoscowlpi,
G.D. Alexeev\Irefdubna,
A. Amoroso\Irefturin_u,
A. Austregisilio\IIrefcernmunichtu,
B. Badełek\Irefwarsaw,
F. Balestra\Irefturin_u,
J. Ball\Irefsaclay,
J. Barth\Irefbonnpi,
G. Baum\Irefbielefeld,
Y. Bedfer\Irefsaclay,
J. Bernhard\Irefmainz,
R. Bertini\Irefturin_u,
M. Bettinelli\Irefmunichlmu,
R. Birsa\Ireftriest_i,
J. Bisplinghoff\Irefbonniskp,
P. Bordalo\IAreflisbona,
F. Bradamante\Ireftriest,
A. Bravar\Ireftriest_i,
A. Bressan\Ireftriest,
G. Brona\Irefwarsaw,
E. Burtin\Irefsaclay,
M.P. Bussa\Irefturin_u,
A. Chapiro\Ireftriestictp,
M. Chiosso\Irefturin_u,
S.U. Chung\Irefmunichtu,
A. Cicuttin\IIreftriest_itriestictp,
M. Colantoni\Irefturin_i,
M.L. Crespo\IIreftriest_itriestictp,
S. Dalla Torre\Ireftriest_i,
T. Dafni\Irefsaclay,
S. Das\Irefcalcutta,
S.S. Dasgupta\Irefburdwan,
O.Yu. Denisov\IArefturin_ib,
L. Dhara\Irefcalcutta,
V. Diaz\IIreftriest_itriestictp,
A.M. Dinkelbach\Irefmunichtu,
S.V. Donskov\Irefprotvino,
N. Doshita\IIrefbochumyamagata,
V. Duic\Ireftriest,
W. Dünnweber\Irefmunichlmu,
A. Efremov\Irefdubna,
A. El Alaoui\IrefsaclayP.D. Eversheim\Irefbonniskp,
W. Eyrich\Ireferlangen,
M. Faessler\Irefmunichlmu,
A. Ferrero\IIrefturin_ucern,
M. Finger\Irefpraguecu,
M. Finger jr.\Irefdubna,
H. Fischer\Ireffreiburg,
C. Franco\Ireflisbon,
J.M. Friedrich\Irefmunichtu,
R. Garfagnini\Irefturin_u,
F. Gautheron\Irefbielefeld,
O.P. Gavrichtchouk\Irefdubna,
R. Gazda\Irefwarsaw,
S. Gerassimov\IIrefmoscowlpimunichtu,
R. Geyer\Irefmunichlmu,
M. Giorgi\Ireftriest,
B. Gobbo\Ireftriest_i,
S. Goertz\IIrefbochumbonnpi,
S. Grabmüller\Irefmunichtu,
O.A. Grajek\Irefwarsaw,
A. Grasso\Irefturin_u,
B. Grube\Irefmunichtu,
R. Gushterski\Irefdubna,
A. Guskov\Irefdubna,
F. Haas\Irefmunichtu,
R. Hagemann\Ireffreiburg,D. von Harrach\Irefmainz,
T. Hasegawa\Irefmiyazaki,
J. Heckmann\Irefbochum,
F.H. Heinsius\Ireffreiburg,
R. Hermann\Irefmainz,
F. Herrmann\Ireffreiburg,C. Heß\Irefbochum,
F. Hinterberger\Irefbonniskp,
M. von Hodenberg\Ireffreiburg,N. Horikawa\IArefnagoyac,
Ch. Höppner\Irefmunichtu,N. d’Hose\Irefsaclay,
C. Ilgner\IIrefcernmunichlmu,
S. Ishimoto\IArefnagoyad,
O. Ivanov\Irefdubna,
Yu. Ivanshin\Irefdubna,
T. Iwata\Irefyamagata,
R. Jahn\Irefbonniskp,
P. Jasinski\Irefmainz,
G. Jegou\Irefsaclay,
R. Joosten\Irefbonniskp,
E. Kabuß\Irefmainz,
W. Käfer\Ireffreiburg,D. Kang\Ireffreiburg,
B. Ketzer\Irefmunichtu,
G.V. Khaustov\Irefprotvino,
Yu.A. Khokhlov\Irefprotvino,
J. Kiefer\Ireffreiburg,Yu. Kisselev\IIrefbielefeldbochum,
F. Klein\Irefbonnpi,
K. Klimaszewski\Irefwarsaw,
S. Koblitz\Irefmainz,
J.H. Koivuniemi\Irefbochum,
V.N. Kolosov\Irefprotvino,
E.V. Komissarov\IArefdubna+,
K. Kondo\IIrefbochumyamagata,
K. Königsmann\Ireffreiburg,
I. Konorov\IIrefmoscowlpimunichtu,
V.F. Konstantinov\Irefprotvino,
A. Korzenev\IArefmainzb,
A.M. Kotzinian\IIrefdubnasaclay,O. Kouznetsov\IIrefdubnasaclay,
K. Kowalik\IIrefwarsawsaclay,
M. Krämer\Irefmunichtu,
A. Kral\Irefpraguectu,
Z.V. Kroumchtein\Irefdubna,
R. Kuhn\Irefmunichtu,
F. Kunne\Irefsaclay,
K. Kurek\Irefwarsaw,
J.M. Le Goff\Irefsaclay,
A.A. Lednev\Irefprotvino,
A. Lehmann\Ireferlangen,
S. Levorato\Ireftriest,
J. Lichtenstadt\Ireftelaviv,
T. Liska\Irefpraguectu,
A. Maggiora\Irefturin_i,
M. Maggiora\Irefturin_u,A. Magnon\Irefsaclay,
G.K. Mallot\Irefcern,
A. Mann\Irefmunichtu,
C. Marchand\Irefsaclay,
J. Marroncle\Irefsaclay,
A. Martin\Ireftriest,
J. Marzec\Irefwarsawtu,
F. Massmann\Irefbonniskp,
T. Matsuda\Irefmiyazaki,
A.N. Maximov\IArefdubna+,W. Meyer\Irefbochum,
T. Michigami\Irefyamagata,
Yu.V. Mikhailov\Irefprotvino,
M.A. Moinester\Ireftelaviv,
A. Mutter\IIreffreiburgmainz,
A. Nagaytsev\Irefdubna,
T. Nagel\Irefmunichtu,
J. Nassalski\Irefwarsaw,
S. Negrini\Irefbonniskp,
F. Nerling\Ireffreiburg,
S. Neubert\Irefmunichtu,
D. Neyret\Irefsaclay,
V.I. Nikolaenko\Irefprotvino,
A.G. Olshevsky\Irefdubna,
M. Ostrick\IIrefbonnpimainz,
A. Padee\Irefwarsawtu,
R. Panknin\Irefbonnpi,
S. Panebianco\Irefsaclay,D. Panzieri\Irefturin_p,
B. Parsamyan\Irefturin_u,
S. Paul\Irefmunichtu,
B. Pawlukiewicz-Kaminska\Irefwarsaw,
E. Perevalova\Irefdubna,
G. Pesaro\Ireftriest,
D.V. Peshekhonov\Irefdubna,
G. Piragino\Irefturin_u,
S. Platchkov\Irefsaclay,
J. Pochodzalla\Irefmainz,
J. Polak\IIrefliberectriest,
V.A. Polyakov\Irefprotvino,
G. Pontecorvo\Irefdubna,
J. Pretz\Irefbonnpi,
C. Quintans\Ireflisbon,
J.-F. Rajotte\Irefmunichlmu,
S. Ramos\IAreflisbona,
V. Rapatsky\Irefdubna,
G. Reicherz\Irefbochum,
D. Reggiani\Irefcern,
A. Richter\Ireferlangen,
F. Robinet\Irefsaclay,
E. Rocco\Irefturin_u,
E. Rondio\Irefwarsaw,
D.I. Ryabchikov\Irefprotvino,
V.D. Samoylenko\Irefprotvino,
A. Sandacz\Irefwarsaw,
H. Santos\IAreflisbona,
M.G. Sapozhnikov\Irefdubna,
S. Sarkar\Irefcalcutta,
I.A. Savin\Irefdubna,
G. Sbrizza\Ireftriest,
P. Schiavon\Ireftriest,
C. Schill\Ireffreiburg,
L. Schmitt\IArefmunichtue,
W. Schröder\Ireferlangen,
O.Yu. Shevchenko\Irefdubna,
H.-W. Siebert\Irefmainz,
L. Silva\Ireflisbon,
L. Sinha\Irefcalcutta,
A.N. Sissakian\Irefdubna,
M. Slunecka\Irefdubna,
G.I. Smirnov\Irefdubna,
S. Sosio\Irefturin_u,
F. Sozzi\Ireftriest,
A. Srnka\Irefbrno,
M. Stolarski\IIrefwarsawcern,
M. Sulc\Irefliberec,
R. Sulej\Irefwarsawtu,
S. Takekawa\Ireftriest,
S. Tessaro\Ireftriest_i,
F. Tessarotto\Ireftriest_i,
A. Teufel\Ireferlangen,
L.G. Tkatchev\Irefdubna,
G. Venugopal\Irefbonniskp,
M. Virius\Irefpraguectu,
N.V. Vlassov\Irefdubna,
A. Vossen\Ireffreiburg,
Q. Weitzel\Irefmunichtu,
K. Wenzl\Ireffreiburg,R. Windmolders\Irefbonnpi,
W. Wiślicki\Irefwarsaw,
H. Wollny\Ireffreiburg,
K. Zaremba\Irefwarsawtu,
M. Zavertyaev\Irefmoscowlpi,
E. Zemlyanichkina\Irefdubna,
M. Ziembicki\Irefwarsawtu,
J. Zhao\IIrefmainztriest_i,
N. Zhuravlev\Irefdubna and
A. Zvyagin\Irefmunichlmu
\InstfootbielefeldUniversität Bielefeld, Fakultät für Physik, 33501 Bielefeld, Germany\Areff \InstfootbochumUniversität Bochum, Institut für Experimentalphysik, 44780 Bochum, Germany\Areff \InstfootbonniskpUniversität Bonn, Helmholtz-Institut für Strahlen- und Kernphysik, 53115 Bonn, Germany\Areff \InstfootbonnpiUniversität Bonn, Physikalisches Institut, 53115 Bonn, Germany\Areff \InstfootbrnoInstitute of Scientific Instruments, AS CR, 61264 Brno, Czech Republic\Arefg \InstfootburdwanBurdwan University, Burdwan 713104, India\Arefh \InstfootcalcuttaMatrivani Institute of Experimental Research & Education, Calcutta-700 030, India\Arefi \InstfootdubnaJoint Institute for Nuclear Research, 141980 Dubna, Moscow region, Russia \InstfooterlangenUniversität Erlangen–Nürnberg, Physikalisches Institut, 91054 Erlangen, Germany\Areff \InstfootfreiburgUniversität Freiburg, Physikalisches Institut, 79104 Freiburg, Germany\Areff \InstfootcernCERN, 1211 Geneva 23, Switzerland \InstfootliberecTechnical University in Liberec, 46117 Liberec, Czech Republic\Arefg \InstfootlisbonLIP, 1000-149 Lisbon, Portugal\Arefj \InstfootmainzUniversität Mainz, Institut für Kernphysik, 55099 Mainz, Germany\Areff \InstfootmiyazakiUniversity of Miyazaki, Miyazaki 889-2192, Japan\Arefk \InstfootmoscowlpiLebedev Physical Institute, 119991 Moscow, Russia \InstfootmunichlmuLudwig-Maximilians-Universität München, Department für Physik, 80799 Munich, Germany\AAreffl \InstfootmunichtuTechnische Universität München, Physik Department, 85748 Garching, Germany\AAreffl \InstfootnagoyaNagoya University, 464 Nagoya, Japan\Arefk \InstfootpraguecuCharles University, Faculty of Mathematics and Physics, 18000 Prague, Czech Republic\Arefg \InstfootpraguectuCzech Technical University in Prague, 16636 Prague, Czech Republic\Arefg \InstfootprotvinoState Research Center of the Russian Federation, Institute for High Energy Physics, 142281 Protvino, Russia \InstfootsaclayCEA DAPNIA/SPhN Saclay, 91191 Gif-sur-Yvette, France \InstfoottelavivTel Aviv University, School of Physics and Astronomy, 69978 Tel Aviv, Israel\Arefm \Instfoottriest_iTrieste Section of INFN, 34127 Trieste, Italy \InstfoottriestUniversity of Trieste, Department of Physics and Trieste Section of INFN, 34127 Trieste, Italy \InstfoottriestictpAbdus Salam ICTP and Trieste Section of INFN, 34127 Trieste, Italy \Instfootturin_uUniversity of Turin, Department of Physics and Torino Section of INFN, 10125 Turin, Italy \Instfootturin_iTorino Section of INFN, 10125 Turin, Italy \Instfootturin_pUniversity of Eastern Piedmont, 1500 Alessandria, and Torino Section of INFN, 10125 Turin, Italy \InstfootwarsawSołtan Institute for Nuclear Studies and University of Warsaw, 00-681 Warsaw, Poland\Arefn \InstfootwarsawtuWarsaw University of Technology, Institute of Radioelectronics, 00-665 Warsaw, Poland\Arefo \InstfootyamagataYamagata University, Yamagata, 992-8510 Japan\Arefk \Anotfoot+Deceased \AnotfootaAlso at IST, Universidade Técnica de Lisboa, Lisbon, Portugal \AnotfootbOn leave of absence from JINR Dubna \AnotfootcAlso at Chubu University, Kasugai, Aichi, 487-8501 Japanj) \AnotfootdAlso at KEK, 1-1 Oho, Tsukuba, Ibaraki, 305-0801 Japan \AnotfooteAlso at GSI mbH, Planckstr. 1, D-64291 Darmstadt, Germany \AnotfootfSupported by the German Bundesministerium für Bildung und Forschung \AnotfootgSuppported by Czech Republic MEYS grants ME492 and LA242 \AnotfoothSupported by DST-FIST II grants, Govt. of India \AnotfootiSupported by the Shailabala Biswas Education Trust \AnotfootjSupported by the Portuguese FCT - Fundação para a Ciência e Tecnologia grants POCTI/FNU/49501/2002 and POCTI/FNU/50192/2003 \AnotfootkSupported by the MEXT and the JSPS under the Grants No.18002006, No.20540299 and No.18540281; Daiko Foundation and Yamada Foundation \AnotfootlSupported by the DFG cluster of excellence ‘Origin and Structure of the Universe’ (www.universe-cluster.de) \AnotfootmSupported by the Israel Science Foundation, founded by the Israel Academy of Sciences and Humanities \AnotfootnSupported by Ministry of Science and Higher Education grant 41/N-CERN/2007/0 \AnotfootoSupported by KBN grant nr 134/E-365/SPUB-M/CERN/P-03/DZ299/2000
1 Introduction
Pioneering experiments on the spin structure of the nucleon performed in the seventies at SLAC [1] were followed by the EMC experiment at CERN which obtained a surprisingly small quark contribution to the proton spin [2], in contrast to the naive expectation that the spin of the nucleon is built mainly from valence quark spins [3]. This result triggered extensive studies of the spin structure of the nucleon in polarised lepton nucleon scattering experiments at CERN by the SMC [4] and COMPASS [5], at SLAC [6], at DESY [7] and at JLAB [8] as well as in polarised proton–proton collisions at RHIC [9, 10]. As a result, the parton helicity distributions in the nucleon were extracted using perturbative QCD analyses. The contribution of the quark spins to the nucleon spin is now confirmed to be around 30%, smaller than 60%, the value expected from the Ellis–Jaffe sum rule [11]. The reduction from the naive expectation of 100% can be explained by the relativistic nature of quarks (e.g. in the MIT bag model) [12]. However, due to the limited range in the four-momentum transfer squared, , covered by the experiments, the QCD analyses (e.g. [5]) show limited sensitivity to the gluon helicity distribution as a function of the gluon momentum fraction , , and to its first moment, . (The perturbative scale, , in these QCD analyses is set to .) The determination of from QCD evolution has therefore to be complemented by direct measurements in dedicated experiments.
The average gluon polarisation in a limited range of , , has been determined in a model-dependent way from the photon–gluon fusion (PGF) process by HERMES [13], SMC [14] and COMPASS [15]. These analyses used events containing hadron pairs with high transverse momenta, , (typically 1 to 2 GeV/) with respect to the virtual photon direction. PYTHIA [16] was used by HERMES and by COMPASS for the analysis of small events, while LEPTO [17] was used in SMC and the ongoing COMPASS analysis for events. This method provides good statistical precision but relies on Monte Carlo generators simulating QCD processes. The measurements point towards a small value of the gluon polarisation at . This is in line with recent results from PHENIX [9] and STAR [10] at RHIC.
Taking into account quark and gluon orbital angular momenta, , the nucleon spin projection (in units of ) is
| (1) |
where is the first moment of the sum of the quark helicity distributions. The decomposition of Eq. (1), however gauge dependent, is defined in the infinite momentum frame where the quark parton model is valid.
Here we present a new result on from muon–deuteron scattering.111The present result includes a larger data sample and an improved analysis method and thus supersedes the one given in Ref. [20]. The gluon polarisation is determined assuming that open-charm production is dominated by the PGF mechanism yielding a pair which fragments mainly into mesons. This assumption is supported by the measurements of in the COMPASS kinematic domain [18] and further discussed in [19]. This method has the advantage that in lowest order of the strong coupling constant there are no other contributions to the cross-section; however, it is statistically limited as will be shown in section 3. In the present analysis only one charmed meson is required in every event. This meson is selected through its decay in one of the two channels: ( sample) and ( sample) and their charge conjugates.
2 Experimental set-up
The data were collected between 2002 and 2006 with the COMPASS experiment at the M2 muon beam line of the CERN SPS. A detailed description of the experiment for the years 2002 to 2004 can be found in Ref. [21]. For the 2006 data taking the polarised target and the spectrometer were considerably upgraded.
The measurements were performed using a beam of 160 GeV/. The beam muons originating from and decays are naturally polarised with an average polarisation, , of about 80% with a relative uncertainty of 5% [22]. The momentum of each incoming muon is measured upstream of the experimental area with a precision of in a beam momentum station consisting of layers of scintillators. The incoming muon direction and position is measured with a detector telescope in front of the target. A precision of 30 rad is obtained for the track direction.
The polarised 6LiD target is housed in a superconducting solenoid with a polar angle aperture of 70 mrad in 2002 to 2004. The target consisted of two 60 cm long cells (upstream , downstream ), separated by 10 cm, longitudinally polarised with opposite orientations. The spin directions were reversed every eight hours by rotating the field of the target magnet system. The target was upgraded in 2006 with a new solenoid with an aperture of 180 mrad. To reduce the systematic errors due to the different spectrometer acceptances for the upstream and downstream cells, a 3-cell target configuration was installed. A central 60 cm long cell is placed in-between two 30 cm long cells with polarisations opposite to the central one.222In 2006 and stand for the central target cell and for the sum of the outer target cells, respectively. In this set-up the average acceptances for both spin directions are very similar and therefore the magnetic field was rotated only once per day. The average target polarisations, , were % with a relative uncertainty of 5%. The dilution factor , accounting for the fraction of polarisable nucleons in the target, is about 0.4, since the 6Li nucleus basically consists of a 4He core plus a deuteron. The exact value of is kinematics dependent and is calculated as described in Ref. [23]. Its relative uncertainty is 5%.
The two-stage COMPASS spectrometer is designed to reconstruct the scattered muons and the produced hadrons in a wide momentum range. Particle tracking is performed using several stations of scintillating fibres, micromesh gaseous chambers and gas electron multiplier chambers for the small angles tracks. Large area tracking devices comprise gaseous detectors (drift chambers, straw tubes and multiwire proportional chambers). The detectors are placed around the two spectrometer magnets. The direction of the tracks reconstructed at an interaction point in the target is determined with a precision better than 0.2 mrad and the momentum resolution for charged tracks detected in the first spectrometer is about 1.2% whereas is it about 0.5% in the second spectrometer. The achieved longitudinal vertex resolution varying from 5 mm to 25 mm along the target allows assigning each event to a particular target cell, i.e. a specific target spin direction. For 2006 the tracking systems in the first stage were adapted to match the increased aperture of the polarised target magnet. The trigger is formed by several hodoscope systems supplemented by two hadron calorimeters. Muons are identified downstream of the hadron absorbers. A Ring Imaging CHerenkov counter (RICH) with a C4F10 radiator is used in the first spectrometer stage for charged particle identification. It is equipped with multiwire proportional chambers with CsI photocathodes to detect the UV Cherenkov photons. The RICH, too, underwent a considerable upgrade for the 2006 data taking. In the central part, the photon detectors were replaced by multi-anode photomultiplier tubes, yielding considerably higher photon detection efficiency along with a much faster response. For the outer parts the readout electronics was refurbished, allowing a significant reduction of the background. The data taking amounted to 40 weeks in 2002 to 2006 and corresponds to an integrated luminosity of 2.8 fb-1.
3 Data selection
In the present analysis the selection procedure required an incoming muon, a scattered muon, an interaction vertex in the target and at least two additional tracks. The kinematic variables like the four-momentum transfer squared , the relative energy transfer , and the Bjorken variable , where is the nucleon mass and E the incident muon energy, are calculated from the four-momenta of the incident and scattered muon. No kinematic cuts are applied on , or . Thus the selected data sample includes the events with an interaction vertex from quasi-real photo-production to a of about 100 . Note that all the events are in the deep inelastic region, i.e. the invariant mass of the final state, , is larger than 4 GeV/.
The mesons are reconstructed through their decay which has a branching ratio of 3.9%. Due to multiple Coulomb scattering of the charged particles in the solid state target the spatial resolution of the vertex reconstruction is not sufficient to separate the production and decay vertices. The mesons are selected using the invariant mass of their decay products.
To reduce the large combinatorial background only identified pairs are used. The identification in the RICH starts from reconstructed tracks with measured momenta. The likelihood for different mass hypotheses and for a background hypothesis are computed for each track, using the angles between the track and the detected Cherenkov photons. The likelihood functions, used in this computation, were defined from the corresponding expected angular distribution of photons; the expected distribution for background was obtained using a sample of photons not associated to reconstructed tracks. Particles are identified as kaons or pions on the basis of the likelihood associated to the pion, kaon, proton and background hypotheses. The procedure restricts the studied events to a sample with at least one kaon and one pion of momenta exceeding the Cherenkov threshold of and , respectively. Simulations using the AROMA [27] generator and a full spectrometer simulation based on GEANT have shown that about 70 % (90%) of kaons (pions) coming from decays exceed this threshold for the reconstructed sample.
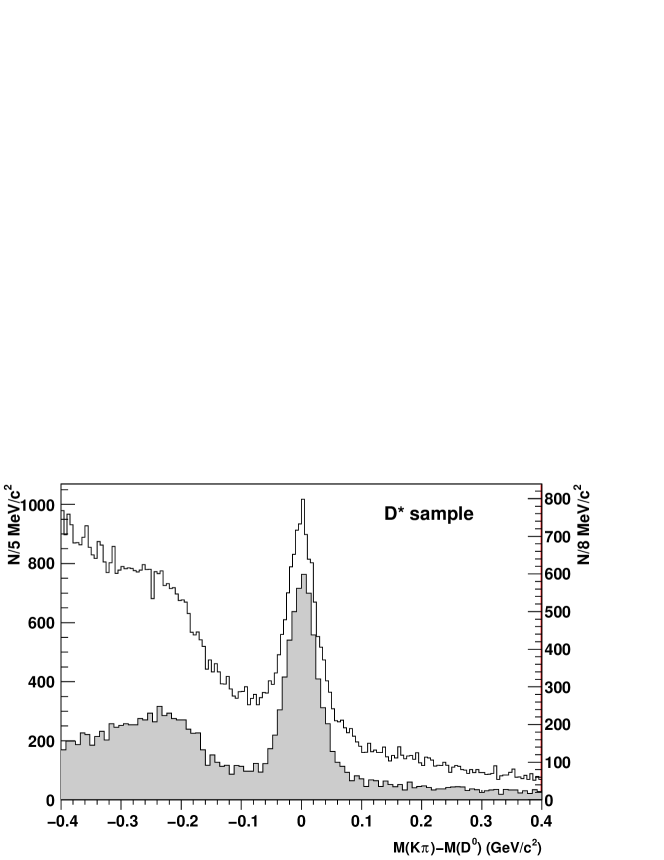
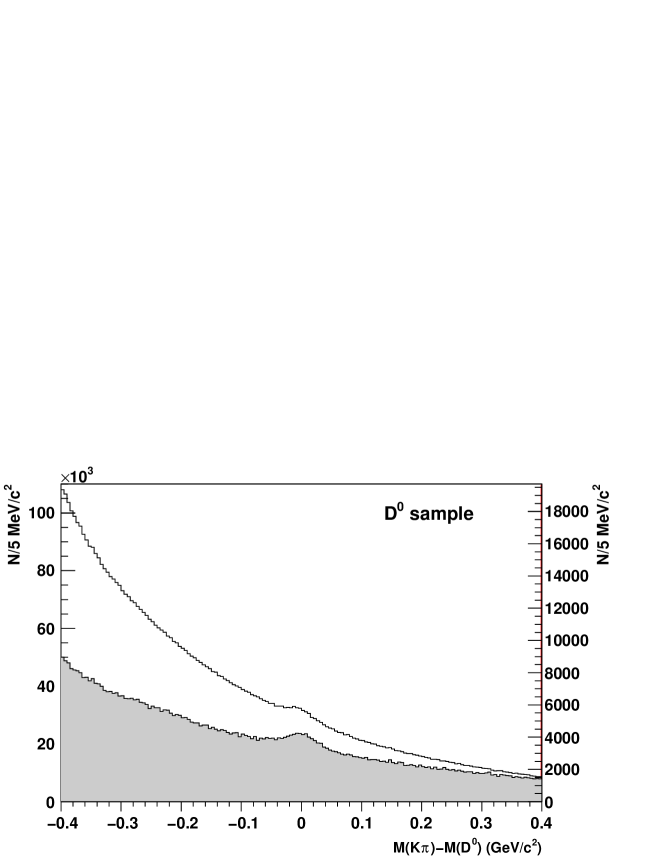
All events have to satisfy a kinematic cut: , where is the fraction of the energy of the virtual photon carried by the meson candidate. They are further divided into a and a sample, analysed independently. In the former one an additional track with a proper charge, a slow pion candidate, is demanded at the vertex. RICH likelihoods, used to reject electrons from those candidates, reduce the combinatorial background by a factor two. Furthermore, in the case of the , a cut on the mass difference is imposed, , where and are the masses of the and the candidates, respectively. Finally it was demanded that for the sample and for the , where is the decay angle in the c.m. system relative to the flight direction. The events entering the sample are not used in the sample. The resulting mass spectra for the and samples with one pair in the mass range MeV/ MeV/ are displayed in Fig. 1. A signal to background ratio in the signal region of about 1 is obtained for the sample and of about 0.1 for the sample with a mass resolution of about 22 MeV/ and 25 MeV/, respectively. The number of mesons is about 8,700 and 37,400 in the and the samples.
For the final event samples the mean value of is , ranges from to 0.6 with a mean value of 0.04 and from 0.1 to 1 with a mean value of 0.55. Note that the perturbative scale for the selected events is not given by , but by the transverse mass of the charmed quarks, .
4 Method
This section describes the determination of the gluon polarisation from the event samples collected in two different spin configurations and target cells. The same method is used in section 6 for the asymmetry determination. The number of events collected in a given target cell and time interval is
| (2) |
Here, , where the arrows indicate the relative beam and target spin orientations, is the longitudinal double spin cross-section asymmetry of the events in the central peak of Fig. 1 and is the corresponding asymmetry originating from the combinatorial background events in the mass spectra. Also, , and denote a set of kinematic variables describing an event (, , …), while , and are the spectrometer acceptance, the integrated incident muon flux and the number of target nucleons, respectively. The differential unpolarised cross-sections of signal and background events folded with the experimental resolution as a function of and are represented by and , respectively. The ratio will be called “signal purity”. In the present analysis the background is a combinatorial background and the signal purity can be extracted from the data using the invariant mass distributions of Fig. 1. This is in contrast to the high- analyses, where the physical background has to be estimated using a Monte Carlo simulation (MC) [13, 14, 15]. Information on the gluon polarisation is contained in which can be decomposed in LO QCD as
| (3) |
Here is the analysing power of the process which includes the so-called depolarisation factor accounting for the polarisation transfer from the lepton to the virtual photon. The background asymmetry can be written as the product of the virtual photon asymmetry and the depolarisation factor and is assumed to be independent of .
In the present analysis the average gluon polarisation and the average background asymmetry are determined simultaneously as weighted averages over the accessible kinematic range. This method does not require an arbitrary selection of mass windows for the signal and background regions as in the classical side-band subtraction method. Moreover, it yields a smaller statistical error compared to the latter, reaching practically the lower bound of the unbinned likelihood method [25]. This is achieved by weighting every event with its analysing power . The same procedure is applied for . The weighting factors are thus
| (4) |
The target polarisation , as a time dependent quantity, is not included into the weights because including it may generate false asymmetries. Note that all events in the mass window MeV/ MeV/ of Fig. 1 are used. Since the factor in vanishes for events far away from the central peak, these events do not contribute significantly to , but contribute to the determination of .
By considering sums over the different event samples eight equations are derived from Eq. (2) [26]
| (5) |
| (6) |
for the two target cells before () and after () the target spin reversal, once weighted with and once with (). Here is the number of events observed in cell . These eight equations contain 10 unknowns which are , and eight acceptance factors .
Assuming that possible acceptance variations affect the upstream and downstream cells in the same way, i.e. , reduces the number of unknowns to eight. With an extra, much weaker assumption that signal and background events from the same target cell are affected in the same way by the acceptance variations, one arrives at a system of eight equations with seven unknowns. Possible deviations from the above assumptions may generate false asymmetries which are included in the systematic error. Using the set of eight equations (see Eq. (5)), the gluon polarisation and the background asymmetry are determined with a standard least square minimisation procedure taking into account the statistical correlation between the number of events in a given target cell weighted by and by . The analysis is performed independently for the and samples.
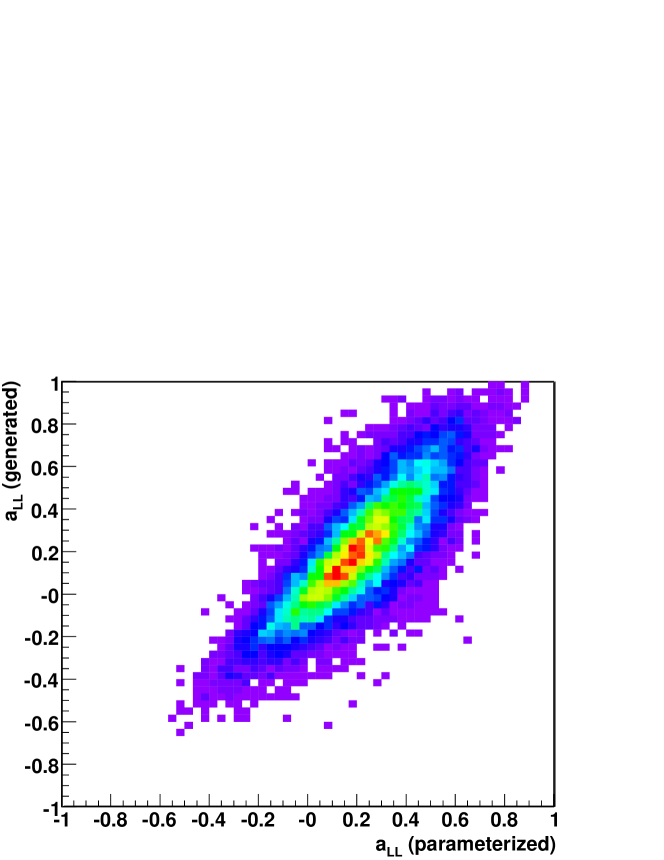
The quantities , , and are obtained as follows. For , values averaged over about one hour of data taking are used, a timescale over which the assumption of a stable target polarisation was shown to be justified. The beam polarisation is parameterised as a function of the momentum which is measured for each incoming muon. The photon–gluon analysing power, , is parameterised in terms of measured kinematic variables. It depends on partonic variables not accessible experimentally and is obtained using a neural network [28] trained on a Monte Carlo sample for mesons. For this purpose PGF events were generated with AROMA [27] in leading order QCD, processed by GEANT to simulate the response of the detector and finally reconstructed like real events. It was checked that the MC simulation describes the background subtracted data distributions in and sufficiently well. The scale, , used in the MC was chosen as the transverse mass of the produced charmed quark pair, and is sufficiently large to justify the perturbative approach. The correlation between the generated and the parameterised is 81% (see Fig. 2). The same parameterisation is valid for the and the samples.
Finally, the signal purity, , as a function of the invariant mass for each event, is determined from a fit of the invariant mass distributions of the and samples. In this fit the signal is described by a Gaussian distribution. In the case the background function is the sum of an exponential and a Gaussian, the latter added to describe the reflection of the decay, where the meson is not observed. In the case the background is described by the sum of two exponential distributions. Note that not only the variation of the signal purity (or ) with the mass, but also with other characteristics of the event, is taken into account. This is achieved by a method [29] based on a multivariate approach starting with a parameterisation of the signal-to-background ratio, integrated over a window around the mass, . The window is of MeV/ for the sample and MeV/ for the sample. The parametrisation is the product of 10 functions, each one depending on one of the 10 variables describing the event kinematics and the RICH response. Typically six bins are defined in each of the variables and the mass spectra are fitted in each bin of each variable to provide the values of the ratios using the signal and background functions described above. Each of the 10 variables is considered successively and the parameters of the corresponding function are adjusted to reproduce the ratios in all bins in this variable. Adjusting the parameters for one variable affects the agreement obtained for previous variables and thus the adjustment procedure has to be repeated until convergence is reached and all ratios are reproduced simultaneously.
Using this parametrisation, each sample ( and ) is split into intervals of and the mass spectrum is fitted separately in each of them. As an illustration the invariant mass spectra obtained in the highest interval of are compared in Fig. 1 to those obtained for the full samples. The signal purity for each event is obtained from the fit to the mass spectrum in the interval of containing the event and this value is adjusted to the exact value of for this event. To validate the procedure the fit in each interval is integrated over the window around the mass peak to obtain the value and compared with the average value obtained from the parametrisation. The consistency obtained guarantees that using the in the event weights does not introduce a bias. In addition, it is checked that weighting the wrong-charge background ( and charge conjugates) with the parametrised values of the mass averaged signal purity, , does not generate any artificial peak at .
5 Results for the gluon polarisation
A value for is obtained for each of the 40 weeks of data taking separately for the and the sample. The results = for the and for the sample, are the weighted mean of these values. The resulting background asymmetries, for the sample and for the sample, are consistent with zero. Assuming that is approximately linearly dependent on in the range covered, gives a measurement of , where is calculated using the signal weights. This assumption is supported by the results of the COMPASS QCD analysis [5].
| source | source | ||
|---|---|---|---|
| False asymmetry | Beam polarisation | 0.02 | |
| Target polarisation | 0.02 | ||
| Dilution factor | 0.02 | ||
| Total error 0.11(0.07) | |||
The major contributions to the systematic uncertainty are listed in Table 1. The contributions from , and are discussed with more detail in Ref. [5]. To study the influence of false asymmetries, the final samples from Fig. 1 were subdivided into two samples using criteria related to the experimental apparatus, e.g. kaons going to the upper or to the lower spectrometer parts. The resulting asymmetries were found to be compatible within their statistical accuracy, thus no false asymmetries were observed. An upper limit of the contribution of time dependent acceptance effects to the systematic uncertainty was estimated from the dispersion of the values for and for the 40 weeks of data taking. Assuming that possible detector instabilities are similar for background and signal events and applying the method used in Ref. [5] leads to a conservative limit of for both decay channels.
Varying the procedure to build the parameterisation of , and in particular the functional form of the background fit, results in an error on of 0.07 and 0.01 for the and the sample, respectively. As expected, the uncertainty on is larger for the case, where the signal-to-background ratio is smaller. To estimate the influence of the simulation parameters, i.e. charmed quark mass (varied from 1.3 GeV/ to 1.6 GeV/), parton distribution functions and scales (varied by a factor of 8), MC samples with different parameter sets were generated and was recalculated, resulting in an uncertainty on of 0.05 and 0.03 for the and the sample, respectively. Other contributions, like radiative corrections and event migration between target cells, were studied and found to be negligible.
The final value is the weighted mean of the two values for the and the sample and amounts to
| (7) |
in the range of with , and a scale . The contributions to the systematic uncertainty for each sample are added in quadrature to obtain the total error, 0.11 and 0.07 for the and sample, respectively. The larger value is chosen as a conservative estimate of the final error in Eq. (7).
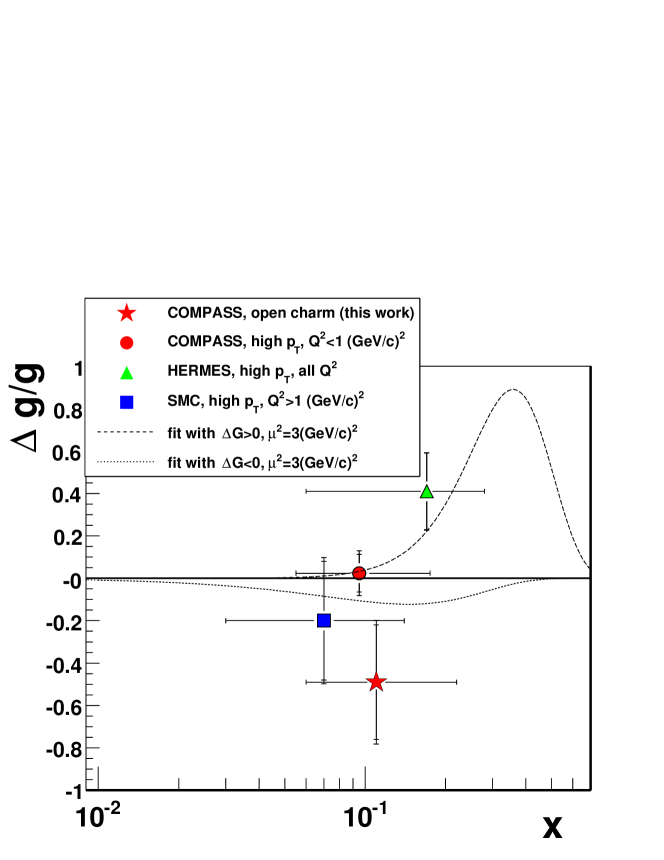
In Fig. 3 the above result is compared to other measurements of and to two parametrisations from the NLO QCD analysis of the world data on the polarised structure function , performed by COMPASS [5]: with 0 (broken line) and with (dotted line). The present result is consistent with previous measurements favouring small values of . Note that is the scale for the analysis of the SMC [14] measurement and the QCD analysis [5]. The scale of the present result is given by the transverse mass of the charmed quarks . The other experimental points in Fig. 3 are given at .
6 Asymmetry determination
The data described in sections 2 and 3 also allow for the determination of the virtual photon asymmetry for production, . In contrast to this asymmetry is independent of the interpretation in LO QCD. The asymmetry averaged over the full kinematic range would be largely diluted because of the large dispersion of . The asymmetry is thus extracted in bins of the transverse momentum of the with respect to the virtual photon, , and the energy of the in the laboratory system, . The bins were chosen such that the variation of within each bin is small compared to the variation over the whole sample. In principle also depends on the inclusive variables and , but an additional binning is not necessary because the dependence is very weak. This is clearly seen in LO, where . In a given bin in and the factor is almost independent of and , and the same is true for .
The asymmetry is obtained in exactly the same way as , except that the factor is replaced by in the definition of the signal weight in Eq. (4), i.e. . This provides under the assumption that the bins of and are small enough. It was verified that this approximation and the independence on and are well fulfilled for the cross-section evaluated in LO QCD. At higher orders, the variation of the cross-section are expected to be similar and thus the approximations to remain valid.
Table 2 gives averaged over the and sample in each bin, together with the average of several kinematic variables. All averages are calculated with the weight . The muon-nucleon asymmetry can be obtained by multiplying by . Both asymmetries can be used in global NLO QCD fits to constrain the values of .
As a cross-check we have calculated from in each bin by dividing the asymmetry by the corresponding . Combining all bins we got a result consistent with the result in Eq. (7), with an increase of 5% in the statistical error. The contributions to the systematic error listed in Table 2 contribute as well to the systematic error of the asymmetries, except for the contribution of . This leads to a relative systematic uncertainty of 20% for which is 100% correlated between the bins.
| bin limits | ||||||||
|---|---|---|---|---|---|---|---|---|
| (GeV/) | (GeV) | (GeV/) | (GeV) | |||||
| 0-0.3 | 0-30 | 0.47 | 0.50 | 0.19 | 24.8 | 0.57 | 0.37 | |
| 0-0.3 | 30-50 | 0.58 | 0.75 | 0.20 | 39.2 | 0.70 | 0.48 | |
| 0-0.3 | 0.67 | 1.06 | 0.20 | 60.0 | 0.80 | 0.61 | ||
| 0.3-0.7 | 0-30 | 0.47 | 0.47 | 0.50 | 25.1 | 0.56 | 0.26 | |
| 0.3-0.7 | 30-50 | 0.58 | 0.65 | 0.51 | 39.4 | 0.71 | 0.34 | |
| 0.3-0.7 | 0.67 | 0.68 | 0.50 | 59.6 | 0.80 | 0.46 | ||
| 0.7-1 | 0-30 | 0.48 | 0.53 | 0.85 | 25.2 | 0.58 | 0.13 | |
| 0.7-1 | 30-50 | 0.58 | 0.66 | 0.85 | 39.1 | 0.70 | 0.17 | |
| 0.7-1 | 0.68 | 0.73 | 0.84 | 59.4 | 0.81 | 0.26 | ||
| 1-1.5 | 0-30 | 0.50 | 0.49 | 1.21 | 25.7 | 0.60 | 0.01 | |
| 1-1.5 | 30-50 | 0.60 | 0.62 | 1.22 | 39.5 | 0.73 | 0.00 | |
| 1-1.5 | 0.69 | 0.77 | 1.22 | 59.3 | 0.83 | 0.04 | ||
| 0-30 | 0.52 | 0.51 | 1.77 | 26.2 | 0.63 | |||
| 30-50 | 0.61 | 0.68 | 1.87 | 40.0 | 0.74 | |||
| 0.71 | 0.86 | 1.94 | 59.9 | 0.84 | ||||
7 Conclusion
We have studied D0 meson production in 160 GeV polarised muon scattering off a polarised deuteron target. The decays into pairs of charged K and mesons were selected using analysing the invariant mass distributions of identified K pairs. Only one meson was demanded in each event.
The data provide an average value of the gluon polarisation in the nucleon, , under the assumption that photon–gluon fusion to a pair is the underlying partonic process for open charm production, which is equivalent to a LO QCD approach. The result is at an average gluon momentum fraction, and at a scale . This result is compatible with our previous result from the analysis of high- hadron pairs but it is much less model dependent.
The present measurement of the gluon polarisation in the nucleon, together with other measurements of COMPASS and HERMES, all situated around , point towards a small gluon polarisation at that value of . This is a hint for a small value of the first moment, , of the gluon helicity distribution, although this in principle does not exclude a large value.
The longitudinal cross-section asymmetries were also extracted from our data and are presented in bins of the transverse momentum and the laboratory energy of the D0. They may be used to constrain the values of in future global NLO QCD analyses.
Acknowledgements
We gratefully acknowledge the support of the CERN management and staff, the special effort of CEA/Saclay for the target magnet project, as well as the skills and efforts of the technicians of the collaborating institutes.
References
- [1] V.W. Hughes, Nucl. Phys. A 518 (1990) 371 and references therein.
- [2] EMC, J. Ashman et al., Nucl. Phys. B 328 (1989) 1; Phys. Lett. B 206 (1988) 364.
- [3] E. Leader, Spin in Particle Physics, Cambridge University Press (2001).
- [4] SMC, B. Adeva et al., Phys. Rev. D 58 (1998) 112001.
- [5] COMPASS, V.Yu. Alexakhin et al., Phys. Lett. B 647 (2007) 8.
- [6] E155, P.L. Anthony et al., Phys. Lett. B 463 (1999) 339; see also list of references in [5].
- [7] HERMES, A. Airapetian et al., Phys. Rev. D 75 (2007) 012007; erratum ibid. D76 (2007) 039901.
- [8] CLAS, K.V. Dharmawardane et al., Phys. Lett. B 641 (2006) 11.
- [9] PHENIX, A. Adare et al., Phys. Rev. D 76 (2007) 051106(R).
- [10] STAR, B.I. Abelev et al., Phys. Rev. Lett. 97 (2006) 252001.
- [11] J. Ellis and R. Jaffe, Phys. Rev. 9 D (1974) 1444; ibid. 10 (1974) 1669.
- [12] S. Bass, The Spin Structure of the Proton, World Scientific Publishing (2007).
- [13] HERMES, A. Airapetian et al., Phys. Rev. Lett. 84 (2000) 2584; a smaller preliminary value from another method has been reported in P. Liebig, AIP Conf. Proc. 915 (2007) 331 (arXiv:0707.3617).
- [14] SMC, B. Adeva et al., Phys. Rev. D 70 (2004) 012002.
- [15] COMPASS, E.S. Ageev et al. Phys. Lett. B 633 (2006) 25; recently a new value from another method has been reported in M. Stolarski, Proc. of the XVIth Int. Workshop on Deep-Inelastic Scattering, Eds. R. Devenish and J. Ferrando, London (2008) (arXiv:0809.1803).
- [16] T. Sjöstrand et al., JHEP 0605 (1006) 026.
- [17] G. Ingelman et al., Comp. Phys. Comm. 101 (1997) 108.
- [18] EMC, J.J. Aubert et al., Nucl. Phys. B 213 (1983) 31.
- [19] B.W. Harris et al., Nucl. Phys. B 461 (1996) 181.
- [20] COMPASS, M. Alekseev et al., CERN-PH-EP/2008-003 (arXiv:0802.3023).
- [21] COMPASS, P. Abbon et al., Nucl. Instrum. Meth. A 577 (2007) 455.
- [22] N. Doble et al., Nucl. Instrum. Meth. A 343 (1994) 351.
- [23] COMPASS, E.S. Ageev et al., Phys. Lett. B 612 (2005) 154.
- [24] COMPASS, V.Yu. Alexakhin et al., Phys. Lett. B 647 (2007) 330.
- [25] J. Pretz and J.M. Le Goff, Nucl. Instrum. Meth. A 602 (2009) 594 (arXiv:0811.1426).
- [26] For details see: J. Pretz, habilitation thesis, University of Bonn, Mathematisch-Naturwissenschaftliche Fakultät, April 2007.
-
[27]
G. Ingelman et al.,
Comput. Phys. Commun. 101 (1997) 135;
see http://www.isv.uu.se/thep/aroma/ for recent updates. - [28] R. Sulej et al., Meas. Sci. Technol. 18 (2007) 2486.
- [29] F. Robinet, PhD thesis (Saclay), Univ. Paris Diderot (Paris 7), UFR de Physique, September 2008.