A relativistically smeared spectrum in the neutron star X-ray Binary 4U 1705–44: Looking at the inner accretion disc with X-ray spectroscopy
Abstract
Iron emission lines at keV, identified with fluorescent K transitions, are among the strongest discrete features in the X-ray band. These are therefore one of the most powerful probes to infer the properties of the plasma in the innermost part of the accretion disc around a compact object. In this paper we present a recent XMM-Newton observation of the X-ray burster 4U 1705–44, where we clearly detect a relativistically smeared iron line at about 6.7 keV, testifying with high statistical significance that the line profile is distorted by high velocity motion in the accretion disc. As expected from disc reflection models, we also find a significant absorption edge at about 8.3 keV; this feature appears to be smeared, and is compatible with being produced in the same region where the iron line is produced. From the line profile we derive the physical parameters of the inner accretion disc with large precision. The line is identified with the K transition of highly ionised iron, Fe XXV, the inner disc radius is (where is the Gravitational radius, ), the emissivity dependence from the disc radius is , the inclination angle with respect to the line of sight is . Finally, the XMM-Newton spectrum shows evidences of other low-energy emission lines, which again appear broad and their profiles are compatible with being produced in the same region where the iron line is produced.
keywords:
line: formation — line: identification — stars: neutron — stars: individual: 4U 1705–44 — X-ray: general — X-ray: binaries1 Introduction
Emission lines at keV are the strongest discrete features in the X-ray band, and indeed appear to be ubiquitous in all kind of accreting compact objects. These have been observed in Active Galactic Nuclei (AGN, see e.g. Tanaka et al. 1995; Fabian et al. 2002, and references therein), in X-ray binaries containing stellar mass black holes (see e.g. Miller et al. 2002; Miller et al. 2004) as well as in X-ray binaries containing a low magnetised neutron star (LMXBs, see e.g. Bhattacharyya & Strohmayer 2007; Cackett et al. 2008; Pandel et al. 2008; D’Aí et al. 2009). These lines are therefore a powerful tool to exploit the physical properties of the emitting region that in most cases is quite close to the compact object. The line profile often appears very smeared and asymmetric, with red wings extending down to 3 keV or even less. In most (if not all) cases this profile has been ascribed to the Doppler and relativistic effects caused by the high Keplerian velocities in the accretion disc which extends deeply in the gravitational potential well of the compact object.
In fact (see Matt 2006 for a review, and references therein), if an emission line is produced in an accretion disc, which is illuminated by the main Comptonised continuum coming from a corona, the high velocities in the disc produce a double peaked line profile: the blue-shifted peak arising from matter approaching the observer and the red-shifted peak from matter receding. The separation in frequency between these two peaks depends on the line-of-sight velocity difference, which in turn depends on the inclination of the disc and on the radius where the emission occurs. At small radii the Keplerian velocities become relativistic, and this causes that the intensity of the blue peak apparently exceeds that of the red peak because of Doppler boosting. Finally, for very small radii, the Gravitational redshift becomes important and the entire profile may be shifted to lower energies (see Fabian et al. 1989 and Laor 1991 for detailed modelling of these profiles).
Although compelling evidence can been found in literature that iron line profiles often appear broad and asymmetric, and important diagnostics of the emitting region have been inferred (see e.g. Reynolds, Brenneman, & Garofalo 2005 as a review), alternative explanations for the line broadening have been suggested. In fact, it is also possible to obtain broad and asymmetric profiles by Comptonisation of line photons in a medium of moderate optical depth and temperature of a few keV (e.g. Kallman & White 1989; Brandt & Matt 1994; Misra & Kembhavi 1998; Rozanska & Madej 2008; see, however, Reynolds & Wilms 2000 for a discussion of the case of MCG–6–30–15) or with other kind of non-thermal Comptonisation (Laurent & Titarchuk 2007); complex absorption may also mimic a very broad relativistic profile (Miller et al. 2008). Even if the relativistic disc line is often the most convincing solution, it is clear that more direct and unambiguous evidences would be highly desirable.
In this paper we present a high statistics and well resolved disc line profile in a LMXB containing a neutron star, together with other identified broad emission features and an iron absorption edge compatible with coming from the same disc region. We are therefore able to find the disc parameters with unprecedented precision.
2 Observation and Results
4U 1705–44 is a LMXB containing a neutron star. It shows type I bursts and the typical aperiodic variability usually observed for LMXBs of the atoll class (Olive, Barret, & Gierlinski 2003). Similarly to X-ray binaries containing black holes, this source shows regularly state transitions: from a high/soft state, where the X-ray spectrum is dominated by soft spectral components with typical temperatures less than a few keV, to low/hard states where the X-ray spectrum is dominated by a hard thermal Comptonisation (e.g. Barret & Olive 2002; Piraino et al. 2007). A Chandra High Energy Transmission Grating (HETG) observation of this source performed in 2001 (when the source was in a soft state) revealed the presence of a broad iron line at keV which was well fitted by a diskline profile (Di Salvo et al. 2005). However, the diskline profile gave an equally good fit as using a simple Gaussian profile, the double peaked profile was not resolved in the Chandra/HETG spectrum, and hence we could not exclude other possible origins for the broad iron line profile. The relativistic nature of the iron line profile in 4U 1705–44 has been very recently confirmed by a Suzaku observation; the inferred inner radius of the disc was , while the inclination of the system with respect to the line of sight resulted to be (Reis, Fabian, & Young 2009).
In order to unambiguously resolve the line profile, we obtained a dedicated XMM-Newton observation of this source that was performed in August 2006. However, XMM-Newton caught the source during a hard state, and the line was observed to be much weaker than during the Chandra observation (these results will be presented in a forthcoming paper). We therefore asked for a Target of Opportunity observation with XMM-Newton in order to observe the source during a soft state. The ToO trigger was a source count rate higher than 10 c/s observed by the All Sky Monitor (ASM) on board RXTE. This last observation was performed on August 24th 2008 (when the ASM count rate was about 20 c/s) for a total exposure time of about 45 ks. In this paper we present the spectral analysis of the data from this last XMM-Newton observation.
The EPIC–pn camera was operated in timing mode, to prevent photon pile-up and to allow an analysis of the coherent and aperiodic timing behaviour of the source. The EPIC–MOS cameras were switched off during the observation in order to allocate as much telemetry as possible to the pn, and the Reflection Grating Spectrometer (RGS) was operated in the standard spectroscopy mode. Since we are interested here in a study of the iron line profile at keV, we focus our study only on EPIC–pn data. Data were extracted and reduced using SAS v.8.0.0. We produced a calibrated EPIC–pn event list through the epproc pipeline. We extracted the source spectrum selecting a 13 pixels wide stripe around the source position equivalent to (which should encircle more than of the energy up to 9 keV111see XMM-Newton Users handbook, issue 2.6, available at http://xmm.esac.esa.int/external/xmm_user_support.), and considered only PATTERN4 and FLAG=0 events as a standard procedure to eliminate spurious events. The background spectrum was extracted from a region of the pn field of view as far as possible from the source position.
For spectral analysis the EPIC–pn energy channels were grouped by a factor of four in order to avoid an oversampling of the energy resolution bin of the instrument. The X-ray spectral package we use to model the observed emission is HEASARC XSPEC v.12.3.0.
The average count rate during our observation of 4U 1705–44 was 767 c/s in the whole pn energy range. This is below the maximum count rate to avoid deteriorated response due to photon pile-up for pn observations in timing mode, that is 800 c/s as reported in the XMM-Newton user handbook. However, in order to check that pile-up does not significantly affect the pn spectrum, we have also extracted the pn spectrum excluding the contributions from the central brightest pixels in order to minimise the pile-up effect. Results from the two spectral sets are perfectly consistent with each other, and we therefore decided to proceed using the spectrum with the highest signal-to-noise ratio.
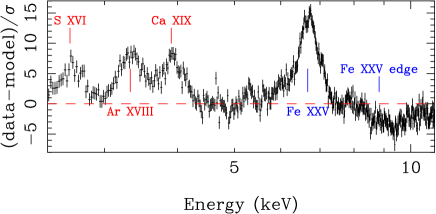
We started to fit the continuum in the pn 2.4–11 keV energy range with the typical model used for neutron star LMXBs of the atoll class, which revealed to be the best fit continuum for this source too (see e.g. Di Salvo et al. 2005; Piraino et al. 2007; Barret & Olive 2002), that is a blackbody and a thermal Comptonised component modelled by comptt (Titarchuk 1994), modified at low energy by photoelectric absorption modelled by phabs in XSPEC. This continuum model gave, however, an unacceptable fit, corresponding to a for the presence of evident localised residuals in the whole pn range. The most prominent is a clear iron line profile at energies from 5.5 to 7.5 keV at more than from the best fit continuum (see Fig. 1).
| Parameter | Value |
|---|---|
| ( cm-2) | |
| (keV) | |
| LBB () | |
| RBB (km) | |
| (keV) | |
| (keV) | |
| Flux ( ergs cm-2 s-1) | |
| total (dof) |
| Parameter | Value | Identification |
|---|---|---|
| (Rest Frame Energy) | ||
| (keV) | S XVI | |
| ( ph cm-2 s-1) | (2.6227 keV) | |
| EqW (eV) | ||
| (keV) | Ar XVIII | |
| ( ph cm-2 s-1) | (3.323 keV) | |
| EqW (eV) | ||
| (keV) | Ca XIX | |
| ( ph cm-2 s-1) | (3.88–3.90 keV) | |
| EqW (eV) | ||
| (keV) | Fe XXV | |
| ( ph cm-2 s-1) | (6.67–6.7 keV) | |
| EqW (eV) | ||
| () | ||
| () | ||
| Incl (deg) | ||
| (keV) | Fe XXV | |
| () | (8.828 keV) | |
| Smearing Width (keV) |
In order to fit these residuals we added to our continuum model Gaussian emission lines at keV (S XVI), keV (Ar XVIII), keV (Ca XIX), and keV (Fe XXV), respectively. This gave a great improvement of the fit, corresponding to a . All these lines appear to be significantly broader than the pn energy resolution, with their Gaussian going from 120 eV for S XVI to 160 eV for Ar XVIII, to 170 eV for Ca XIX, and to 260 eV for Fe XXV, respectively. Note that a relatively broad ( eV) emission feature at keV and compatible with the Ly transition of S XVI was already significantly detected in the Chandra/HETG spectrum of this source (Di Salvo et al. 2005). The fit is further improved if we add an absorption edge at 8.47 keV, most probably caused by photoelectric absorption of Fe XXV (this fit gives ).
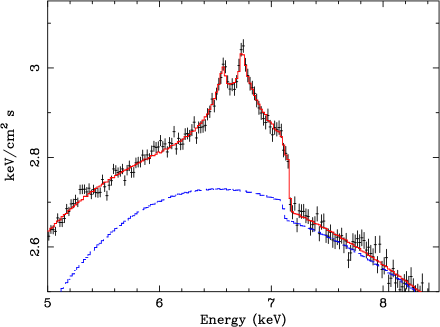
Since the iron line profile visible in the residuals shown in Figure 1 clearly suggests a double peaked shape, typical of a relativistically smeared line produced by reflection of the primary Comptonisation spectrum from an accretion disc, we substitute the Gaussian at 6.7 keV with a diskline profile, obtaining again a significant improvement of the fit (, corresponding to a for the addition of three parameters). All the diskline parameters appear very well determined by the fit, and their best-fit values do not depend from the particular choice of the continuum model. The widths of the other Gaussian lines are also quite large, eV, suggesting that these lines may also be affected by Doppler and relativistic distortions. To prove this hypothesis, we hence substitute these Gaussian lines with disklines, with all the parameters fixed at those of the iron diskline, and we just fitted the line centroid energy and the normalisation of these components. In this way we obtain an equally good fit, with a (note that the is higher but we have now 3 free parameters less with respect to the fit with Gaussian lines). We note that, although the uncertainties obtained from the fit are very small (less than 1% on the line energies), the rest-frame energies we obtain for all these low-energy lines are perfectly compatible with the rest-frame energies of the strongest expected transitions in the pn (2.4–10 keV) range (see Table 2). Moreover, from the line rest-frame energies we can infer that lighter elements (S and Ar) are in a H-like configuration, while heavier elements (Ca and Fe) are in a He-like configuration. This suggests a ionisation parameter of , where is defined as , where is the ionising X-ray luminosity, the density in the reflector, and the distance with respect to the emitting central sources.

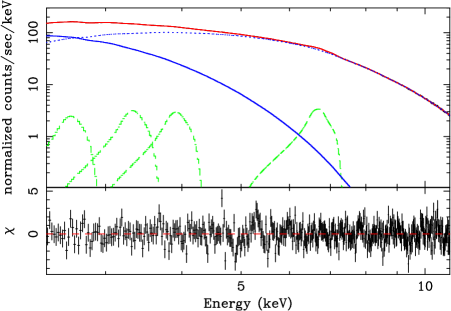
The fit is further improved if we substitute the absorption edge at 8.47 keV with a smeared edge, obtaining a final . This corresponds to a for the addition of 1 parameter; an F-test would give a probability of that the addition of the smearing improves the fit by chance. The best fit parameters are reported in Table 1 (continuum) and Table 2 (discrete features), respectively; data and residuals, in units of , are shown in Fig. 2. In Fig. 3 we show the unfolded spectrum of the source.
Finally, to check the statistical significance of the diskline profile for the iron emission line, we have substituted the diskline with a Gaussian in order to compare the corresponding s. In this case, the increases from using a diskline profile to using a Gaussian profile for the iron line. The diskline gives a better fit, with a for the addition of 3 parameters (an F-test would give a probability of chance improvement of the fit of ). We also exclude that the observed line profile may be a combination of several lines from iron in different ionisation states (as suggested by Pandel et al. 2008 for the case of 4U 1636–536). In fact, using two Gaussian profiles to describe the iron emission line, we find a which is worse than what we obtain using just one diskline profile. Moreover, the Gaussian centroid energies are not easily explained in terms of blending of different iron lines, since the strongest Gaussian peaks at keV, while the other Gaussian (much weaker than the first one) is centred at keV and tries to fit the red peak of the line profile. Fixing this line energy to keV (or using two diskline profiles at 6.4 keV and 6.7 keV, respectively, instead of Gaussians) does not improve the fit.
3 Discussion
The iron K line at keV is one of the most important diagnostic tools in X-ray spectra of accreting black holes. In particular, if the line is produced in the innermost part of the accretion disc, the line profile is distorted by Doppler effects caused by the fast Keplerian motion and relativistic effects caused by the distorted space-time very close to the compact object. These effects produce characteristic smeared and asymmetric profiles, from which we can derive essential information on the physical parameters of the accretion disc close to the compact object. The same physics should apply to X-ray binaries containing a low-magnetised neutron star, since the geometry of the accretion flow close to the central compact object is very similar. Indeed, compelling evidences have been found that iron line profiles in neutron star LMXBs are smeared by relativistic effects in the inner accretion disc. The first clear example was the XMM-Newton spectrum of atoll source Ser X–1 (Bhattacharyya & Strohmayer 2007), where the fit of the line profile with a Laor model was statistically preferred with respect to a simple Gaussian model. The relativistic nature of the iron line profile in Ser X–1 was also confirmed by a Suzaku observation (Cackett et al. 2008). Cackett et al. (2008) also detect relativistic iron line profiles in Suzaku observations of the Z-source GX 349+2 (see also Iaria et al. 2009) and the atoll source 4U 1820–30. A relativistic line profile is also observed in an XMM-Newton observation of the Z-source GX 340+0 (D’Aí et al. 2009) and in the atoll source and accreting millisecond pulsar SAX J1808.4–3658 (Papitto et al. 2009; Cackett et al. 2009). A broad iron line profile is also observed in the XMM-Newton observation of the bright atoll 4U 1636–536 (Pandel et al. 2008); in this case the authors suggest that the broad line should be interpreted as a blending of several lines from iron in different ionisation states. Finally, the presence of a relativistic iron line profile in Chandra data of the atoll source 4U 1705–44 was suggested by Di Salvo et al. (2005) and recently confirmed by Suzaku observations of this source (Reis et al. 2009).
In this paper we have presented a high quality spectrum of the LMXB and atoll source 4U 1705–44 acquired by XMM-Newton during a soft state. We have shown that this spectrum is well described by a coherent disc-reflection scenario, confirming with the highest statistics so far that the broadening mechanism is due to Doppler and relativistic effects at the inner edge of an accretion disc. The high statistics of the XMM-Newton/pn spectrum allows us to determine the best fit parameters with unprecedented precision. The parameters of the continuum are in good agreement with previous results (e.g. Piraino et al. 2007). The presence of several emission lines and an absorption edge from highly ionised elements (the most abundant emitters in the pn range) testifies the presence of a highly ionised matter in the reflector. We have estimated a not-extreme value of the ionisation parameter, , compatible with the presence of H-like S and Ar and He-like Ca and Fe.
The iron line profile clearly shows the signature of a disc origin. The rest-frame energy, keV, is compatible with the K transition of He-like iron (Fe XXV, resonance or intercombination line), testifying that the reflecting matter is highly ionised. The line appears to be produced from (where is the Gravitational radius and it is 1.5 km for a neutron star) to . The inner radius of the disc therefore results to be km, where is the neutron star mass in units of . Note that, for reasonable values of the neutron star mass, this measure clearly indicate that the disc is truncated significantly far from the neutron star surface. Interestingly the radius of the soft blackbody emission, that we identify (in agreement with Piraino et al. 2007) with optically thick emission from the accretion disc, gives a radius of km, calculated under the simple hypothesis of spherical emission and for a distance to the source of 7.4 kpc (Haberl & Titarchuk 1995). Despite the uncertainties in the emission geometry and distance to the source, the coincidence between the inner radius of the disc as calculated from the diskline and from the blackbody emission, is at least compelling. This is the first time to our knowledge that such a large consistency is found among all the spectral components in a neutron star LMXB. The power law dependence of the disc emissivity, , is parametrised by the index which is , indicating that the disc emission is dominated by irradiation by a central source (see Fabian et al. 1989). Finally, the disc inclination with respect to the line of sight is also well determined, degrees.
Signatures of a disc reflection origin are present not only in the iron line profile, but also in the entire spectrum, and in particular in the discrete features present at soft X-rays. These are produced by the most abundant elements in the pn band, again highly ionised (H or He-like elements). In particular we find emission features from S XVI, Ar XVIII, and Ca XIX, respectively, and all of them appear quite broad, with a FWHM which steadily increases with line energy, as expected in the hypothesis of Doppler broadening. Fitting these lines with disklines, where we fix the emissivity index, the inner and outer disc radii, and the inclination angle to the corresponding values of the iron diskline profile, we obtain an equally good fit, indicating that these lines are compatible with being produced in the same region where the iron line is produced.
As expected, the iron absorption edge from Fe XXV is also detected in the spectrum. However, it also appears to be smeared (with a width of about 0.7 keV) and at an energy of keV, which appears to be significantly redshifted with respect to the rest-frame energy of 8.828 keV (according to the HULLAC code value) by . A smeared and redshifted edge is also in agreement with the hypothesis that this feature is produced in the inner accretion disc. For instance, in the hypothesis that this redshift is explained by gravitational redshift, the relation between the observed energy and the rest-frame energy may be written as , where , from which we can derive the (averaged) radius of the emitting region, , that is very close in radius to the region where the iron diskline is produced.
In conclusion, the extraordinary high quality XMM-Newton spectrum of 4U 1705–44 can be considered as a testbed for testing and developing high resolution reflection models. Attempts to fit this spectrum with available reflection models (see e.g. Ross & Fabian 2005 which consider reflection models from highly ionised media) are in progress; the results are already good and will be published in a forthcoming paper. However, none of the reflection models available to date include all the features we observe in this spectrum; in particular emission lines from Ar and Ca are still missing. Developing self-consistent and complete reflection models appears to be a very important task in view of the future, high resolution, X-ray missions, since with these spectra we are really looking at the innermost accretion disc.
We thank all the XMM-Newton team, and in particular Matteo Guainazzi, for supporting this ToO observation.
References
- (1) D. Barret and J.-F. Olive, ApJ 576, 391 (2002)
- (2) S. Bhattacharyya and T. E. Strohmayer, ApJ 664, L103 (2007)
- (3) W. M. Brandt and G. Matt, MNRAS 268, 1051 (1994)
- (4) E. M. Cackett, J. M. Miller, S. Bhattacharyya, et al. ApJ 674, 415 (2008)
- (5) E. M. Cackett, D. Altamirano, A. Patruno, et al. ApJ 694, L21 (2009)
- (6) A. D’Aí R. Iaria, T. Di Salvo, G. Matt, N. R. Robba, ApJ 693, L1 (2009)
- (7) T. Di Salvo, R. Iaria, M. Mendez, L. Burderi, G. Lavagetto, N. R. Robba, L. Stella, M. van der Klis, ApJ, 623, L121 (2005)
- (8) G. W. Drake, CaJPh 66, 586 (1988)
- (9) A. C. Fabian, S. Vaughan, K. Nandra, et al., MNRAS 335, L1 (2002)
- (10) A. C. Fabian, M. J. Rees, L. Stella, N. E. White, MNRAS, 238, 729 (1989)
- (11) F. Haberl and L. Titarchuk, A&A 299, 414 (1995)
- (12) R. Iaria, A. D’Aí, T. Di Salvo, N. R. Robba, A. Riggio, A. Papitto, L. Burderi, A&A, in press (arXiv:0906.3716)
- (13) T. Kallman and N. E. White, ApJ 341, 955 (1989)
- (14) A. Laor, ApJ 376, 90 (1991)
- (15) P. Laurent and L. Titarchuk, ApJ 656, 1056 (2007)
- (16) G. Matt, AN 327, 949 (2006)
- (17) J. M. Miller, A. C. Fabian, C. S. Reynolds, et al., ApJ 606, L131 (2004)
- (18) J. M. Miller, A. C. Fabian, R. Wijnands, et al., ApJ 570, L69 (2002)
- (19) L. Miller, T.J. Turner, J.N. Reeves, A&A 483, 437 (2008)
- (20) R. Misra and A. K. Kembhavi, ApJ 499, 205 (1998)
- (21) J.-F. Olive, D. Barret, M. Gierlinski, ApJ 583, 416 (2003)
- (22) D. Pandel, P. Kaaret, S. Corbel, ApJ 688, 1288 (2008)
- (23) A. Papitto, T. Di Salvo, A. D’Aí, R. Iaria, L. Burderi, A. Riggio, M. T. Menna, N. R. Robba, A&A 493, L39 (2009)
- (24) S. Piraino, A. Santangelo, T. Di Salvo, P. Kaaret, D. Horns, R. Iaria, L. Burderi, A&A 471, L17 (2007)
- (25) R. C. Reis, A. C. Fabian, A. J. Young, MNRAS accepted (arXiv:0904.2747)
- (26) C. S. Reynolds, L. W. Brenneman, and D. Garofalo, Ap&SS 300, 71 (2005)
- (27) C. S. Reynolds and J. Wilms, ApJ 533, 821 (2000)
- (28) R. R. Ross and A. C. Fabian, MNRAS 358, 211 (2005)
- (29) A. Rozanska and J. Madej, MNRAS 386, 1872 (2008)
- (30) Y. Tanaka, K. Nandra, A. C. Fabian, et al., Nature 375, 659 (1995)
- (31) L. Titarchuk, ApJ 429, 340 (1994)