The ACS LCID Project. I. Short-Period Variables
in the
Isolated Dwarf Spheroidal Galaxies Cetus & Tucana11affiliation: Based on observations made with the NASA/ESA Hubble Space
Telescope, obtained at the Space Telescope Science Institute, which is
operated by the Association of Universities for Research in Astronomy,
Inc., under NASA contract NAS5-26555. These observations are associated
with program 10505.
Abstract
We present the first study of the variable star populations in the isolated dwarf spheroidal galaxies (dSph) Cetus and Tucana. Based on Hubble Space Telescope images obtained with the Advanced Camera for Surveys in the F475W and F814W bands, we identified 180 and 371 variables in Cetus and Tucana, respectively. The vast majority are RR Lyrae stars. In Cetus we also found three anomalous Cepheids, four candidate binaries and one candidate long-period variable (LPV), while six anomalous Cepheids and seven LPV candidates were found in Tucana. Of the RR Lyrae stars, 147 were identified as fundamental mode (RR) and only eight as first-overtone mode (RR) in Cetus, with mean periods of 0.614 and 0.363 day, respectively. In Tucana we found 216 RR and 82 RR giving mean periods of 0.604 and 0.353 day. These values place both galaxies in the so-called Oosterhoff Gap, as is generally the case for dSph. We calculated the distance modulus to both galaxies using different approaches based on the properties of RR and RR, namely the luminosity-metallicity and period-luminosity-metallicity relations, and found values in excellent agreement with previous estimates using independent methods: (mM)0,Cet=24.460.12 and (mM)0,Tuc=24.740.12, corresponding to 78040 kpc and 89050 kpc. We also found numerous RR Lyrae variables pulsating in both modes simultaneously (RR): 17 in Cetus and 60 in Tucana. Tucana is, after Fornax, the second dSph in which such a large fraction of RR (17%) has been observed. We provide the photometry and pulsation parameters for all the variables, and compare the latter with values from the literature for well-studied dSph of the Local Group and Galactic globular clusters.
The parallel WFPC2 fields were also searched for variables, as they lie well within the tidal radius of Cetus, and at its limit in the case of Tucana. No variables were found in the latter, while 15 were discovered in the outer field of Cetus (11 RR, 3 RR and 1 RR), even though the lower signal-to-noise ratio of the observations did not allow us to measure their periods accurately. We provide their coordinates and approximate properties for completeness.
Subject headings:
galaxies: dwarf — galaxies: individual (Cetus, Tucana) — stars: horizontal-branch — stars: variables: other — Local Group1. Introduction
Pulsating variable stars play a major role in the study of stellar populations and in cosmology, as their pulsational properties are traditionally used to determine distances and to put constraints on stellar physical properties. Because the pulsations occur at a particular phase of their evolution depending on the star mass, variable stars trace the spatial distribution of stellar populations of given ages, therefore highlighting the eventual radial trends across the studied galaxy (e.g., Gallart et al., 2004). In addition, variations in the pulsational properties between individual stars of a particular type can trace subtle differences in the age and metallicity of the corresponding population (e.g., Bernard et al., 2008, hereafter Paper I).
To date, all adequate searches for RR Lyrae stars in dwarf galaxies have been successful, including some newly discovered ultra-faint Milky Way (MW) satellites (e.g., Boötes I, Canes Venatici I and II; Dall’Ora et al., 2006; Siegel, 2006; Kuehn et al., 2008; Greco et al., 2008), satellites of M31 (Pritzl et al., 2005, and references therein) and isolated dwarfs (e.g., IC 1613, LGS 3; Dolphin et al., 2001; Bernard et al., 2007), independent of the galaxy morphological type. Their omnipresence, together with the wealth of information they can provide about their parent galaxies, makes the RR Lyrae stars one of the best probe to the properties of the old populations. In particular, in the case of isolated galaxies which were not disturbed by interactions with massive galaxies, they represent a window to the processes of galaxy formation and to the internal mechanisms affecting their early evolution.
With the goal of understanding these processes, we are carrying out a large project (LCID121212Local Cosmology from Isolated Dwarfs: http://www.iac.es/project/LCID/.) aiming at reconstructing the full star formation history of a sample of isolated dwarf galaxies of the Local Group (LG), based on very deep, multi-epoch Hubble Space Telescope (HST) ACS data. The sample includes representatives of the three main morphological types—irregular, spheroidal and so-called transition dIrr/dSph—located further than about two virial radii from both the MW and M31. The project is described in more detail in a companion paper (Gallart et al. 2009, in preparation), and the first results concerning the star formation history (SFH) of Leo A were presented in Cole et al. (2007).
In the first paper of this series dedicated to the study of variable stars (Paper I), we reported on the detection of old population gradients in the dSph galaxy Tucana from the properties of its RR Lyrae stars. In the present paper, we focus our attention on the global population of variable stars in the two most isolated dwarf spheroidal galaxies known to date in the LG, namely Tucana and Cetus. An in-depth analysis of the properties of these variables and a comparison with the properties of the variables in the other galaxies of the LCID sample will be presented in a forthcoming paper.
| Date | UT Start | MHJDaaModified Heliocentric Julian Date of mid-exposure: HJD2,400,000. | Filter | Exp. Time |
|---|---|---|---|---|
| 2006 Aug 28 | 11:32:20 | 53975.493956 | F475W | 1280 |
| 2006 Aug 28 | 11:56:35 | 53975.509789 | F814W | 1135 |
| 2006 Aug 28 | 13:06:18 | 53975.559326 | F475W | 1300 |
| 2006 Aug 28 | 13:30:53 | 53975.575449 | F814W | 1137 |
| 2006 Aug 28 | 14:44:46 | 53975.627590 | F475W | 1280 |
| 2006 Aug 28 | 15:09:01 | 53975.643585 | F814W | 1135 |
| 2006 Aug 28 | 16:18:10 | 53975.692566 | F475W | 1300 |
| 2006 Aug 28 | 16:42:45 | 53975.708689 | F814W | 1137 |
| 2006 Aug 28 | 17:56:22 | 53975.760645 | F475W | 1280 |
| 2006 Aug 28 | 18:20:37 | 53975.776480 | F814W | 1135 |
| 2006 Aug 28 | 19:31:50 | 53975.827057 | F475W | 1300 |
| 2006 Aug 28 | 19:56:25 | 53975.843180 | F814W | 1137 |
| 2006 Aug 29 | 01:55:57 | 53976.093689 | F475W | 1280 |
| 2006 Aug 29 | 02:20:13 | 53976.109696 | F814W | 1135 |
| 2006 Aug 29 | 03:30:37 | 53976.159545 | F475W | 1300 |
| 2006 Aug 29 | 03:55:13 | 53976.175679 | F814W | 1137 |
| 2006 Aug 29 | 05:07:47 | 53976.226906 | F475W | 1280 |
| 2006 Aug 29 | 05:32:02 | 53976.242901 | F814W | 1135 |
| 2006 Aug 29 | 06:42:26 | 53976.292751 | F475W | 1300 |
| 2006 Aug 29 | 07:07:01 | 53976.308874 | F814W | 1137 |
| 2006 Aug 29 | 08:19:38 | 53976.360135 | F475W | 1280 |
| 2006 Aug 29 | 08:43:53 | 53976.376130 | F814W | 1135 |
| 2006 Aug 29 | 09:54:16 | 53976.425968 | F475W | 1300 |
| 2006 Aug 29 | 10:18:51 | 53976.442091 | F814W | 1137 |
| 2006 Aug 29 | 11:31:29 | 53976.493364 | F475W | 1280 |
| 2006 Aug 29 | 11:55:44 | 53976.509359 | F814W | 1135 |
| 2006 Aug 29 | 13:06:05 | 53976.559174 | F475W | 1300 |
| 2006 Aug 29 | 13:30:40 | 53976.575141 | F814W | 1137 |
| 2006 Aug 29 | 16:19:15 | 53976.693202 | F475W | 1280 |
| 2006 Aug 29 | 16:43:30 | 53976.709197 | F814W | 1135 |
| 2006 Aug 29 | 17:53:48 | 53976.758977 | F475W | 1300 |
| 2006 Aug 29 | 18:18:23 | 53976.775100 | F814W | 1137 |
| 2006 Aug 30 | 05:07:08 | 53977.226453 | F475W | 1280 |
| 2006 Aug 30 | 05:31:23 | 53977.242449 | F814W | 1135 |
| 2006 Aug 30 | 06:41:04 | 53977.291800 | F475W | 1300 |
| 2006 Aug 30 | 07:05:39 | 53977.307772 | F814W | 1137 |
| 2006 Aug 30 | 08:18:58 | 53977.359671 | F475W | 1280 |
| 2006 Aug 30 | 08:43:12 | 53977.375654 | F814W | 1135 |
| 2006 Aug 30 | 09:52:52 | 53977.424995 | F475W | 1300 |
| 2006 Aug 30 | 10:17:26 | 53977.441106 | F814W | 1137 |
| 2006 Aug 30 | 11:31:22 | 53977.493281 | F475W | 1280 |
| 2006 Aug 30 | 11:55:37 | 53977.509127 | F814W | 1135 |
| 2006 Aug 30 | 13:04:41 | 53977.558200 | F475W | 1300 |
| 2006 Aug 30 | 13:29:16 | 53977.574323 | F814W | 1137 |
| 2006 Aug 30 | 14:43:03 | 53977.626395 | F475W | 1280 |
| 2006 Aug 30 | 15:07:18 | 53977.642390 | F814W | 1135 |
| 2006 Aug 30 | 16:16:30 | 53977.691406 | F475W | 1300 |
| 2006 Aug 30 | 16:41:05 | 53977.707529 | F814W | 1137 |
| 2006 Aug 30 | 17:52:27 | 53977.758154 | F475W | 1320 |
| 2006 Aug 30 | 18:17:22 | 53977.774276 | F814W | 1117 |


Tucana was discovered as a likely LG dwarf spheroidal by Lavery (1990) based on resolved star CCD photometry. Later observations by Lavery & Mighell (1992) confirmed its membership, who gave an upper limit on the distance modulus of 24.75, and yielded [Fe/H]=1.9 from the mean metallicity-luminosity relation of the dwarf spheroidals of the LG. However, the color of the red giant branch (RGB) in deeper photometry from ground-based (Castellani et al., 1996) and HST WFPC2 (Lavery et al., 1996) data indicate a metallicity as high as [Fe/H]=1.6. In addition, Castellani et al. (1996) estimated a metallicity spread of [Fe/H]0.54 from the observed dispersion in color of the RGB, while Harbeck et al. (2001) found a metallicity gradient as well as a bimodal [Fe/H] distribution using the horizontal branch (HB) morphology and the color of individual RGB stars, respectively. The hypothesis of multiple old populations in Tucana was strengthened in Paper I from the pulsational properties of its RR Lyrae stars.
Cetus was discovered by Whiting et al. (1999) upon visual inspection of southern sky survey plates. From follow-up observations, the authors derived a distance based on the tip of the RGB (TRGB) of =24.45 0.15, and [Fe/H]=1.9 0.2 from the color of the RGB. As in the case of Tucana, the color of the RGB from HST WFPC2 data gives a slightly more metal rich population with [Fe/H]=1.7, and an intrinsic internal abundance dispersion of 0.2 dex (Sarajedini et al., 2002).
Because of their large distances from the MW, Cetus and Tucana have not previously been searched for variable stars, although the presence of RR Lyrae stars was suggested from the extension of the HB to the blue in both galaxies. Castellani et al. (1996) reported the detection of three candidate long-period variables (LPV) near the TRGB of Tucana from their frame-to-frame photometric variations but no period search was attempted.
In this paper we present the first in-depth analysis of the variable stars in Cetus and Tucana. A summary of the observations and data reduction is presented in section 2, while § 3 and § 4 deal with the identification of variable stars and their completeness, respectively. In section 5 we describe the sample of RR Lyrae stars at hand, and use their properties to estimate the distance of both galaxies in the following section. The remaining variables are presented in sections 7 and 8. In the last section we discuss the results in the more general context of the properties of dwarf galaxies in the LG, and present our conclusions.
2. Observations and Data Reduction
2.1. Primary ACS Imaging
The present analysis is based on observations obtained with the ACS onboard the HST. As the goal of these observations was to reach the oldest main sequence turn-offs with good signal-to-noise on the final photometry (S/N10 at M), we required 25 and 32 HST orbits for Cetus and Tucana, respectively. These were collected over about 2.5 and 5 consecutive days, between 2006 August 28 and 30 for Cetus and 2006 April 25 and 30 for Tucana. The observing sequence consisted of alternating 1100 seconds exposures in F475W and F814W for an optimal sampling of the light curves. The complete observing logs for Cetus and Tucana are given in Tables 1 and 2, respectively.
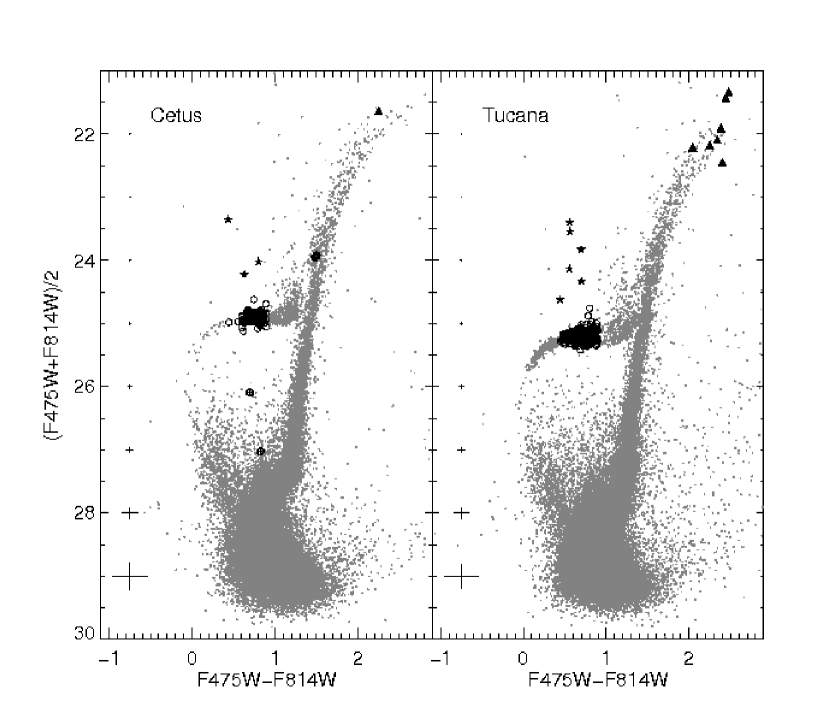
The DAOPHOT/ALLFRAME suite of programs (Stetson, 1994) was used to obtain the instrumental photometry of the stars on the individual, non-drizzled images provided by the HST pipeline (the _FLT set). This pipeline carries out standard pre-reduction, including bias and dark subtraction, removal of the overscan regions, and flat fielding. Additionally, we used the pixel area maps and data quality masks to correct for the variations of the pixel areas on the sky around the field and to flag bad pixels. Standard calibration was carried out as described in Sirianni et al. (2005), taking into account the updated zero-points of Mack et al. (2007) following the lowering of the Wide Field Channel temperature setpoint in July 2006. An in-depth description of the observations, data reduction and calibration, as well as results from extensive artificial star tests, are given in a companion paper (M. Monelli et al. 2009, in preparation). The final color-magnitude diagrams (CMDs) are shown in Fig. 1, where the filter combination was chosen for the ordinate axis so that the HB appears approximately horizontal.
| Date | UT Start | MHJDaaModified Heliocentric Julian Date of mid-exposure: HJD2,400,000. | Filter | Exp. Time |
|---|---|---|---|---|
| 2006 Apr 25 | 20:08:05 | 53850.848412 | F475W | 1070 |
| 2006 Apr 25 | 20:28:50 | 53850.862163 | F814W | 957 |
| 2006 Apr 25 | 21:42:13 | 53850.913900 | F475W | 1090 |
| 2006 Apr 25 | 22:03:18 | 53850.927894 | F814W | 979 |
| 2006 Apr 26 | 15:18:28 | 53851.647309 | F475W | 1070 |
| 2006 Apr 26 | 15:39:13 | 53851.661059 | F814W | 957 |
| 2006 Apr 26 | 16:52:34 | 53851.712773 | F475W | 1090 |
| 2006 Apr 26 | 17:13:39 | 53851.726767 | F814W | 979 |
| 2006 Apr 26 | 18:30:11 | 53851.780449 | F475W | 1070 |
| 2006 Apr 26 | 18:50:56 | 53851.794199 | F814W | 957 |
| 2006 Apr 26 | 20:04:17 | 53851.845913 | F475W | 1090 |
| 2006 Apr 26 | 20:25:22 | 53851.859907 | F814W | 979 |
| 2006 Apr 26 | 21:41:55 | 53851.913600 | F475W | 1070 |
| 2006 Apr 26 | 22:02:40 | 53851.927350 | F814W | 957 |
| 2006 Apr 26 | 23:16:00 | 53851.979053 | F475W | 1090 |
| 2006 Apr 26 | 23:37:05 | 53851.993046 | F814W | 979 |
| 2006 Apr 27 | 15:16:23 | 53852.645886 | F475W | 1070 |
| 2006 Apr 27 | 15:37:08 | 53852.661751 | F814W | 957 |
| 2006 Apr 27 | 16:50:29 | 53852.711350 | F475W | 1090 |
| 2006 Apr 27 | 17:11:34 | 53852.725344 | F814W | 979 |
| 2006 Apr 27 | 18:28:06 | 53852.779025 | F475W | 1070 |
| 2006 Apr 27 | 18:48:51 | 53852.792776 | F814W | 957 |
| 2006 Apr 27 | 20:02:11 | 53852.844478 | F475W | 1090 |
| 2006 Apr 27 | 20:23:16 | 53852.858472 | F814W | 979 |
| 2006 Apr 27 | 21:39:50 | 53852.912177 | F475W | 1070 |
| 2006 Apr 27 | 22:00:35 | 53852.925927 | F814W | 957 |
| 2006 Apr 27 | 23:13:55 | 53852.977630 | F475W | 1090 |
| 2006 Apr 27 | 23:35:00 | 53852.993727 | F814W | 979 |
| 2006 Apr 28 | 15:14:18 | 53853.644462 | F475W | 1070 |
| 2006 Apr 28 | 15:35:03 | 53853.660295 | F814W | 957 |
| 2006 Apr 28 | 16:48:20 | 53853.709880 | F475W | 1090 |
| 2006 Apr 28 | 17:09:25 | 53853.723874 | F814W | 979 |
| 2006 Apr 28 | 18:26:01 | 53853.777602 | F475W | 1070 |
| 2006 Apr 28 | 18:46:46 | 53853.791352 | F814W | 957 |
| 2006 Apr 28 | 20:00:03 | 53853.843020 | F475W | 1090 |
| 2006 Apr 28 | 20:21:08 | 53853.857013 | F814W | 979 |
| 2006 Apr 28 | 21:37:42 | 53853.910718 | F475W | 1070 |
| 2006 Apr 28 | 21:58:27 | 53853.924469 | F814W | 957 |
| 2006 Apr 28 | 23:11:45 | 53853.976148 | F475W | 1090 |
| 2006 Apr 28 | 23:32:50 | 53853.990141 | F814W | 979 |
| 2006 Apr 29 | 13:36:18 | 53854.576428 | F475W | 1070 |
| 2006 Apr 29 | 13:57:03 | 53854.592231 | F814W | 957 |
| 2006 Apr 29 | 15:10:18 | 53854.641823 | F475W | 1090 |
| 2006 Apr 29 | 15:31:23 | 53854.655816 | F814W | 979 |
| 2006 Apr 29 | 16:48:00 | 53854.709556 | F475W | 1070 |
| 2006 Apr 29 | 17:08:45 | 53854.723306 | F814W | 957 |
| 2006 Apr 29 | 18:22:00 | 53854.774951 | F475W | 1090 |
| 2006 Apr 29 | 18:43:05 | 53854.788944 | F814W | 979 |
| 2006 Apr 29 | 19:59:42 | 53854.842684 | F475W | 1070 |
| 2006 Apr 29 | 20:20:27 | 53854.856434 | F814W | 957 |
| 2006 Apr 29 | 21:33:43 | 53854.908090 | F475W | 1090 |
| 2006 Apr 29 | 21:54:48 | 53854.922084 | F814W | 979 |
| 2006 Apr 30 | 13:34:06 | 53855.574923 | F475W | 1070 |
| 2006 Apr 30 | 13:54:51 | 53855.588673 | F814W | 957 |
| 2006 Apr 30 | 15:08:04 | 53855.640294 | F475W | 1090 |
| 2006 Apr 30 | 15:29:09 | 53855.654288 | F814W | 979 |
| 2006 Apr 30 | 16:45:48 | 53855.708050 | F475W | 1070 |
| 2006 Apr 30 | 17:06:33 | 53855.721801 | F814W | 957 |
| 2006 Apr 30 | 18:19:45 | 53855.773411 | F475W | 1090 |
| 2006 Apr 30 | 18:40:50 | 53855.787404 | F814W | 979 |
| 2006 Apr 30 | 19:57:30 | 53855.841178 | F475W | 1070 |
| 2006 Apr 30 | 20:18:15 | 53855.854929 | F814W | 957 |
| 2006 Apr 30 | 21:31:27 | 53855.906539 | F475W | 1090 |
| 2006 Apr 30 | 21:52:32 | 53855.920532 | F814W | 979 |
The F475W and F814W magnitudes were transformed to Johnson to allow comparison with observations of variable stars in globular clusters and other galaxies reported in the literature. Given the large difference between these two photometric systems, the transformation was limited to the variable stars confined in the instability strip (IS), as their intermediate color and narrow temperature range minimized the difficulties related to extreme temperatures. To that purpose, we used our HST observations of NGC 6341 (M92), in which we found about 200 stars in common with Stetson’s photometric standards in this cluster (Stetson, 2000). Using linear regression, the transformation equations were determined to be:
The transformations were then applied to our HST M92 data through an iterative process as described in Sirianni et al. (2005), with the color terms being in the target photometric system. Figure 2 shows the residuals between our HST ‘V’ photometry and Stetson’s standard V photometry, which have a median value of 0.001 and a standard deviation of 0.034. We obtain transformations of similar quality for the B and I bands, with median values of 0.004 and 0.002, and standard deviations of 0.032 and 0.030, respectively. The contribution of these transformations to the uncertainty of the individual magnitudes is therefore negligible (0.002).
Since pulsating variable stars undergo changes in effective temperature over the course of the pulsation cycle in addition to the changes in radius, their color varies accordingly. Thus, it is necessary to transform each phase point individually, taking into account the color of the star at that moment. This ‘instantaneous color’ was obtained by using the consecutive F475W and F814W exposures observed within a single orbit.
2.2. Parallel WFPC2 Imaging
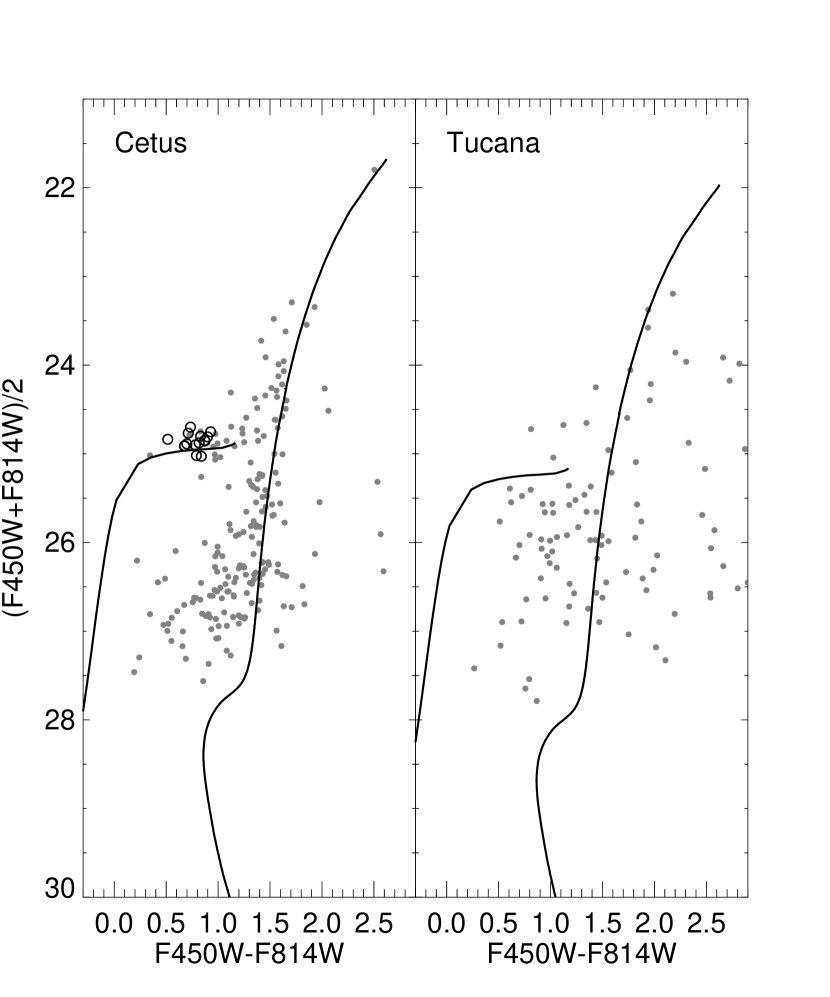
These galaxies were also observed with the WFPC2 in the F450W and F814W bands as parallel exposures to the primary ACS observations, therefore providing the same number of observations with a similar exposure time in a second field in each galaxy. When preparing the observations, the orientation of the ACS field was chosen such that the parallel WFPC2 field would sample the outer regions of each galaxy of our sample.
The images from the Wide Field chips were reduced individually as described in Turner (1997). On the other hand, we did not perform the photometry of the individual Planetary Camera (PC) images since they contain very few stars, and the large number of cosmic ray residuals prevented obtaining a reasonable registration. Instead, the photometry of the PC was performed on the averaged F450W and F814W images. The location of the stars from this chip on the CMDs indicates that no bright variables are expected (see below).
The resulting photometry was calibrated to the flight system following the instructions from the HST Data Handbook for WFPC2.131313http://www.stsci.edu/instruments/wfpc2/Wfpc2_dhb/wfpc2_ ch52.html


Due to the lower sensitivity of the instrument with respect to the ACS, together with the smaller field of view and the peripheric location in the galaxies, very few stars were found in each field. The CMDs for both galaxies are shown in Fig. 3, where the isochrones and zero-age HB from the BaSTI library (Pietrinferni et al., 2004) have been overplotted. For Cetus, we used =0.123 and =0.056 (Schlegel et al., 1998) for the F450W and F814W bands, respectively, with an assumed dereddened distance modulus of 24.46 (see Section 6.3). For Tucana, the BaSTI models were shifted assuming =0.135, =0.061, and (mM)0=24.74 (Section 6.3). Figure 3 shows that the CMD of the parallel WFPC2 field in Cetus is about 2.5 mag shallower than the ACS CMD, although it still presents a conspicuous RGB, and a red HB is visible. On the other hand, as expected from the much smaller tidal radius, less than a hundred objects were detected in Tucana, and the CMD does not present any recognizable features.
| MHJDaaModified Heliocentric Julian Date of mid-exposure: HJD2,400,000. | MHJDaaModified Heliocentric Julian Date of mid-exposure: HJD2,400,000. | ||||
|---|---|---|---|---|---|
| V001 | |||||
| 53975.493956 | 25.065 | 0.031 | 53975.509789 | 24.339 | 0.035 |
| 53975.559326 | 25.206 | 0.036 | 53975.575449 | 24.400 | 0.048 |
| 53975.627590 | 25.388 | 0.039 | 53975.643585 | 24.433 | 0.124 |
| 53975.692566 | 25.454 | 0.044 | 53975.708689 | 24.299 | 0.099 |
| 53975.760645 | 25.510 | 0.034 | 53975.776480 | 24.543 | 0.044 |
Note. — Table 3 is published in its entirety in the electronic edition of the Astrophysical Journal. A portion is shown here for guidance regarding its form and content.
| MHJDaaModified Heliocentric Julian Date of mid-exposure: HJD2,400,000. | MHJDaaModified Heliocentric Julian Date of mid-exposure: HJD2,400,000. | ||||
|---|---|---|---|---|---|
| V001 | |||||
| 53851.647309 | 25.990 | 0.065 | 53851.661059 | 25.232 | 0.053 |
| 53851.712773 | 26.005 | 0.037 | 53851.726767 | 25.186 | 0.055 |
| 53851.780449 | 25.420 | 0.045 | 53851.794199 | 24.935 | 0.047 |
| 53851.845913 | 25.157 | 0.045 | 53851.859907 | 24.823 | 0.059 |
| 53851.913600 | 25.508 | 0.053 | 53851.927350 | 24.859 | 0.052 |
Note. — Table 4 is published in its entirety in the electronic edition of the Astrophysical Journal. A portion is shown here for guidance regarding its form and content.
| MHJDaaModified Heliocentric Julian Date of mid-exposure: HJD2,400,000. | MHJDaaModified Heliocentric Julian Date of mid-exposure: HJD2,400,000. | MHJDaaModified Heliocentric Julian Date of mid-exposure: HJD2,400,000. | ||||||
|---|---|---|---|---|---|---|---|---|
| V001 | ||||||||
| 53975.493956 | 25.171 | 0.031 | 53975.501872 | 24.816 | 0.031 | 53975.509789 | 24.320 | 0.035 |
| 53975.559326 | 25.327 | 0.036 | 53975.567387 | 24.929 | 0.036 | 53975.575449 | 24.382 | 0.048 |
| 53975.627590 | 25.541 | 0.039 | 53975.635588 | 25.061 | 0.039 | 53975.643585 | 24.421 | 0.124 |
| 53975.692566 | 25.653 | 0.044 | 53975.700628 | 25.062 | 0.044 | 53975.708689 | 24.299 | 0.099 |
| 53975.760645 | 25.665 | 0.034 | 53975.768563 | 25.179 | 0.034 | 53975.776480 | 24.531 | 0.044 |
Note. — Table 5 is published in its entirety in the electronic edition of the Astrophysical Journal. A portion is shown here for guidance regarding its form and content.
| MHJDaaModified Heliocentric Julian Date of mid-exposure: HJD2,400,000. | MHJDaaModified Heliocentric Julian Date of mid-exposure: HJD2,400,000. | MHJDaaModified Heliocentric Julian Date of mid-exposure: HJD2,400,000. | ||||||
|---|---|---|---|---|---|---|---|---|
| V001 | ||||||||
| 53851.647309 | 26.102 | 0.065 | 53851.654184 | 25.730 | 0.065 | 53851.661059 | 25.214 | 0.053 |
| 53851.712773 | 26.129 | 0.037 | 53851.719770 | 25.723 | 0.037 | 53851.726767 | 25.169 | 0.055 |
| 53851.780449 | 25.485 | 0.045 | 53851.787324 | 25.257 | 0.045 | 53851.794199 | 24.920 | 0.047 |
| 53851.845913 | 25.200 | 0.045 | 53851.852910 | 25.049 | 0.045 | 53851.859907 | 24.816 | 0.059 |
| 53851.913600 | 25.600 | 0.053 | 53851.920475 | 25.286 | 0.053 | 53851.927350 | 24.840 | 0.052 |
Note. — Table 6 is published in its entirety in the electronic edition of the Astrophysical Journal. A portion is shown here for guidance regarding its form and content.
3. Identification of Variable Stars
The candidate variables were extracted from the ACS photometry using the Welch-Stetson variability index (Welch & Stetson, 1993), which makes optimal use of our alternating F475W and F814W measurements by employing the correlation in brightness change in paired frames. This process yielded 379 and 565 candidates in the primary field of Cetus and Tucana, respectively. A preliminary check of the light-curve and position on the CMD, together with a careful inspection of the stacked image, allowed us to discard false detections due to cosmic-ray hits, chip defects or stars located under the wings of bright stars.
The period search was first performed on the suspected variables through both Fourier analysis following the prescription of Horne & Baliunas (1986), and the phase-dispersion minimization algorithm (Stellingwerf, 1978), both methods taking into account the information from both bands simultaneously. As both methods were giving very similar periods, the former was chosen over the latter for its swiftness. For each variable, datapoints with error bars larger than 3- above the mean error bar size were rejected through sigma clipping with five iterations. As the period-finding program is interactive, it was possible to selectively reject more or less datapoints depending on the light curve quality before recalculating the periodogram. Except in a few particular cases (e.g., when a variable was located close to a bad column or on the border of a chip, thus yielding several very discrepant datapoints, i.e., V39 and V135 in Cetus; V51, V80, and V137 in Tucana), we found that the period-search was not affected by a few bad points. The periods were then refined by hand upon visual inspection of the light curves in both bands simultaneously. Given the short timebase of the observations (6 days), the periods are given with three significant figures only. The accuracy of period evaluations was estimated from the degradation of the quality of the light-curves when applying small offsets. It mainly depends on the period itself and on the time interval covered by observations, and ranges from about 0.001 day for the shorter period RR Lyrae stars to few hundredths of a day for the longest period Cepheids in Cetus. We ended up with 180 variables in Cetus and 371 in Tucana. These are shown in Fig. 1 overplotted on the CMD of each galaxy using their intensity-averaged magnitudes (see below). The individual F475W and F814W measurements for all of the variables are listed in Tables 3 (Cetus) and 4 (Tucana), while Tables 5 and 6 give the transformed B, V, and I magnitudes as described above. The Julian date for the V band is simply the midpoint between consecutive F475W and F814W observations.
The classification of the candidates was based on their light-curve morphology and position in the CMD. In Cetus, we found 172 RR Lyrae stars, three above horizontal-branch variables (AHB), four candidate binaries and a candidate LPV, while in Tucana we found 358 RR Lyrae, six AHB and seven LPV candidates around the TRGB. Because of the short timebase and relatively small number of observations, no attempt was made to find a period for the binaries and LPV.
To obtain the amplitudes and intensity-averaged magnitudes of the monoperiodic variables in the IS, we fitted the light-curves with a set of templates partly based on the set of Layden et al. (1999). Two other templates—for Cepheids, one sawtooth-like and one with constant-light at minimum—were built by averaging the light-curves of ten well-measured IC 1613 Cepheids from the OGLE database (Udalski et al., 2001). On the other hand, the amplitude of the double-mode RR Lyrae stars was measured from a low-order Fourier fit to the light-curve phased with the primary period after prewhitening of the secondary period. The mean magnitude and color of the RR and candidate binaries and LPV are weighted averages, and are therefore only approximate. Tables 7 and 8 summarize the properties of the variable stars in the ACS field of each galaxy. The first and second columns give the identification number and variable type, while the next two list the equatorial coordinates (J2000.0). Columns (5) and (6) give the primary period in days, i.e., the first-overtone period in the case of the RR, and the logarithm of this period. The intensity-averaged magnitudes and , and color are given in columns (7), (9), and (11), and the amplitudes in the F475W and F814W bands measured from the template fits are listed in the eighth and tenth columns. The last six columns alternately list the intensity-averaged magnitudes and amplitudes in the Johnson B, V, and I bands. Approximate values are listed in italics.
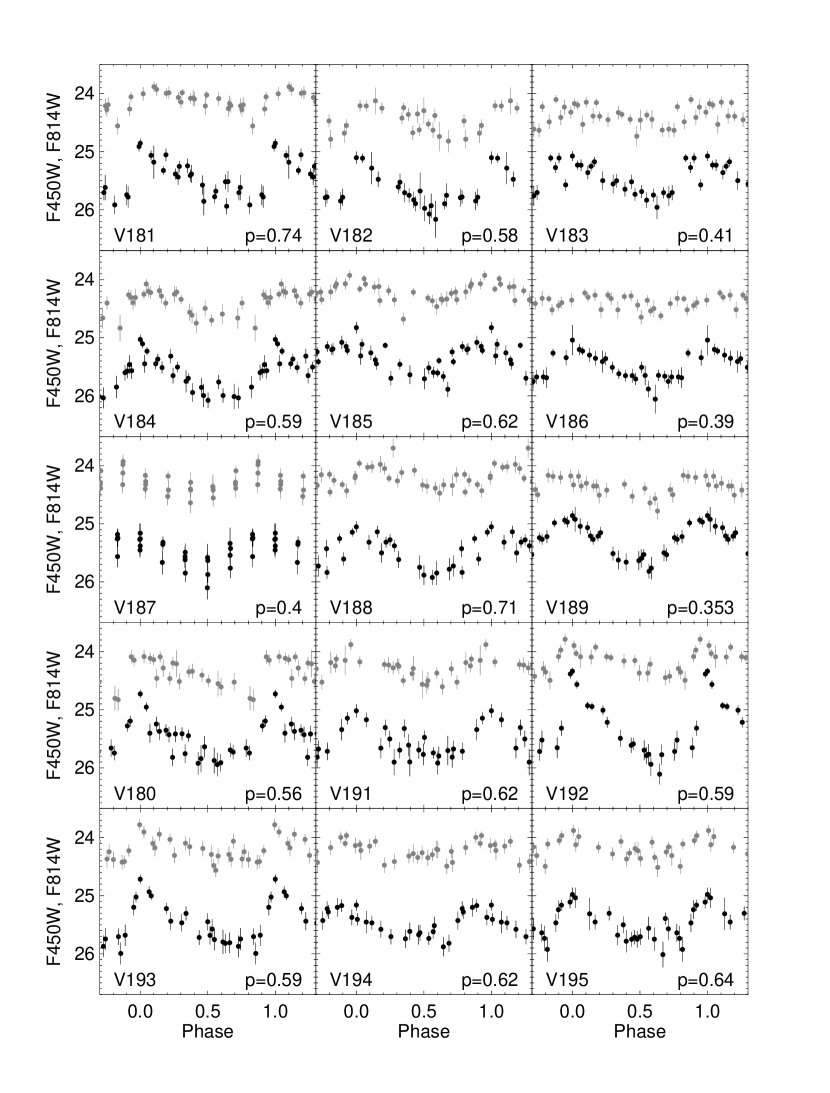
The same procedure was followed with the WFPC2 photometry of both galaxies. As expected from the appearance of the WFPC2 CMD, no candidate variables were detected in Tucana. In the outer field of Cetus, we found 15 RR Lyrae variables. However, the low signal-to-noise at the magnitude of the HB produced rather noisy light-curves, and some low amplitude variables might have been missed. Given the small number of variables in the parallel field and the generally lower quality of their photometry and inferred parameters, we only give their coordinates and approximate parameters in Table 9 for completeness. These variables will not be taken into account when calculating average properties.
4. Completeness
Given that the properties of the variable stars (e.g., , f, specific frequency of anomalous Cepheids) are often used to compare stellar systems, and that these properties can vary within a single one of these systems (see, e.g., Paper I, ), it is necessary to estimate the completeness of the sample of variable stars at hand. Incompleteness can be due to several reasons, mainly stellar crowding and signal-to-noise (SN) limitations, temporal sampling, and spatial coverage.
In this particular case, the high spatial resolution of the ACS and the depth of our data imply that incompleteness will become noticeable only well below the HB. Artificial-star tests (see M. Monelli et al. 2009, in preparation) indicate that the completeness is higher than 97% at (F475W+F814W)/2 25.5 and 26.0 for Cetus and Tucana, respectively. Therefore, down to these magnitudes only variables with amplitudes smaller than the error bars at this magnitude (0.1) might have been missed. Crowding and low SN only limit our ability to detect variables fainter than the HB, e.g., SX Phoenicis stars and binary systems. In addition, even though these variables are most likely present in both galaxies, the relatively long exposure time smoothing out the variations in luminosity and the rather slow temporal sampling precluded the detection of these short-period variables.
It is also important to estimate the completeness due to temporal sampling, since the actual time distribution of the observations can affect the detection of variables with given periods more than others. To this purpose, we carried out numerical simulations similar to those described in Bersier & Wood (2002). Basically, we simulate a large number of variable stars (one million here) with periods randomly distributed between about one hour (0.04 day) and 12 days, and random phases. Given that the period of the real stars was searched on the data from both bands simultaneously, for these tests we also combined together the observation times of both bands, which were folded according to the period and initial phase of each artificial variable star. We then counted the number of observations at given phase ranges. A variable star was considered recovered if it fulfills the following criteria: (a) at least two observations around maximum light (); (b) at least two phase points during descending light (); and (c) at least three phase points during minimum light ().
We then calculated the detection probability as a function of period as the fraction of artificial stars in period intervals of 0.001 day fulfilling the criteria given above. The result is presented in Fig. 4 and 5 for Cetus and Tucana, respectively. In the upper panel of each figure, the maximum period that is displayed is limited by the observational timebase of each galaxy, given the above criteria. Note, however, that while it is common to detect variables with periods longer than the time-span of the observations, it is not possible to determine their periods. For periods shorter than about 3.5 days, one can see that the spectrum of each galaxy displays similar features. These are due to the observational strategy, constrained by the orbital period of the HST. For example, the minimum on the lower panel of each figure at period 0.065 day corresponds to the shortest time between two consecutive images of the same band.
The main difference appears on the spectrum of Tucana at P1 day, and is the consequence of the location of Tucana in the sky, together with the presence of the South-Atlantic Anomaly (SAA). The SAME ORIENT requirement did not allow these observations to be scheduled at times when the passages of HST through the SAA could be hidden within the target’s Earth occultations. This, in turn, forced to clump the observations together at roughly the same time of the day each day. Cetus, on the other hand, was not affected by the SAA and has no ‘blind’ period.
Note that these detection probabilities should be taken as a lower limit, since several variables were observed that do not fulfill one (or more) of the above criteria (e.g., V134 in Cetus, V125 in Tucana), or variables that have periods longer than 12 days (candidate LPV in both galaxies). Moreover, variables with periods of about one day would most likely be Cepheids. In Tucana, there are very few stars in the IS above the HB, and any variable with amplitude greater than the error bars at a given magnitude would be detected. Removing the second criteria (in itself not necessary to detect a variable) also effectively removes the blind period of Tucana at P1 day; the minimum probability at P=0.97 day rises to 0.2. In any case, for both galaxies the probability to detect a variable star in the period range of RR Lyrae stars ( 0.2–0.8 day) is basically one.
| R.A. | Decl. | Period | ||||||||||||||
|---|---|---|---|---|---|---|---|---|---|---|---|---|---|---|---|---|
| ID | Type | (J2000) | (J2000) | (days) | log P | |||||||||||
| V001 | 00 26 02.73 | 11 03 40.6 | 0.664 | 0.178 | 25.308 | 0.624 | 24.465 | 0.354 | 0.844 | 25.438 | 0.683 | 25.023 | 0.562 | 24.450 | 0.378 | |
| V002 | 00 26 02.77 | 11 03 53.2 | 0.386 | 0.413 | 25.281 | 0.828 | 24.571 | 0.509 | 0.710 | 25.379 | 0.911 | 25.045 | 0.671 | 24.555 | 0.507 | |
| V003 | 00 26 02.84 | 11 04 36.3 | 0.591 | 0.228 | 25.317 | 1.150 | 24.533 | 0.600 | 0.783 | 25.431 | 1.264 | 25.059 | 0.841 | 24.516 | 0.610 | |
| V004 | 00 26 03.00 | 11 03 40.4 | 0.638 | 0.195 | 25.343 | 0.569 | 24.493 | 0.274 | 0.849 | 25.473 | 0.641 | 25.055 | 0.475 | 24.478 | 0.281 | |
| V005 | 00 26 03.07 | 11 06 08.2 | 0.601 | 0.221 | 25.343 | 1.069 | 24.568 | 0.468 | 0.775 | 25.459 | 1.186 | 25.083 | 0.857 | 24.556 | 0.466 |
Note. — Table 7 is published in its entirety in the electronic edition of the Astrophysical Journal. A portion is shown here for guidance regarding its form and content.
| R.A. | Decl. | Period | ||||||||||||||
|---|---|---|---|---|---|---|---|---|---|---|---|---|---|---|---|---|
| ID | Type | (J2000) | (J2000) | (days) | log P | A814 | ||||||||||
| V001 | 22 41 30.84 | 64 24 47.8 | 0.370 | 0.432 | 25.651 | 0.958 | 24.972 | 0.523 | 0.679 | 25.749 | 1.058 | 25.429 | 0.757 | 24.955 | 0.513 | |
| V002 | 22 41 31.70 | 64 25 01.7 | 0.341 | 0.467 | 25.599 | 0.650 | 24.992 | 0.321 | 0.607 | 25.689 | 0.717 | 25.389 | 0.523 | 24.976 | 0.318 | |
| V003 | 22 41 32.00 | 64 24 57.2 | 0.627 | 0.203 | 25.495 | 1.089 | 24.769 | 0.469 | 0.727 | 25.620 | 1.132 | 25.222 | 1.001 | 24.751 | 0.472 | |
| V004 | 22 41 33.05 | 64 25 31.9 | 0.372 | 0.429 | 25.556 | 0.528 | 24.888 | 0.308 | 0.667 | 25.653 | 0.559 | 25.325 | 0.462 | 24.870 | 0.325 | |
| V005 | 22 41 33.74 | 64 25 04.2 | 0.543 | 0.265 | 25.613 | 1.359 | 24.939 | 0.684 | 0.674 | 25.725 | 1.464 | 25.364 | 1.152 | 24.923 | 0.684 |
Note. — Table 8 is published in its entirety in the electronic edition of the Astrophysical Journal. A portion is shown here for guidance regarding its form and content.
| R.A. | Decl. | Period | ||||||||
|---|---|---|---|---|---|---|---|---|---|---|
| ID | Type | (J2000) | (J2000) | (days) | log P | |||||
| V181 | 00 25 48.36 | 11 01 35.6 | 0.74 | 0.13 | 25.216 | 24.288 | 0.928 | 0.950 | 0.329 | |
| V182 | 00 25 50.89 | 11 00 57.8 | 0.58 | 0.24 | 25.415 | 24.624 | 0.792 | 0.866 | 0.497 | |
| V183 | 00 25 51.15 | 11 00 56.2 | 0.41 | 0.39 | 25.238 | 24.539 | 0.700 | 0.625 | 0.317 | |
| V184 | 00 25 51.34 | 11 01 32.7 | 0.59 | 0.23 | 25.447 | 24.609 | 0.838 | 0.921 | 0.447 | |
| V185 | 00 25 51.34 | 10 59 38.7 | 0.62 | 0.21 | 25.124 | 24.412 | 0.713 | 0.447 | 0.351 | |
| V186 | 00 25 51.42 | 11 01 07.9 | 0.39 | 0.41 | 25.252 | 24.576 | 0.676 | 0.634 | 0.202 | |
| V187 | 00 25 51.90 | 11 02 12.2 | 0.4 | 0.4 | 25.235 | 24.477 | 0.758 | 0.467 | 0.295 | |
| V188 | 00 25 52.69 | 11 01 45.2 | 0.71 | 0.15 | 25.283 | 24.413 | 0.870 | 0.729 | 0.404 | |
| V189 | 00 25 52.99 | 11 00 33.7 | 0.353 | 0.452 | 25.094 | 24.579 | 0.515 | 0.745 | 0.318 | |
| V180 | 00 25 53.67 | 11 00 43.9 | 0.56 | 0.25 | 25.247 | 24.570 | 0.677 | 1.130 | 0.635 | |
| V191 | 00 25 54.10 | 10 59 41.1 | 0.62 | 0.21 | 25.285 | 24.468 | 0.818 | 0.693 | 0.486 | |
| V192 | 00 25 55.36 | 10 59 57.3 | 0.59 | 0.23 | 25.066 | 24.332 | 0.734 | 1.531 | 0.467 | |
| V193 | 00 25 56.26 | 11 00 45.3 | 0.59 | 0.23 | 25.217 | 24.386 | 0.832 | 1.077 | 0.562 | |
| V194 | 00 25 56.54 | 11 00 19.7 | 0.62 | 0.21 | 25.292 | 24.418 | 0.874 | 0.648 | 0.345 | |
| V195 | 00 25 56.84 | 11 00 31.8 | 0.64 | 0.19 | 25.258 | 24.360 | 0.898 | 0.741 | 0.317 |
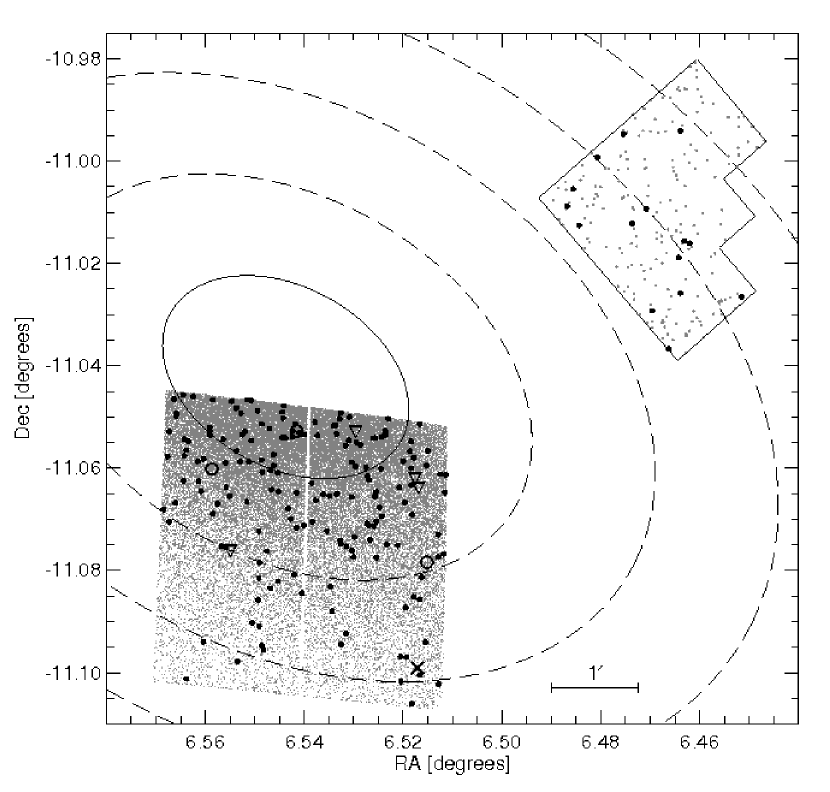
In the case of Cetus, the main factor for incompleteness is the spatial coverage, due to the off-center location of our ACS field to avoid a bright star and sample a radial region of the galaxy, and to the large extent of the galaxy. Figure 6 shows the distribution of stars in Cetus from our ACS and WFPC2 fields on top of ellipses representing the core radius (, McConnachie & Irwin, 2006) and integer multiples of the core radius. McConnachie & Irwin (2006) estimated a tidal radius of and ellipticity . Thus, the ACS field covers only about 1/300th of the area within the tidal radius. On the other hand, if we assume that the distribution of variable stars follows that of the RGB stars, we can estimate the total number of RR Lyrae stars within the tidal radius as follows. First, we adopt the shape and orientation of the isodensity contours given by McConnachie et al. (2005) to divide our sample of variable stars into three elliptical annuli containing approximately the same number of stars. To calculate the area of these annuli, we first distributed a large number of points () randomly thoughout the ACS field of view (FOV). Since the area of the FOV is known, the area of a given fraction of ellipse can be measured by counting the number of random points that it contains. We could then calculate the density profile of RR Lyrae stars. Using this profile with the core and tidal radii from McConnachie et al. (2005) as input to equation (21) of King (1962), we calculate that our ACS sample represents about 17% of the total number of RR Lyrae stars (1000).
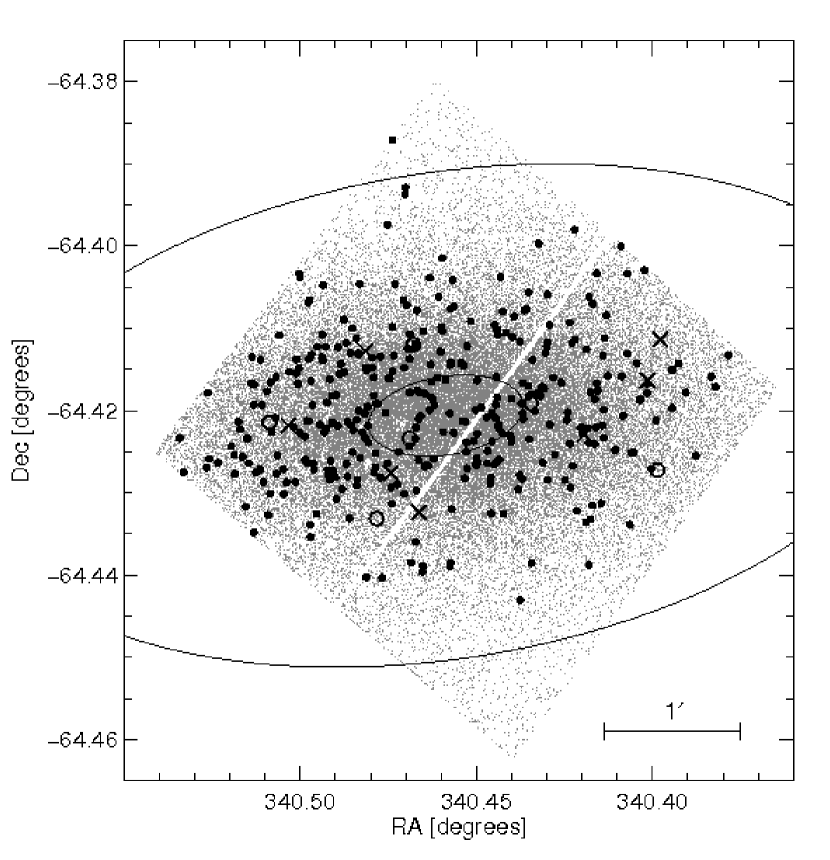
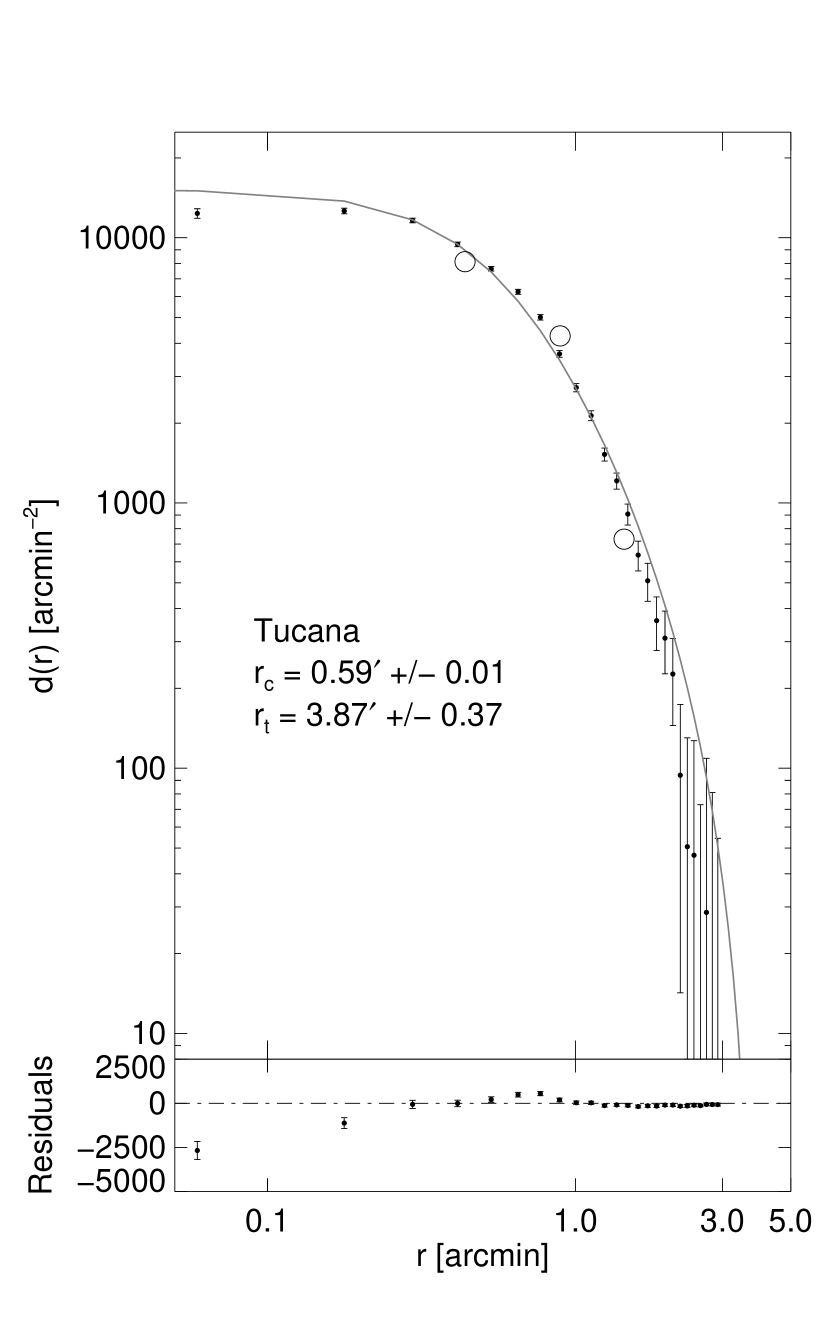
In the case of Tucana, the ACS field of view covers most of its area, so it is possible to measure its morphological parameters from our data. We first fitted ellipses to the stellar density maps. Even though the location of the center, position angle and ellipticity were left as free parameters, we found their values to be very stable, and decided to keep the average values as the best fit. We find that Tucana has an ellipticity , position angle of 3. and is centered on , . Fig. 7 shows the spatial distribution of stars. The variables and the core and tidal radii (see below) are also shown as larger dots and ellipses. We adopt the method of King (1962) to determine the core and tidal radii from the spatial distribution of stars bright than the 80% completeness limit, after correcting for completeness. This correction was obtained from the ratio of the number of recovered to injected stars in the artificial star test for each annular region. We find the best fit for and , which means that Tucana has a concentration factor similar to that of Fornax although it is 3-4 times smaller. The resulting King profile is presented in Fig. 8. Following the same method as discussed above, we calculate the density profile for the RR Lyrae stars; it is shown as large open circles in Fig. 8, shifted vertically to overlap the non-variable stars profile. This gives a total number of RR Lyrae stars in Tucana of 400, implying that 10% of the RR Lyrae variables are outside the field or in the gap between the chips.
To summarize, spatial coverage is the only factor really affecting the completeness of the sample of variable stars on and brighter than the HB, while crowding, signal-to-noise limitation, and temporal sampling prevented us from detecting fainter, shorter-period variables in both galaxies.
5. RR Lyrae stars
5.1. Fundamental & Overtone Pulsators
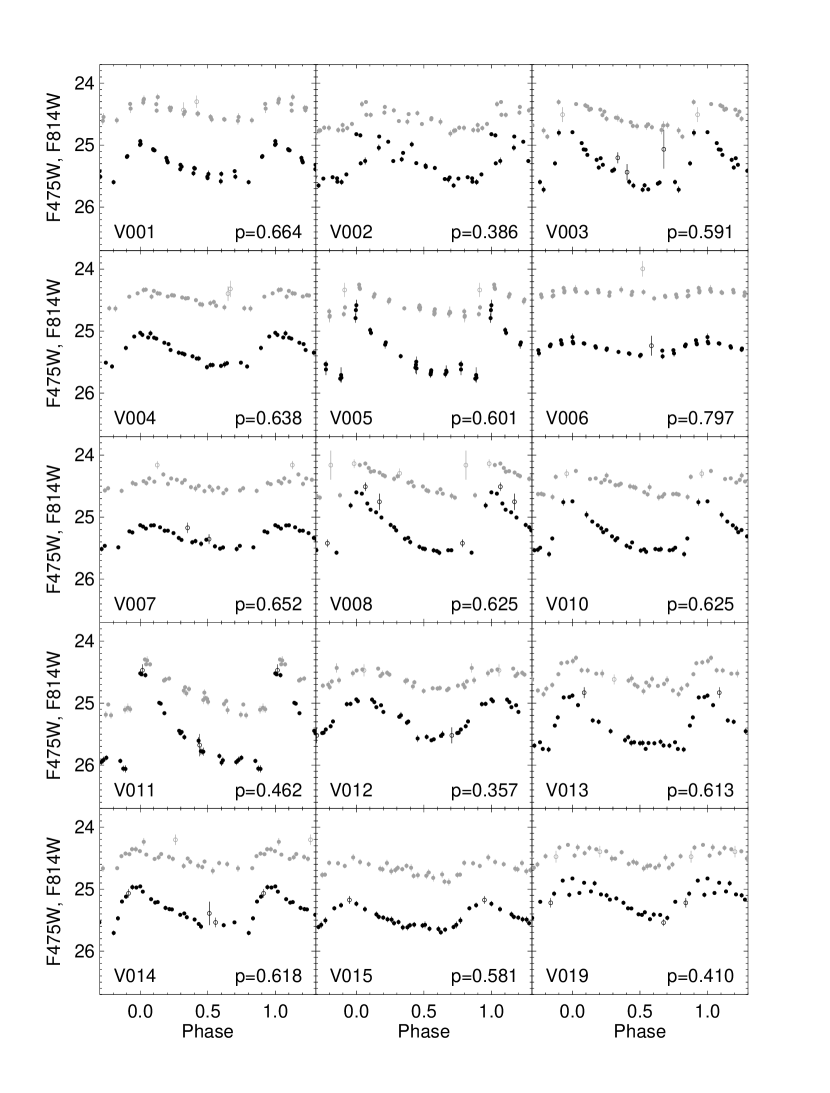
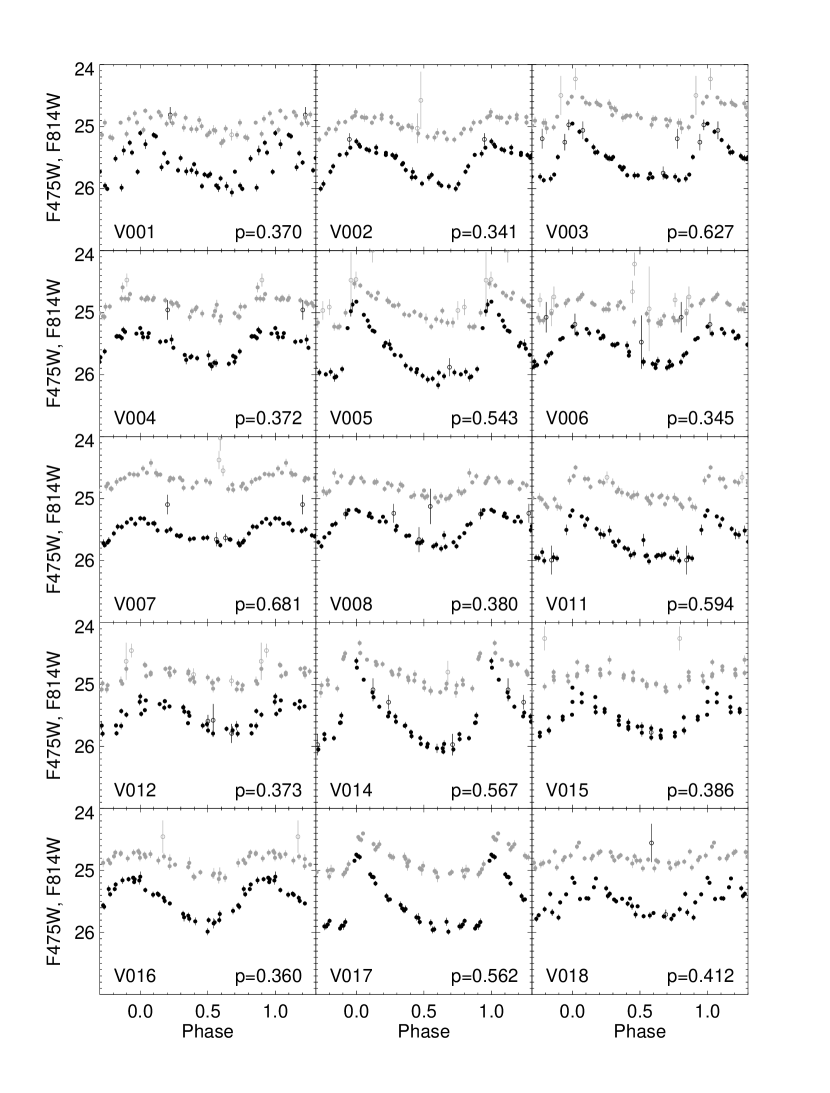
From the periods and light-curve shapes of the candidates, we identified 147 RR Lyrae stars pulsating in the fundamental mode (RR), 8 in the first-overtone mode (RR), and 17 in both modes simultaneously (RR) in our ACS field of Cetus. The WFPC2 field contains 11 RR, 3 RR, and 1 RR. For Tucana, the RR Lyrae stars were classified as 216 RR, 82 RR, and 60 RR. The light curves of all the RR Lyrae stars are shown in Fig. 9–11 for the ACS and WFPC2 samples of Cetus, and for Tucana, respectively. The RR are discussed in §5.2.
We note that a few of these RR Lyrae variables are slightly brighter or fainter than the HB in each galaxy, and are labeled in Fig. 12. While the discrepancy can usually be linked to obvious problems in the photometry (e.g., V92 and V116 in Cetus, V125 in Tucana; see Appendix A), for a few of these variables the shift in luminosity seems to be intrinsic. For example, V11 and V173 in Cetus are peculiar in the sense that they are 0.1 mag fainter and have much larger amplitude and shorter periods than the other RR stars of this galaxy (see Fig. 13 below), and may belong to a slightly more metal-rich population. V15 also appears fainter than the HB, although its period and amplitude are consistent with the majority of RR stars. V55 in Cetus, and V341 and V364 in Tucana, on the other hand, appear a few tenths of magnitude above the HB. Their location on the period-luminosity and period-amplitude (PA) diagrams discard the possibility that they are anomalous or population II Cepheids, and indicate that they are bona fide RR Lyrae stars. Their amplitude and appearance on the stacked HST images also seem to discard blends. Therefore, these RR Lyrae are most likely evolved blue horizontal-branch (BHB) stars on their way to the AGB. Even though the evolutionary time of such stars within the IS is relatively short (10 Myr), the number of BHB stars and the extension of the HB to the blue make it a viable hypothesis. In the following we assume that the few outliers described above are bona fide RR Lyrae stars.
5.1.1 Cetus
In the case of Cetus, the mean periods for the RR and RR are 0.614 and 0.363 day, respectively. This value of is close to that expected based on the mean metallicity of the galaxy ([Fe/H]=1.8; M. Monelli et al. 2009, in preparation) and the observed correlation between the mean period and the metallicity followed by the Galactic globular clusters (GGC) and the dSph of the LG (see Section 5.3). On the other hand, the fraction of RR, calculated as , is surprisingly small. Typical values for this ratio range from 0.1 to 0.5 (see § 5.3). Given the completeness at the magnitude of the HB discussed in Section 4, it seems unlikely that many RR were undetected, even more so because fainter, lower amplitude RR were observed in Tucana. However, one can see on the CMD in Fig. 12 that Cetus harbors a mainly red HB, at least in the region covered by the ACS field, having a HB ratio (HBR141414HBR = (BR)/(B+V+R), where B, V, and R are the numbers of stars to the blue, within, and to the red of the IS (Lee, 1990).) of 0.74. The hot side of the HB, which is where the RR are generally found, is therefore sparsely populated. In addition, taking into account the numerous RR yields , which is close to the typical value observed in the so-called Oosterhoff type I GCs (Oosterhoff, 1939). We recall that GGC are traditionally classified in one of the two Oosterhoff types according to the mean properties of their RR Lyrae stars: Oosterhoff type I clusters tend to have intermediate metallicity ([Fe/H]1.5), RR Lyrae with shorter periods (0.55, 0.32), and a low fraction of overtone pulsators (0.17), while Oosterhoff II clusters have low metallicity ([Fe/H]2.1), 0.64, 0.37, and 0.45 (Smith, 1995). The causes of this dichotomy is still a matter of debate (see, e.g., Catelan, 2005).

5.1.2 Tucana

For Tucana we calculated mean periods of 0.604 and 0.353 day for the RR and RR, respectively. Contrary to Cetus, however, the ratio is intermediate between the Oosterhoff types, and is a consequence of the well populated HB on both sides of the IS (see Fig. 12). Indeed, we find an average HBR of 0.14 for the whole field-of-view, indicating that there is a comparable number of stars on each side of the IS. Including the RR, we get a value close to that of the Oosterhoff type II GCs: . Another point in which Tucana significantly differs from Cetus is the distribution of periods of the RR Lyrae stars. Figure 13 shows the PA diagram of the RR Lyrae stars in Cetus (top) and Tucana (bottom). The slope of the PA relation of the RR is shallower and its dispersion much larger for the variables in Tucana than in Cetus. In Paper I, we showed that the large dispersion in the case of Tucana is partly due to the superposition of stellar populations with slightly different age and metallicities. Some of the scatter might also be introduced by the Blazhko effect (Blazhko, 1907), a modulation of the phase and amplitude of the pulsation, which can reduce the amplitude of the variations by up to half magnitude at a given period depending on the phase of the Blazhko cycles. However, it is unclear at the moment whether the difference in slope is real or a consequence of the larger dispersion.
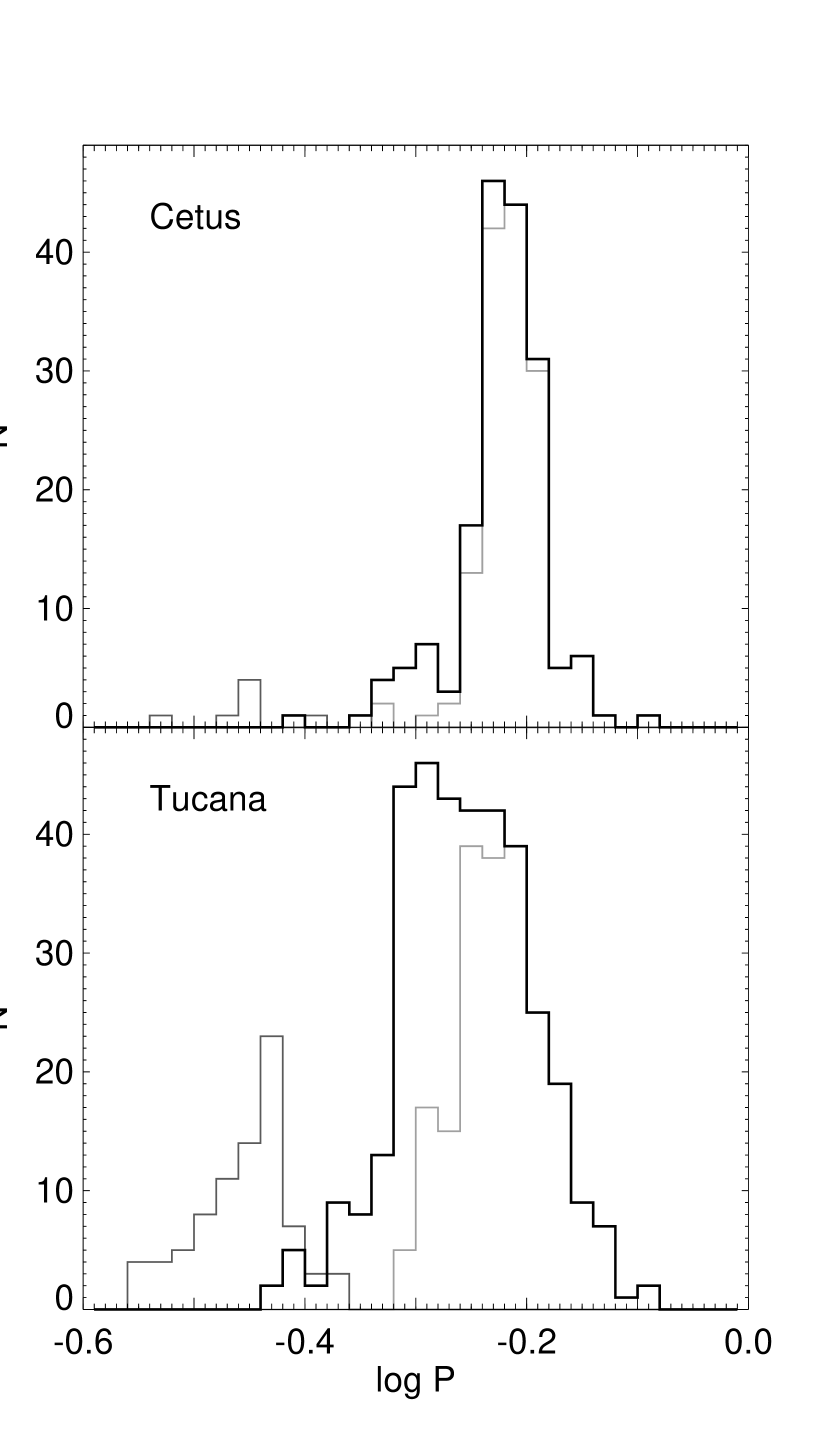
The period histograms are presented in Fig. 14. The solid histogram represents the fundamentalized RR Lyrae stars: the periods of the RR were transformed to their fundamental mode equivalents by adding 0.128 to the logarithm of their periods, while the secondary (i.e., fundamental) periods were used for the RR. The contributions of the RR and RR are shown as the light and dark gray histograms, respectively. As expected from the relatively unpopulated RR region of the HB of Cetus, together with the steepness of its RR PA relation, the period distribution is much tighter than that of Tucana.
5.2. Double-Mode Pulsators
| Galaxy | [Fe/H] | NRRLaaNumber of RR + RR + RR stars. ‘:’ denotes uncertain values. | log | fcbbf Nc/(Nab+Nc) | % RRccApproximate percentage of RR. | NACddNumber of anomalous Cepheids. | HBReeHorizontal branch morphology: HBR , with B, V, R representing the numbers of HB stars to the blue, within, and to the red of the instability strip (Lee, 1990). | References | |
|---|---|---|---|---|---|---|---|---|---|
| Cetus | 1.8 | 147+8+17 | 0.614 | 0.212 | 0.05 | 10 | 3 | 0.74 | 1 |
| Tucana | 1.8 | 216+82+60 | 0.604 | 0.219 | 0.28 | 17 | 6 | 0.14 | 1 |
| Boötes I | 2.5 | 7+7+1 | 0.69 | 0.16 | 0.5 | 7 | 0 | – | 2,3 |
| Canes Venatici I | 2.0 | 18+5 | 0.60 | 0.22 | 0.23 | – | 3 | – | 4 |
| Canes Venatici II | 2.3 | 1+1 | 0.743 | 0.129 | 0.5 | – | 0 | – | 5 |
| Carina | 1.7 | 54+15+6 | 0.631 | 0.200 | 0.22 | 8 | 15 | – | 6 |
| Coma Berenices | 2.53 | 1+1 | 0.670 | 0.174 | 0.5 | – | 0 | – | 7 |
| Draco | 2.0 | 214+30+26 | 0.615 | 0.211 | 0.12 | 10 | 9 | – | 8 |
| Fornax | 1.3 | 396+119 | 0.585 | 0.233 | 0.231 | 20 | 17 | – | 9,10 |
| Leo I | 1.82 | 47+7 | 0.602 | 0.220 | 0.13 | – | 1 | – | 11 |
| Leo II | 1.9 | 106+34+8: | 0.619 | 0.208 | 0.24 | 5 | 4 | 0.78 | 12,13 |
| Sculptor | 1.8 | 132+74+18: | 0.585 | 0.233 | 0.40 | 8 | 3 | 0.06 | 14,15,16 |
| Sextans | 1.6 | 26+7+3: | 0.606 | 0.218 | 0.21 | 8 | 6 | 0.37 | 17,16 |
| U.Minor | 2.2 | 47+35 | 0.638 | 0.195 | 0.43 | – | 7 | – | 18 |
References. — (1) This work; (2) Dall’Ora et al. 2006; (3) Siegel 2006; (4) Kuehn et al. 2008; (5) Greco et al. 2008; (6) Dall’Ora et al. 2003; (7) Musella et al. 2009; (8) Kinemuchi et al. 2008; (9) Bersier & Wood 2002; (10) Clementini et al. 2006; (11) Held et al. 2001; (12) Siegel & Majewski 2000; (13) Mighell & Rich 1996; (14) Kaluzny et al. 1995; (15) Kovács 2001; (16) Harbeck et al. 2001; (17) Mateo et al. 1995; (18) Nemec et al. 1988.
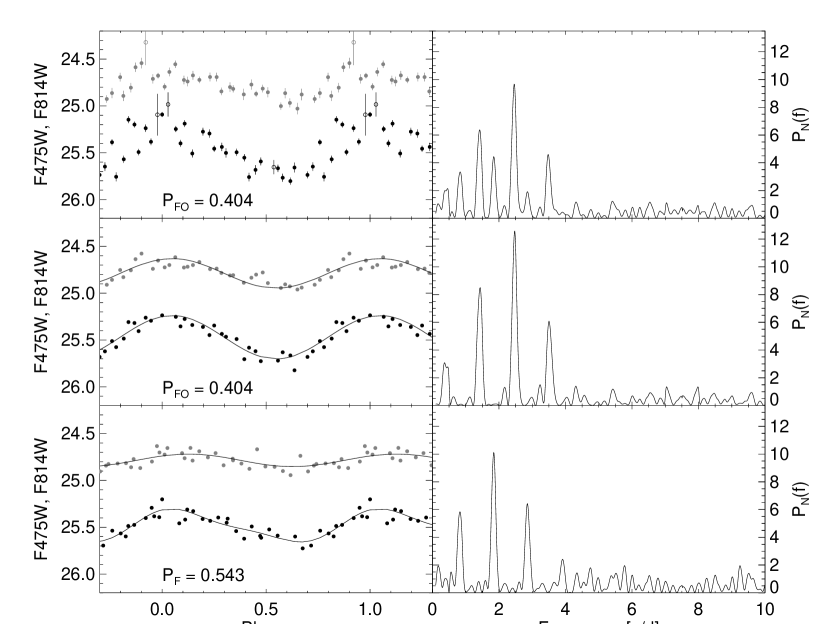
Both Cetus and Tucana were found to possess a significant number of variable HB stars having a dispersion in magnitude, once phased with the best period, much larger than the one expected from photometric errors alone. In addition, these variables are located in the central part of the IS where RR and RR overlap (see Fig. 12). The occurence of the Blazhko effect was discarded as the main contribution since the observations were collected in a time range spanning five days at maximum, while the period of the Blazhko modulations ranges typically from tens to hundreds of days. In addition, their periodograms show the characteristic double-peaks of RR variables (see Fig. 15, top right panel).


The periods of each mode were searched using an iterative process, first prewhitening the primary period to find the secondary period, then refining the primary period after prewhitening of the secondary period. In the left panels of Fig. 15 we present the F475W & F814W light-curves of a RR in Tucana: the top panel shows the light-curves without prewhitening, while the middle and bottom panels show the light-curves of the primary (secondary) period after prewhitening of the secondary (primary) period. The curves show the low-order Fourier series fit that were subtracted from the data to find the period of the other component. The periodograms corresponding to each F475W light-curve are shown in the right panels.
Because of the short timebase of our observations and the rather small number of datapoints, it was not possible to obtain very accurate periods for each pulsation mode. However, the ratio of the primary-to-secondary periods was found to be consistent with the typical range of known RR (; see, e.g., Fig. 13 of Clementini et al. (2004).
While the fraction of RR in Cetus is similar to that observed in other dSph (see Table 5.2), it is about twice as high in Tucana. Such a large fraction of double-mode pulsators has only been observed in one dSph (Fornax, 20%; Clementini et al., 2006) and in a few GGC (29% in M 68: Walker 1994; 18% in IC 4499: Walker & Nemec 1996; 15–18% in M 15: Corwin et al. 2008). No consensus has been reached yet concerning the origin of the relative abundance of RR in stellar systems, but the narrowness of the possible metallicity range (0.0002–0.001; Popielski et al., 2000), the mass range at a given metal content, and the temperature range (0.02 M☉ and T 60 K; Szabó et al., 2004) are possibly the main suspects. The fulfillment of these three conditions at the same time is probably a transient phenomenon, explaining the scarcity of stellar system with a large fraction of double-mode pulsators.
5.3. Comparison with LG dSph & GGC
In Fig. 16 and 17, we compare the average properties of the RR Lyrae stars in Cetus and Tucana with those of other LG dSph and GGC. The data for the GGC (small and large dots) come from the compilation of Clement et al. (2001), updated with values from the literature when the change in mean period, HBR, or number of variables was significant (M 2: Lee & Carney 1999, Lázaro et al. 2006; M 75: Corwin et al. 2003; NGC 2808: Corwin et al. 2004; NGC 6388 and NGC 6441: Corwin et al. 2006). However, given the lack of theoretical (e.g., Kovács, 1998; Bono et al., 1997a) and observational (Kaluzny et al., 2004) evidence supporting the existence of second-overtone RR Lyrae stars (“RR”), variables identified as such in their list were considered RR here. The open triangles represent values for the LG dSphs from the literature, which are summarized in Table 5.2.
Figure 16 shows the metallicity and HB morphology as a function of the mean period of the fundamental mode RR Lyrae stars. The peculiar GGCs NGC 6388, NGC 6441, and Cen are indicated by crosses. Note how the location of Boötes I, at =0.69 (Dall’Ora et al., 2006) and [Fe/H]=2.5 (Muñoz et al., 2006) seems to indicate that the correlation between [Fe/H] and of the Oosterhoff type I GGC (e.g., Clement et al., 2001) actually extends to the Oosterhoff II domain. Cetus and Tucana are shown as a filled square and a filled diamond, respectively. While they both follow the trend in Pab–[Fe/H] defined by the GGC, the bottom panel shows that the HB of Cetus is too red given the mean period of its RR. The only GGC with a sufficient number of RR Lyrae stars in this part of the Pab–HBR space is the peculiar GGC Rup 106, which is generally considered to be 2 Gyr younger than the other GGC (e.g., Salaris & Weiss, 1997).
On the other hand, the mean period of the RR in Tucana is close to that expected from its HB morphology. The values for the inner and outer annuli of Tucana—excluding the intermediate region for clarity—from Paper I, shown as smaller diamonds, are also in rough agreement with the GGCs and LG dwarfs. Interestingly, it seems that the HB morphologies of the dSphs tend to be redder than the HBs of GGCs at a given period. Given that the HB gets redder for younger ages at constant metallicity, it is possible that the difference between the GGCs and the dSphs is due to the generally more extended star formation histories of the latter.
Following Petroni & Bono (2003), in the bottom panel of Fig. 17 we plotted the fraction of overtone RR Lyrae stars versus the metallicity for the same dSph and GGC as in Fig. 16. While Petroni & Bono (2003) used only RR and RR, we found that including the RR (when present) with the RR gave a slightly tighter correlation. We estimated the significance of this correlation using the Pearson product-moment correlation coefficient , which is obtained by dividing the covariance of the two variables by the product of their standard deviations. We found that the correlation between the fraction of overtone pulsators and [Fe/H] of the clusters with a well-sampled population of RR Lyrae stars—excluding the six clusters with [Fe/H] or f—increases from 0.23 to 0.29 when the double-mode pulsators are included, at a significance greater than 99.5%. As shown in the bottom panel of Fig. 17, fcd tends to be larger at lower metallicities. Since clusters with lower metallicity generally have a bluer HB, the hotter region of the IS tends to be more populated, therefore containing more RR stars. Both Cetus and Tucana agree with the trend, even though the former has very few RR (f 0.05) and the latter has a unusually large number of RR (17%).
Interestingly, it seems that and fcd are also correlated, as shown in the top panel of Fig. 17. The value of the Pearson correlation coefficient for these two quantities is =0.53 at a significance level of 99.99% when including the dSph. This correlation comes from the temperature distribution of the stars along the HB: a bluer (i.e., hotter) HB contains a larger fraction of overtone pulsators, while the pulsational period decreases with increasing temperature.

6. Distance Estimates
As stated above, the photometric and pulsational properties of RR Lyrae stars are fundamental tools to estimate distances. In this section, we used the two main methods adopted in the literature to calculate the distance: the luminosity-metallicity relation, which arises from the knowledge that the intrinsic luminosity of HB stars mainly depends on their metallicity, and the period-luminosity-metallicity (PLM) relation, based on the theoretical location of the IS in the period-luminosity plane. In both cases, we used the intensity-averaged mean magnitude in the Johnson V band calculated in §2. For this reason, RR variables were not taken into account.
6.1. The Luminosity-Metallicity Relation
The luminosity-metallicity relation generally has the form MV = a + b[Fe/H], where and assume different values depending on the calibration (see Sandage & Tammann, 2006, for a review of the various calibrations). The most recent calibrations are not linear but present a break around [Fe/H]1.5, although this is not of concern here since the mean metallicity of both galaxies is below this value. In the present paper, we use the slope given by Clementini et al. (2003), who derived it from new photometry and spectroscopy of a large number (100) of RR Lyrae stars close to the LMC bar. The zero-point was chosen such that the LMC distance modulus is (m-M)LMC,0 = 18.5150.085 (assuming [Fe/H]LMC=1.5), which corresponds to the weighted mean of a large number of independent and reliable distance estimates to the LMC (see Clementini et al., 2003):
| (1) |
This calibration gives MV = 0.545 at [Fe/H]=1.5, in very good agreement with calibrations of the RR Lyrae absolute magnitude as a function of metallicity using the absolute magnitude of SX Phoenicis stars and main sequence fitting using Hipparcos trigonometric parallax data (see Tammann et al., 2008, for a review).

For Cetus and Tucana, we calculated the mean magnitude of the RR Lyrae stars to be =25.0280.005 and =25.3210.005, respectively. Given the large number of variables in both cases, the outliers (see Fig. 12) have very little influence on these values: we iteratively rejected stars further than 3- then 1-, and found that the mean magnitudes changed by less than 0.01. As this is within the uncertainties, all the RR and RR were used in the following.
The adopted mean metallicity was obtained from our star formation histories (M. Monelli et al. 2009, in preparation). For the old population of both Cetus and Tucana, we found Z=0.00030.0001 (i.e., [Fe/H]=1.820.15 assuming Z☉=0.0198 (Grevesse & Noels, 1993) and [Fe/H]=log Z+1.70 log(0.638 f + 0.362) (Salaris et al., 1993) with the enhancement factor f set to zero). This gives a HB luminosity of MV=0.480.12, where the uncertainty was quantified with Monte Carlo simulations and takes into account the uncertainty on the zero-point and slope of eq. (1) and on the metallicity of the galaxies. This gives distance moduli of 24.550.12 for Cetus and 24.840.12 for Tucana.
Interestingly, when separately calculating the distance to the bright and faint subsamples of RR Lyrae stars in Tucana presented in Paper I, we obtain very similar values. Assuming they have slightly different average metallicities (Z=0.0002 and 0.0005), we find that the distance modulus of the brighter (=25.2510.005), more metal-poor subsample differs from that of the fainter (=25.3790.003), more metal-rich subsample by only 0.05 (24.81 vs. 24.86, respectively), which is consistent within the uncertainty. This strengthens the claims of Paper I that the difference in luminosity of the two subsamples is due to a difference in metallicity.
6.2. The Period-Luminosity-Metallicity Relation
We also determined the distance modulus of each galaxy by matching the PLM relation for evolutionary pulsators at the first-overtone blue edge (FOBE) of the IS from Caputo et al. (2000, their eq. 3). The theoretical limits of the IS are shifted in magnitude until the FOBE coincides with the observed distribution of first-overtone RR Lyrae stars. Figure 18 shows the position of the IS (dashed lines) overplotted on the distribution of observed RR Lyrae stars in the –log P plane.
Adopting the mean metallicity given above, we derive (mM)Cet=24.54 and (mM)Tuc=24.79, for which Caputo et al. (2000) give an intrinsic dispersion of =0.07 mag due to uncertainties associated with the various ingredients of the model. Combined with the errors in metallicity, mean magnitude and period, we estimate a total uncertainty in the distances of 0.1.
At this metallicity, we can also use a RR mass of 0.7 M☉ (Bono et al., 1997b) as input to the updated PLM from Di Criscienzo et al. (2004, their eq. 3 and 4). Assuming a mixing-length parameter =1.5, the location of the predicted edges of the IS is shown with the solid lines in Fig. 18 and basically yields the same values for the distance moduli (24.53 and 24.77).
Note that we excluded V246 in Tucana, since the low amplitude (A0.15) and poor quality of the light-curves (see Fig. 11) prevented an accurate determination of its period; assuming the period and mean magnitude were correctly measured, the distance should be shortened by 0.1. On the other hand, the distance determination in Cetus is based on only one star (V111). While statistical considerations hamper the reliability of this distance calculation (which strictly speaking might be considered an upperlimit), the location of this star at the very edge of the blue side of the IS (see Fig. 12), together with the high quality of its light-curves, strengthen the relevance of the derived distance. Indeed, both the luminosity-metallicity and PLM relations give very similar values for the distance to Cetus.
Interestingly, for both galaxies the temperature of the fundamental-mode red edge (FRE) of the IS seems to be underestimated in both calibrations of the PLM. Because of the large uncertainty in the efficiency of convection in the external layers of stars, represented by the mixing-length parameter in stellar evolution models, and the higher sensitivity of the red side of the IS to , Caputo et al. (2000) tentatively place the red edge of the pulsation region at log P=0.45 with respect to the FOBE. However, the low metallicity GCs ([Fe/H]1.3, their Fig. 1) indicate that the log P is actually closer to 0.4 at the metallicity of our galaxies. Therefore, using the FRE at log P=0.45 from the FOBE gives a distance modulus smaller by 0.1 than the distance calculated from the FOBE itself, as was already observed by Dall’Ora et al. (2003). Similarly, Di Criscienzo et al. (2004) note that for some of the clusters of their sample—which also happen to be the most metal-poor clusters ([Fe/H]1.5)—the value of the distance modulus to fit the observed distribution of ab-type variables is smaller by 0.15 mag than the value derived from the FOBE under the assumption of a constant mixing-length parameter (see Di Criscienzo et al., 2004, for a discussion of the effect of the mixing-length parameter on the distance estimates).
6.3. Results
In paragraphs 6.1 and 6.2 we derived the distance modulus of Cetus and Tucana adopting two independent methods, based on empirical and theoretical calibrations, which gave very similar results. Given the statistical considerations presented above, we retain the results of the luminosity-metallicity method as our best distances.
According to Schlegel et al. (1998), the extinction along the line of sight of Cetus and Tucana in V is 0.088 and 0.097, respectively. In the following, we adopt reddening-corrected distance moduli of 24.460.12 and 24.740.12, respectively, corresponding to 78040 kpc and 89050 kpc. These are in good agreement with previous determinations based on independent methods (e.g., TRGB; (mM)0,Cet=24.390.07: McConnachie et al. 2005; (mM)0,Tuc=24.690.16: Saviane et al. 1996).
7. Above-HB variables
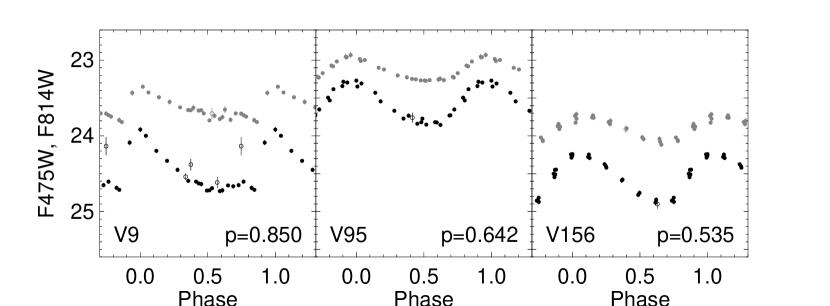
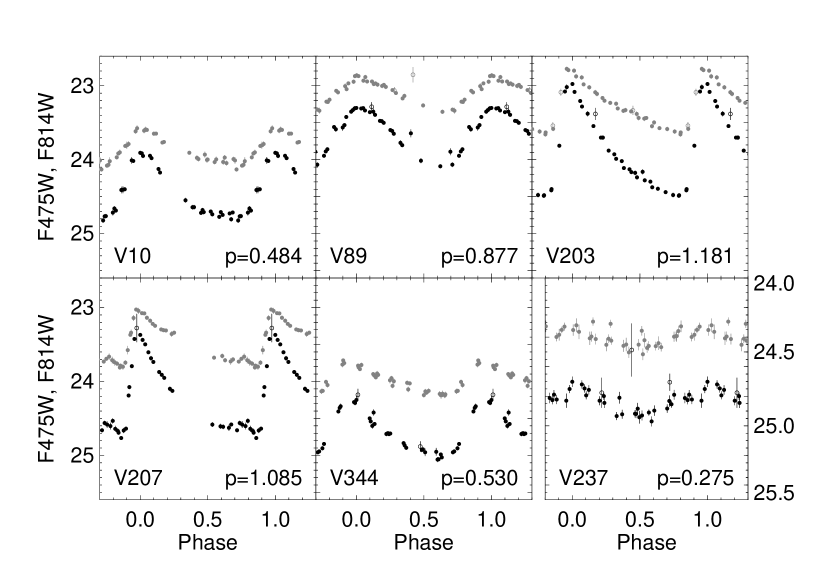
Cetus and Tucana respectively harbor three and six variables located above the HB. The different light-curve shapes, shown in Fig. 19, hint that they probably belong to different types of variables or pulsate in different modes. In Fig. 20 we plot their intensity-averaged Johnson B magnitudes (see Section 2) versus the logarithm of their period. The solid lines show the loci of the fundamental and first-overtone mode anomalous Cepheids (AC) from Bono et al. (1997c).
From their position in this figure, we tentatively classify V9 in Cetus, and V203 and V207 in Tucana as fundamental mode ACs, while the remaining AHB—except V237 in Tucana—are closer to the first-overtone ACs locus. It also seems that no type II Cepheid, which have longer periods for a given magnitude (e.g., Nemec et al., 1988), is present in these galaxies. This is not unexpected, since Fornax and Draco are the only dSph in which they have been observed to date (Bersier & Wood, 2002; Harris et al., 1998).
V237 in Tucana has a very low amplitude (0.15 in F475W) and its luminosity is only 0.6 magnitude brighter than the HB. While it clearly presents a variability and looks isolated on our images, no period could be found that gave a smooth light-curve. Even though its position in the CMD makes it a good candidate low-amplitude Cepheid, there is still the possibility that it actually is a foreground variable with a very short period or multiple periods.
The observed number of AC can be compared with that expected from the visual luminosity of each galaxy through the specific frequency, calculated as the number of AC per (Mateo et al., 1995). Assuming V237 in Tucana is an AC, and correcting for completeness (10% in Cetus and 90% in Tucana, see Section 4), we find the specific frequencies to be 5 and 1, respectively. From the updated plot of Pritzl et al. (2005) and the absolute visual magnitude of our two galaxies (M11.30.3: McConnachie et al. 2005; M9.60.3: Saviane et al. 1996), we find that Tucana falls very close to the fit, while Cetus has more AC than expected. This might be an indication that the tidal radius of Cetus from McConnachie & Irwin (2006) was overestimated, leading to an overestimation of the correction for completeness in Section 4. In this respect, preliminary analysis of deep (V26) VIMOS images of Cetus indicates that the field located 10 from the center contains very few, if any, stars belonging to Cetus (E. Bernard et al. 2009, in preparation).
8. Other Candidate Variables
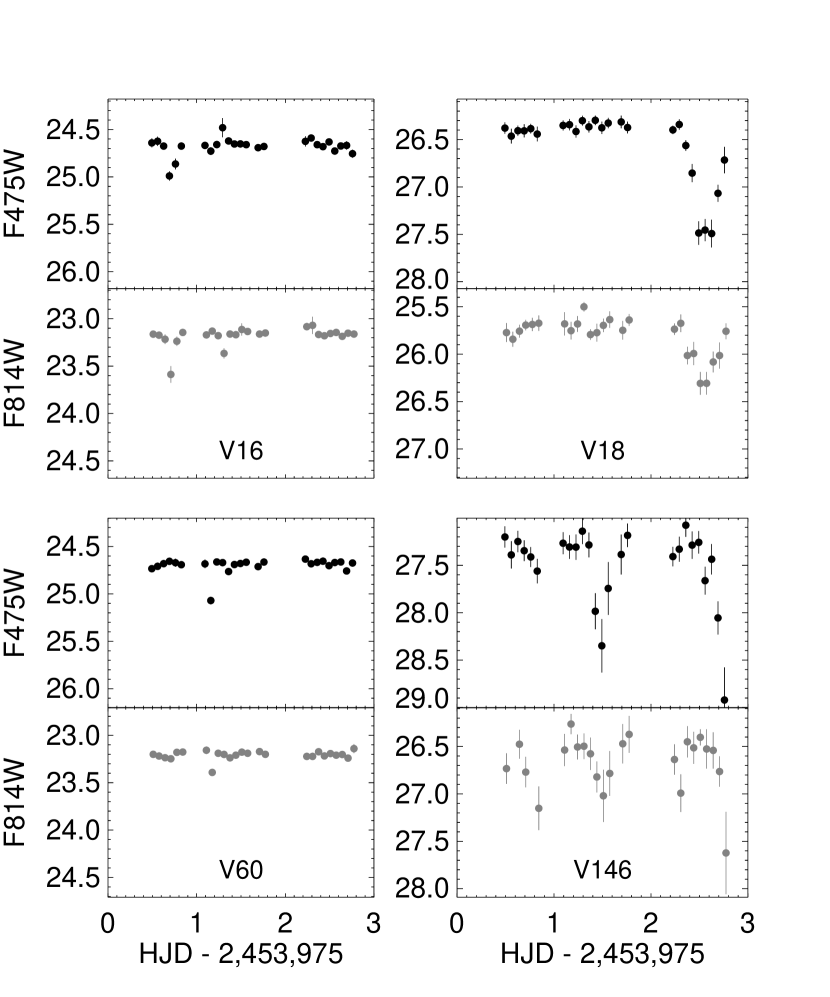
In addition to the classical IS variables, we also detected four candidate eclipsing binary systems and one LPV in Cetus, and seven candidate LPV in Tucana. Figure 21 shows the light-curves of the eclipsing binaries. Note that V16 and V60 might not be binary stars as they are not located on or near the main-sequence as most binary stars. In addition, a minimum lasting about three hours seems unlikely for a star on the RGB. We decided to not discard them as minimum light occurs in both bands at the same time, and the individual images corresponding to these minimums do not present chip defects or cosmic rays at the location of the candidates. V18 and V146, on the other hand, are definitely eclipsing binaries, although we could not determine their orbital period as we did not observe a well defined secondary minimum.
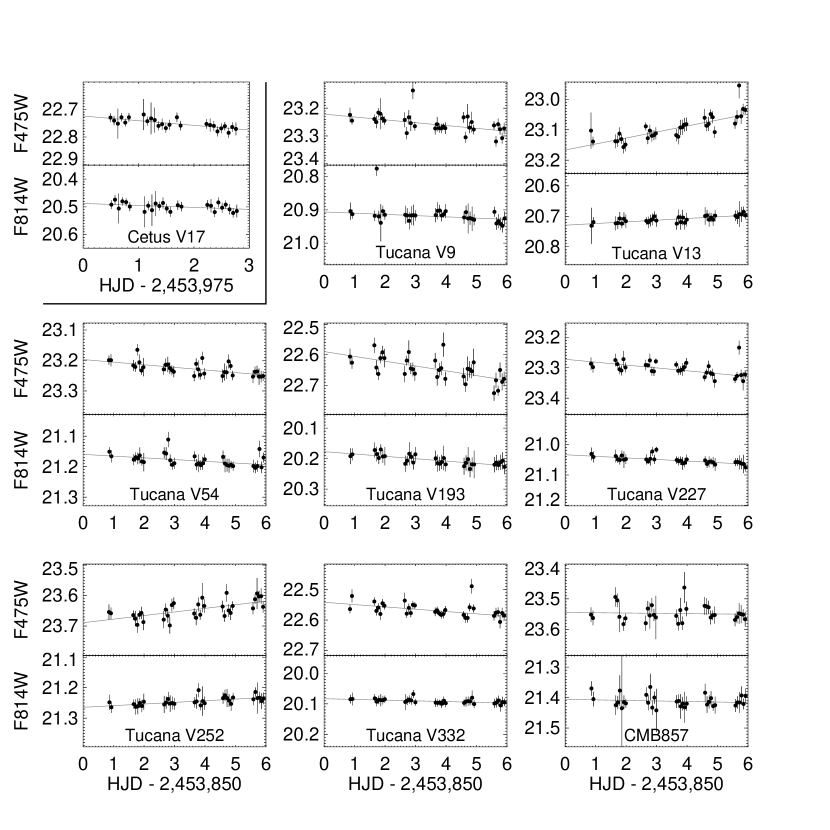
Among the bright red stars, one in Cetus and seven in Tucana presented a larger variability index. All are located at or slightly above the TRGB. Their light curves are presented in Fig. 22. Even though the amplitude of these variations is really small over the length of the observing run ( magnitude), the fact that the amplitude varies in the same sense in both bands and by a larger amount in F475W supports their classification as LPV. None of the LPV variables of Tucana correspond to the ones discovered by Castellani et al. (1996). Of their three candidates, one is saturated on our images and another falls inside the gap between the two chips. The third (#857 in their catalog) does not seem to present variability in our data. For reference, its light-curve from our photometry is also shown at the bottom of Fig. 22. Assuming it is a bona fide Mira variable, it is possible that we observed it at minimum light, which can last for several weeks at almost constant magnitude. Another possibility is that their candidate variable is actually a flickering RGB star, which present variability over 10-minute time scales (Mighell & Roederer, 2004). Our 20-minute long exposures would erase such variations, while these could appear on the shorter exposures of Castellani et al. (1996).
9. Discussion and Conclusions
Since the dSph were first discovered, our perceptions of them have changed from simple, GC-like objects to complex systems presenting a wide variety of properties. Cetus and Tucana are no exceptions, even though they appear similar at first sight: their metal content is comparable, and Whiting et al. (1999) noted that the closest match to the RGB of Cetus among the dSph is the RGB of Tucana.
However, both their HB morphology and RR Lyrae populations expose differences in a more subtle level between these two galaxies. As discussed above, the HB of Cetus is redder than expected from its metallicity, especially compared to the HB of Tucana. While the red side of the HB is well-populated in both galaxies, Cetus has very few stars on the blue side although they extend as far to the blue as in Tucana. Given that in a dSph the main parameter affecting the HB are age and metallicity, in the sense that the HB gets bluer for older ages and lower metallicities, this might be a hint that the first burst of star formation started at the same time in both galaxies, albeit with a much higher intensity in Tucana. The same conclusion is reached from the SFH analysis of both galaxies (M. Monelli et al. 2009, in preparation). This strong early burst might also explain why the overall metallicity of Tucana is so similar to that of Cetus even though it is much less massive, and the presence of multiple old populations in Tucana (\al@har01,ber08; \al@har01,ber08).
The mean properties of their RR Lyrae are also very different, as evidenced by Figs. 16 and 17. The main disparities are the mean fundamentalized periods (0.601 and 0.555 for Cetus and Tucana, respectively) and the fraction of overtone pulsators, both consequences of the temperature (i.e., mass) distribution on the HB.
In addition, both galaxies present internal variations of the HB morphology as a function of galactocentric distance. We discussed the gradients in the RR Lyrae properties of Tucana in a previous paper (Paper I). In the case of Cetus, the small spatial coverage did not allow an accurate study of these gradients. However, because the ACS field lies slightly outside the center of the galaxy, we could use the division in elliptical annuli described in Section 4 to calculate the HBR and mean period as a function of radius. We find that the HBR does increase slightly with radius ([0.820.05,0.750.04,0.630.04], from the inner- to the outermost annulus). On the other hand, P is constant within the errors throughout the sampled radius. Observations of a larger area are necessary to check if the change in HBR is real and accompanied by a change in mean period. Thus, to date Tucana is the only dSph in which a radial gradient in the mean period of its variables has been observed.
Cetus is located about 780 kpc from the MW, and McConnachie & Irwin (2006) calculate that it is also 680 kpc from M31, while Tucana is 890 kpc from the MW and on the opposite side of the MW from M31. Thus, the spatial isolation of both galaxies inside the LG probably sheltered them from the strong interactions consequence of close encounters with massive galaxies like the MW or M31—tidal stripping and stirring, ram-pressure stripping (Mayer et al., 2006). Nevertheless, it is possible that the two dwarfs are on very radial orbits, as seen for at least 10% of subhaloes in cosmological simulations (Ghigna et al., 1998), or that they were on more tightly bound orbits but were scattered out due to three-body interactions (Sales et al., 2007). In the latter cases, they would have suffered tidal interactions or ram pressure stripping at some point in their evolution, having experienced at least one close passage with the MW, but surely not as much as the bulk of the dSphs population of MW and M31. Until a good understanding of their orbits is available it is safe to assume that their differing properties, together with similarities between satellites and isolated galaxies, might actually indicate that environmental effects must be complemented by some other basic mechanism(s) affecting their individual evolution.
Appendix A Comments on Individual Variables
The following comments are based on the careful inspection of the stacked images, of the light curves, and/or peculiar properties exhibited on one or more of the plots presented in this work.
A.1. In Cetus
V1 — Possible blend with a faint star.
V4 — Close to a bright star.
V6 — Low Amplitude. Looks isolated on the images.
V11 — Peculiar: large amplitude and 0.1 mag below the HB.
V32 — Low Amplitude. Looks isolated on the images.
V35 — Blend.
V39 — In bad column. Very noisy light-curve.
V40 — Blend.
V45 — Blend.
V47 — Blended with V48.
V48 — Blended with V47.
V53 — Possible blend with faint stars.
V55 — 0.2 mag above the HB. Looks isolated on the images.
V71 — Low Amplitude. Looks isolated on the images.
V92 — Located close to the edge of chip 1. Some points bad or missing because of dithering.
V93 — Located close to the edge of chip 1. Some points bad or missing because of dithering.
V105 — Blend.
V116 — 0.3 mag above the HB. Possible blend with faint stars.
V130 — Possible blend with faint stars.
V133 — Located close to the edge of chip 1. Some points bad or missing because of dithering.
V135 — Located close to the edge of chip 1. Some points bad or missing because of dithering.
V154 — Blend. Low amplitude.
V158 — Blend.
V159 — Blend.
V165 — Possible blend with faint stars.
V173 — Peculiar: large amplitude and 0.1 mag below the HB.
V176 — Blend. Low amplitude.
A.2. In Tucana
V25 — Blend.
V28 — Located close to the edge of chip 2.
V36 — Possible blend with a faint star.
V38 — Close to a bright star.
V50 — Close to a bright star.
V51 — In bad column. Very noisy light-curve.
V56 — Possible blend. Noisy light-curve and low amplitude.
V58 — Possible blend with faint stars.
V61 — Blend.
V65 — Close to bad column.
V67 — Low amplitude. Looks isolated on the images.
V69 — Blend.
V70 — Blend. Might not be a RRd.
V72 — Located close to the edge of chip 2. Some points bad or missing because of dithering.
V78 — Possible blend with faint stars, close to bad column.
V80 — In bad column.
V81 — In bad column.
V82 — Close to a bright background galaxy. RRd.
V92 — Blend.
V96 — Blend.
V99 — Possible blend with a faint star.
V110 — Noisy light-curves and low amplitude. Looks isolated on the images.
V111 — Possible blend with faint stars.
V112 — Noisy light-curves. Possible blend with a faint star.
V113 — Blend.
V114 — Possible blend with faint stars.
V118 — Blend. Noisy light-curve in F814W.
V119 — Close to a bright star. RRd.
V120 — Blend.
V121 — Located close to the edge of chip 2.
V124 — Possible blend with faint stars.
V125 — Rising phase + peak missing. Inaccurate mean mag and amplitudes because of bad fits.
V126 — Close to a bright background galaxy.
V129 — Possible blend with faint stars.
V137 — Located close to the edge of chip 1. Some points bad or missing because of dithering.
V139 — Blend.
V145 — Close to a bright star.
V158 — Blend. RRd.
V160 — Close to a background galaxy.
V167 — Possible blend with faint stars.
V168 — Blend.
V177 — Blend.
V179 — Blend.
V180 — Blend.
V184 — Close to a bright star.
V185 — Close to a bright star.
V187 — Blend.
V189 — Blended with a background galaxy.
V194 — Blend.
V196 — Possible blend.
V199 — Blend. RRd.
V201 — Blend.
V220 — Possible blend with faint stars.
V227 — Blend. LPV.
V231 — Blend.
V232 — Blend.
V233 — Possible blend with a faint background galaxy.
V238 — Blend. Noisy light-curves.
V239 — Blend. RRd.
V241 — Possible blend with faint stars.
V246 — Low amplitude. Possible blend with faint stars. Noisy light-curves.
V248 — Blend. Noisy light-curve in F814W.
V251 — Blend.
V253 — Blend.
V264 — Blend.
V267 — Blend.
V284 — Blend.
V285 — Possible blend with faint stars.
V289 — Possible blend with faint stars.
V293 — Blend. RRd.
V295 — Possible blend with faint stars.
V304 — Blend.
V306 — Blend.
V326 — Blend.
V334 — Possible blend with faint stars.
V341 — 0.3 mag above the HB. Looks isolated on the images.
V353 — Blended with a background galaxy.
V364 — 0.45 mag above the HB. Looks isolated on the images.
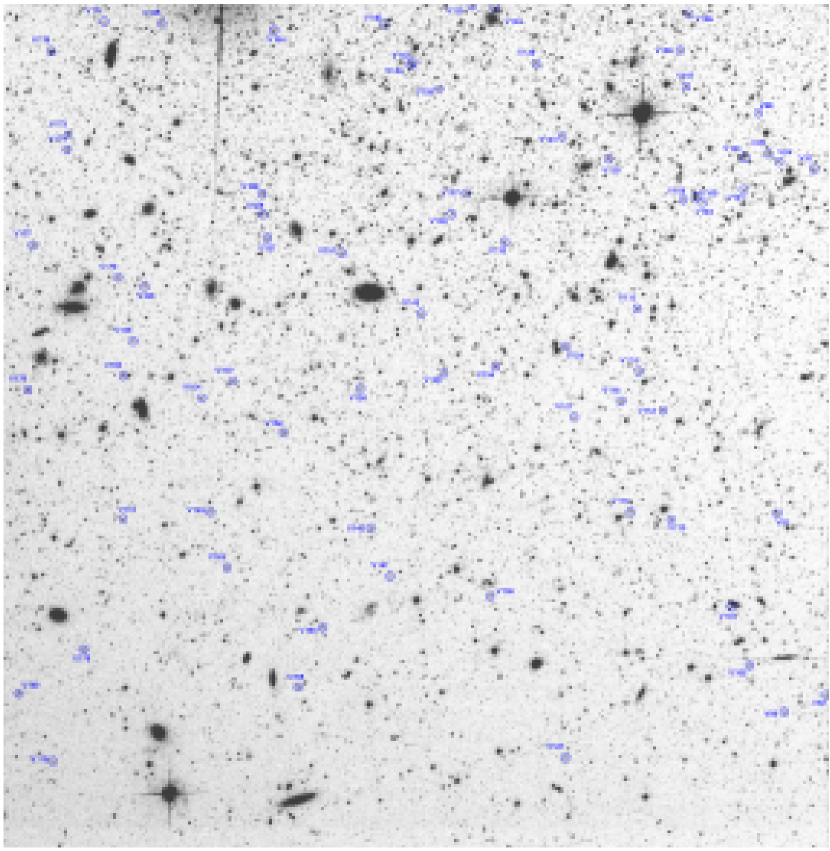
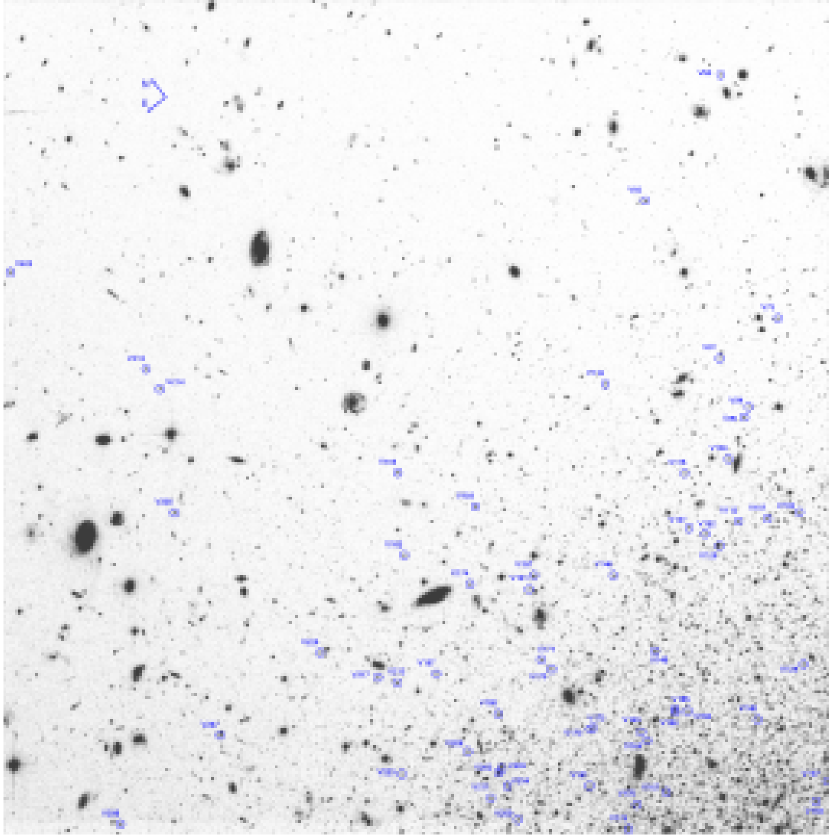
Appendix B Finding Charts
The finding charts for the whole sample of variable stars are presented in the electronic version of the Astrophysical Journal (Figs. 23 & 24).
References
- Bernard et al. (2007) Bernard, E. J., & The LCID Team 2007, IAU Symposium, 241, 317
- Bernard et al. (2008) Bernard, E. J., et al. 2008, ApJ, 678, L21 (Paper I)
- Bersier & Wood (2002) Bersier, D., & Wood, P. R. 2002, AJ, 123, 840
- Blazhko (1907) Blazhko, S. 1907, Astron. Nachr., 175, 325
- Bono et al. (1997a) Bono, G., Caputo, F., Cassisi, S., Castellani, V., Marconi, M., & Stellingwerf, R. F. 1997a, ApJ, 477, 346
- Bono et al. (1997b) Bono, G., Caputo, F., Cassisi, S., Castellani, V., & Marconi, M. 1997b, ApJ, 479, 279
- Bono et al. (1997c) Bono, G., Caputo, F., Santolamazza, P., Cassisi, S., & Piersimoni, A. 1997c, AJ, 113, 2209
- Caputo et al. (2000) Caputo, F., Castellani, V., Marconi, M., & Ripepi, V. 2000, MNRAS, 316, 819
- Castellani et al. (1996) Castellani, M., Marconi, G., & Buonanno, R. 1996, A&A, 310, 715
- Catelan (2005) Catelan, M. 2005, ArXiv Astrophysics e-prints, arXiv:astro-ph/0507464
- Clement et al. (2001) Clement, C. M., et al. 2001, AJ, 122, 2587
- Clementini et al. (2006) Clementini, G., et al. 2006, Memorie della Societa Astronomica Italiana, 77, 249
- Clementini et al. (2004) Clementini, G., Corwin, T. M., Carney, B. W., & Sumerel, A. N. 2004, AJ, 127, 938
- Clementini et al. (2003) Clementini, G., Gratton, R., Bragaglia, A., Carretta, E., Di Fabrizio, L., & Maio, M. 2003, AJ, 125, 1309
- Cole et al. (2007) Cole, A. A., et al. 2007, ApJ, 659, L17
- Corwin et al. (2008) Corwin, T. M., Borissova, J., Stetson, P. B., Catelan, M., Smith, H. A., Kurtev, R., & Stephens, A. W. 2008, AJ, 135, 1459
- Corwin et al. (2004) Corwin, T. M., Catelan, M., Borissova, J., & Smith, H. A. 2004, A&A, 421, 667
- Corwin et al. (2003) Corwin, T. M., Catelan, M., Smith, H. A., Borissova, J., Ferraro, F. R., & Raburn, W. S. 2003, AJ, 125, 2543
- Corwin et al. (2006) Corwin, T. M., Sumerel, A. N., Pritzl, B. J., Smith, H. A., Catelan, M., Sweigart, A. V., & Stetson, P. B. 2006, AJ, 132, 1014
- Dall’Ora et al. (2003) Dall’Ora, M., et al. 2003, AJ, 126, 197
- Dall’Ora et al. (2006) Dall’Ora, M., et al. 2006, ApJ, 653, L109
- Di Criscienzo et al. (2004) Di Criscienzo, M., Marconi, M., & Caputo, F. 2004, ApJ, 612, 1092
- Dolphin et al. (2001) Dolphin, A. E., et al. 2001, ApJ, 550, 554
- Gallart et al. (2004) Gallart, C., Aparicio, A., Freedman, W. L., Madore, B. F., Martínez-Delgado, D., & Stetson, P. B. 2004, AJ, 127, 1486
- Ghigna et al. (1998) Ghigna, S., Moore, B., Governato, F., Lake, G., Quinn, T., & Stadel, J. 1998, MNRAS, 300, 146
- Greco et al. (2008) Greco, C., et al. 2008, ApJ, 675, L73
- Grevesse & Noels (1993) Grevesse, N., & Noels, A. 1993, Origin and Evolution of the Elements, 15
- Harbeck et al. (2001) Harbeck, D., et al. 2001, AJ, 122, 3092
- Harris et al. (1998) Harris, H. C., Silberman, N. A., & Smith, H. A. 1998, A Half Century of Stellar Pulsation Interpretation, 135, 164
- Held et al. (2001) Held, E. V., Clementini, G., Rizzi, L., Momany, Y., Saviane, I., & Di Fabrizio, L. 2001, ApJ, 562, L39
- Horne & Baliunas (1986) Horne, J. H., & Baliunas, S. L. 1986, ApJ, 302, 757
- Kaluzny et al. (1995) Kaluzny, J., Kubiak, M., Szymański, M., Udalski, A., Krzemiński, W., & Mateo, M. 1995, A&AS, 112, 407
- Kaluzny et al. (2004) Kaluzny, J., Olech, A., Thompson, I. B., Pych, W., Krzemiński, W., & Schwarzenberg-Czerny, A. 2004, A&A, 424, 1101
- Kinemuchi et al. (2008) Kinemuchi, K., Harris, H. C., Smith, H. A., Silbermann, N. A., Snyder, L. A., LaCluyzé, A. P., & Clark, C. L. 2008, AJ, 136, 1921
- King (1962) King, I. 1962, AJ, 67, 471
- Kovács (1998) Kovacs, G. 1998, A Half Century of Stellar Pulsation Interpretation, 135, 52
- Kovács (2001) Kovács, G. 2001, A&A, 375, 469
- Kuehn et al. (2008) Kuehn, C., et al. 2008, ApJ, 674, L81
- Lavery (1990) Lavery, R. J. 1990, IAU Circ., 5139, 2
- Lavery et al. (1996) Lavery, R. J., Seitzer, P., Walker, A. R., Suntzeff, N. B., & Da Costa, G. S. 1996, From Stars to Galaxies: the Impact of Stellar Physics on Galaxy Evolution, 98, 333
- Lavery & Mighell (1992) Lavery, R. J., & Mighell, K. J. 1992, AJ, 103, 81
- Layden et al. (1999) Layden, A. C., Ritter, L. A., Welch, D. L., & Webb, T. M. A. 1999, AJ, 117, 1313
- Lázaro et al. (2006) Lázaro, C., Ferro, A. A., Arévalo, M. J., Bramich, D. M., Giridhar, S., & Poretti, E. 2006, MNRAS, 372, 69
- Lee & Carney (1999) Lee, J.-W., & Carney, B. W. 1999, AJ, 117, 2868
- Lee (1990) Lee, Y. W. 1990, ApJ, 363, 159
- Mack et al. (2007) Mack, J., Gilliland, R. L., Anderson, J., & Sirianni, M. 2007, Instrument Science Report ACS 2007-02, 20 pages, 2
- Mateo et al. (1995) Mateo, M., Fischer, P., & Krzeminski, W. 1995, AJ, 110, 2166
- Mayer et al. (2006) Mayer, L., Mastropietro, C., Wadsley, J., Stadel, J., & Moore, B. 2006, MNRAS, 369, 1021
- McConnachie & Irwin (2006) McConnachie, A. W., & Irwin, M. J. 2006, MNRAS, 365, 1263
- McConnachie et al. (2005) McConnachie, A. W., Irwin, M. J., Ferguson, A. M. N., Ibata, R. A., Lewis, G. F., & Tanvir, N. 2005, MNRAS, 356, 979
- Mighell & Rich (1996) Mighell, K. J., & Rich, R. M. 1996, AJ, 111, 777
- Mighell & Roederer (2004) Mighell, K. J., & Roederer, I. U. 2004, ApJ, 617, L41
- Muñoz et al. (2006) Muñoz, R. R., Carlin, J. L., Frinchaboy, P. M., Nidever, D. L., Majewski, S. R., & Patterson, R. J. 2006, ApJ, 650, L51
- Musella et al. (2009) Musella, I., et al. 2009, ApJ, 695, L83
- Nemec et al. (1988) Nemec, J. M., Wehlau, A., & Mendes de Oliveira, C. 1988, AJ, 96, 528
- Oosterhoff (1939) Oosterhoff, P. T. 1939, The Observatory, 62, 104
- Petroni & Bono (2003) Petroni, S., & Bono, G. 2003, Memorie della Societa Astronomica Italiana, 74, 915
- Pietrinferni et al. (2004) Pietrinferni, A., Cassisi, S., Salaris, M., & Castelli, F. 2004, ApJ, 612, 168
- Popielski et al. (2000) Popielski, B. L., Dziembowski, W. A., & Cassisi, S. 2000, Acta Astronomica, 50, 491
- Pritzl et al. (2005) Pritzl, B. J., Armandroff, T. E., Jacoby, G. H., & Da Costa, G. S. 2005, AJ, 129, 2232
- Salaris et al. (1993) Salaris, M., Chieffi, A., & Straniero, O. 1993, ApJ, 414, 580
- Salaris & Weiss (1997) Salaris, M., & Weiss, A. 1997, A&A, 327, 107
- Sales et al. (2007) Sales, L. V., Navarro, J. F., Abadi, M. G., & Steinmetz, M. 2007, MNRAS, 379, 1475
- Sandage & Tammann (2006) Sandage, A., & Tammann, G. A. 2006, ARA&A, 44, 93
- Sarajedini et al. (2002) Sarajedini, A., et al. 2002, ApJ, 567, 915
- Saviane et al. (1996) Saviane, I., Held, E. V., & Piotto, G. 1996, A&A, 315, 40
- Schlegel et al. (1998) Schlegel, D. J., Finkbeiner, D. P., & Davis, M. 1998, ApJ, 500, 525
- Siegel (2006) Siegel, M. H. 2006, ApJ, 649, L83
- Siegel & Majewski (2000) Siegel, M. H., & Majewski, S. R. 2000, AJ, 120, 284
- Sirianni et al. (2005) Sirianni, M., et al. 2005, PASP, 117, 1049
- Smith (1995) Smith, H. A. 1995, RR Lyrae stars, Cambridge Astrophysics Series, 27
- Stellingwerf (1978) Stellingwerf, R. F. 1978, ApJ, 224, 953
- Stetson (1994) Stetson, P. B. 1994, PASP, 106, 250
- Stetson (2000) Stetson, P. B. 2000, PASP, 112, 925
- Stothers (1987) Stothers, R. B. 1987, ApJ, 319, 260
- Szabó et al. (2004) Szabó, R., Kolláth, Z., & Buchler, J. R. 2004, A&A, 425, 627
- Tammann et al. (2008) Tammann, G. A., Sandage, A., & Reindl, B. 2008, ApJ, 679, 52
- Turner (1997) Turner, A. 1997, Cooking with ALLFRAME version 3.0 (Victoria: Dominion Obs.)
- Udalski et al. (2001) Udalski, A., Wyrzykowski, L., Pietrzyński, G., Szewczyk, O., Szymański, M., Kubiak, M., Soszyński, I., & Zebrun, K. 2001, Acta Astronomica, 51, 221
- Walker & Nemec (1996) Walker, A. R., & Nemec, J. M. 1996, AJ, 112, 2026
- Walker (1994) Walker, A. R. 1994, AJ, 108, 555
- Welch & Stetson (1993) Welch, D. L., & Stetson, P. B. 1993, AJ, 105, 1813
- Whiting et al. (1999) Whiting, A. B., Hau, G. K. T., & Irwin, M. 1999, AJ, 118, 2767