Structural and magnetic phase transitions in Na1-δFeAs
Abstract
We use neutron scattering to study the spin and lattice structures of single crystal and powder samples of Na1-δFeAs ( K). On cooling from room temperature, the system goes through a series of phase transitions: first changing the crystal symmetry from tetragonal to orthorhombic at 49 K, then ordering antiferromagnetically with a spin structure similar to that of LaFeAsO and a small moment (0.090.04 ), and finally becoming superconducting below about 23 K. These results confirm that antiferromagnetic order is ubiquitous for the parent compounds of the iron arsenide superconductors, and suggest that the separated structural and magnetic phase transition temperatures are due to the reduction in the -axis exchange coupling of the system.
Determining the universal features of iron arsenide superconductors is an important first step in developing a microscopic theory to understand the high-transition temperature (high-) superconductivity in these materials kamihara . From the outset, it was known that antiferromagnetic (AF) order is a competing ground state to superconductivity in iron arsenide superconductors. The parent compound LaFeAsO exhibits a structural distortion at 155 K and then orders antiferromagnetically below 137 K, electron doping to induce superconductivity suppresses both the structural distortion and static AF order cruz ; mcguire . Although subsequent neutron scattering experiments on the parent compounds of other iron-based superconductors including FeAsO ( Ce, Pr, Nd) jzhao1 ; kimber ; jzhao2 ; ychen , Fe2As2 ( Ba, Sr, Ca) qhuang ; jzhao3 ; goldman , and FeTewei ; li1 have found similar lattice distortion and AF order as that of the LaFeAsO, the FeAs system ( Li, Na) seemed to be an exception to this universal picture since the initial neutron and X-ray scattering experiments have found no evidence of lattice distortion or static AF order cqjin ; pitcher ; tapp ; pwchu . These results are in contrast with local density approximation (LDA) calculations, where the Fermi surfaces and magnetic orders of FeAs are expected to be similar to that of the LaFeAsO dsingh ; jishi . Although recent transport and heat capacity measurements on single crystals of Na1-δFeAs showed two anomalies at 52 K and 41 K that are assigned to structural and AF phase transitions, respectively gfchen , muon-spin rotation experiments (SR) confirmed only the AF ordering and neutron scattering found no evidence for structural distortion parker2 .
In this paper, we report neutron scattering investigation of spin and lattice structures of single crystals and polycrystalline materials of Na1-δFeAs. We identify a tetragonal to orthorhombic structural phase transition near 50 K and thus confirm the transport measurements gfchen . Although our neutron powder diffraction measurements were unable to detect AF order due to the small Fe moment, single crystal experiments using thermal triple-axis spectroscopy unambiguously confirmed an AF phase transition below 40 K and showed that the system forms a collinear in-plane AF spin structure identical to other iron arsenides jzhao1 ; kimber ; jzhao2 ; ychen ; qhuang ; jzhao3 ; goldman but doubling the unit cell along the -axis [Fig. 1(a)]. The ordered moment is by far the smallest in iron arsenides, being . These results suggest that AF order with a collinear in-plane spin structure is ubiquitous property of the parent compounds of iron arsenide superconductors. We argue that the separated structural and magnetic phase transitions in Na1-δFeAs is due to reduced -axis exchange coupling and Na deficiencies. Bulk superconductivity in Li1-δFeAs and Na1-δFeAs can only arise with enough self-doping induced by alkali metal deficiencies.

We prepared 7 grams of polycrystalline Na1-δFeAs sample and 0.6 gram of single crystals as described in Ref. gfchen . The resistivity measurement gives the onset and zero-resistivity as 23 K and 8 K, respectively gfchen . Powder neutron diffraction measurements were performed on the BT-1 high resolution powder diffractometer at the NIST Center for Neutron Research. The BT-1 diffractometer has a Ge(3,1,1) monochromator ( Å) and collimators with horizontal divergences of -- full width at half maximum (FWHM). Powder diffraction data refinement was done by using the GSAS program. The measurements on single crystals were carried out on the HB-1 triple-axis spectrometer at the High Flux Isotope Reactor, Oak Ridge National Laboratory. We fixed final neutron energy at meV and used PG(0,0,2) (pyrolytic graphite) as monochromator and analyzer. The collimations for magnetic and structural measurements are --- and ---, respectively. We denote (Å, where Å, = 6.99680(8) Å for tetragonal structure and Å, Å, Å for orthorhombic structure. The magnetic unit cell is defined as .
| Na0.985FeAs(5 K), , = 1.453 | |||||
|---|---|---|---|---|---|
| Å, Å, Å | |||||
| Atom | site | x | y | z | occupancy |
| Na | 4a | 0 | 0.25 | 0.3533(2) | 0.985(7)111Na occupancy is calculated as the mean value of those at several temperatures. |
| Fe | 4g | 0.25 | 0 | 0 | 1222Fe and As occupancies are fixed to 1. |
| As | 4a | 0 | 0.25 | 0.7977(1) | 122footnotemark: 2 |
| Selected bond lengths and angles: | |||||
| Fe-Fe2 2.79453(4) Å | Fe-Fe2 2.78473(4) Å | ||||
| Fe-As4 2.4272(4) Å | Na-As1 3.107(2) Å | ||||
| Na-As2 2.9874(6) Å | Na-As2 2.9782(6) | ||||
| Fe-As-Fe2 70.29(1)∘ | Fe-As-Fe2 70.01(1)∘ | ||||
| Fe-As-Fe2 108.72(3)∘ | |||||
| Na0.985FeAs(70 K), , = 1.685 | |||||
| Å, Å | |||||
| Atom | site | x | y | z | occupancy |
| Na | 2c | 0.25 | 0.25 | 0.3535(2) | |
| Fe | 2a | 0.75 | 0.25 | 0 | 122footnotemark: 2 |
| As | 2c | 0.25 | 0.25 | 0.7976(1) | 122footnotemark: 2 |
| Selected bond lengths and angles: | |||||
| Fe-Fe4 2.78941(3) Å | Fe-As4 2.4282(4) Å | ||||
| Na-As4 2.9830(6) Å | Na-As1 3.107(2) Å | ||||
| Fe-As-Fe4 70.11(2)∘ | Fe-As-Fe2 108.64(3)∘ | ||||
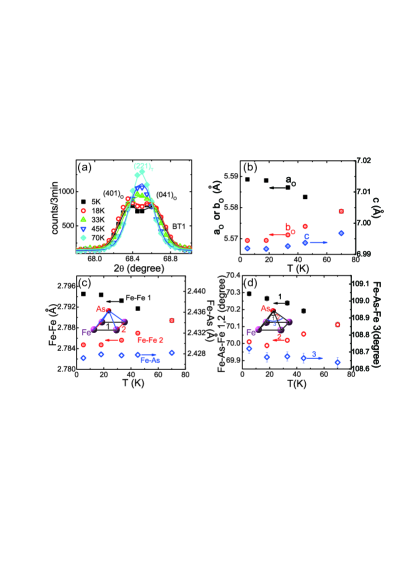
We first describe neutron powder diffraction measurements. At a temperature well above the structural and magnetic phase transitions ( K), Rietvelt analysis reveals a tetragonal structure with space group consistent with earlier results parker2 . After cooling the sample down to 5 K, the tetragonal peak splits into two peaks as shown in Fig. 2(a). Detailed temperature dependence of the profiles in Fig. 2(a) reveals that the tetragonal to orthorhombic structural phase transition occurs near 45 K. Refinement of the diffraction pattern supports an orthorhombic structure at low temperature and detailed structural parameters are listed in Table I for the two temperatures investigated. Fixing the occupancies of Fe and As to 1, we obtain the Na content as 0.985(7), or equivalently 1.5% Na deficiencies. Figures 2(b)-2(c) show the temperature dependence of some key parameters. As a function of increasing temperature, the Fe-Fe bond length decreases until they become equal (tetragonal) while the Fe-As distance remains unchanged [Fig.1(c)]. The orthorhombic lattice parameters and behave similarly [Fig. 1(b)]. While the nearest neighbor bond angles change in opposite directions with increasing temperature, the diagonal bond angle is essentially temperature independent [Fig. 2(d)]. These results are similar to those of LaFeAsO nomura , and thus suggesting the same underlying mechanism for the structural phase transition.
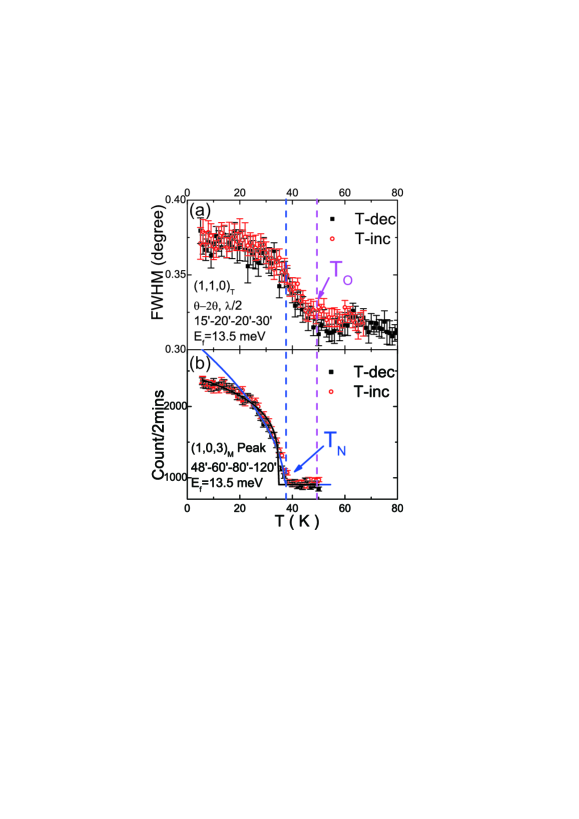
To precisely determine the structural transition temperature, we carefully measured the temperature dependence of the peak width (in FWHM) on the single crystal sample using as shown in Fig. 3(a). Although the resolution of the triple-axis spectrometer is not good enough to resolve two separate peaks from the scans at low temperature, the change of the FWHM reveals a structural phase transition temperature of 50 K, which is consistent with the higher transition temperature in the transport measurements gfchen .
To search for possible magnetic order, we carried out measurements using triple-axis spectroscopy on both the powder samples and single crystals. While we cannot find any magnetic peak in the powder diffraction data due to small Fe moment, we observe clear AF order on single crystals at low temperatures. It turns out that the in-plane AF unit cell of Na1-δFeAs is identical to that of LaFeAsO cruz , where the magnetic Bragg peaks are observed at (). Figures 1(c) and 1(d) show wave vector scans along the orthorhombic and directions jzhao2 at 5 K and 70 K. The resolution limited peaks around at 5 K disappear at 70 K [Figs. 1(c) and 1(d)]. Figure 3(b) shows the temperature dependence of the scattering at wave vector , where we estimate that the onset magnetic transition temperature is about 37 K with less than 1 K thermal hysteresis [Fig. 3(b)]. These results are consistent with transport measurements where the 40 K transition is identified as magnetic in nature. In a simple Ising model, the magnetic order parameter is related to temperature via . For BaFe2As2, AF phase transition has a critical exponent wilson . Fitting the whole temperature dependence of (1,0,3)M peak intensity yields an unreasonable K, shown as the black line in Fig. 3(b). Limiting the fitting range to temperatures above 20 K gives a K and , considerably higher than that of BaFe2As2. However, we caution that the order parameter was measured using peak intensity on single crystals, rather than integrated intensity measurement.
A collinear AF structure could either have spin directions along the - or -axis, which would correspond to magnetic peaks at or directions, respectively. In previous work on SrFe2As2 jzhao3 , the AF ordering direction was determined to be along the -axis direction by comparing the magnetic bragg peak with scattering from and nuclear Bragg peaks. Since the orthorhombic peak splitting in the case of Na1-δFeAs is rather small, we used very tight collimations for this purpose. Figure 4(a) shows the magnetic Bragg peak near or and scattering from twinned peaks of and . It is immediately clear that the magnetic (1,0,1)M peak position in scan is smaller than that of the nuclear peak. This result is consistent with earlier work on SrFe2As2 jzhao3 .
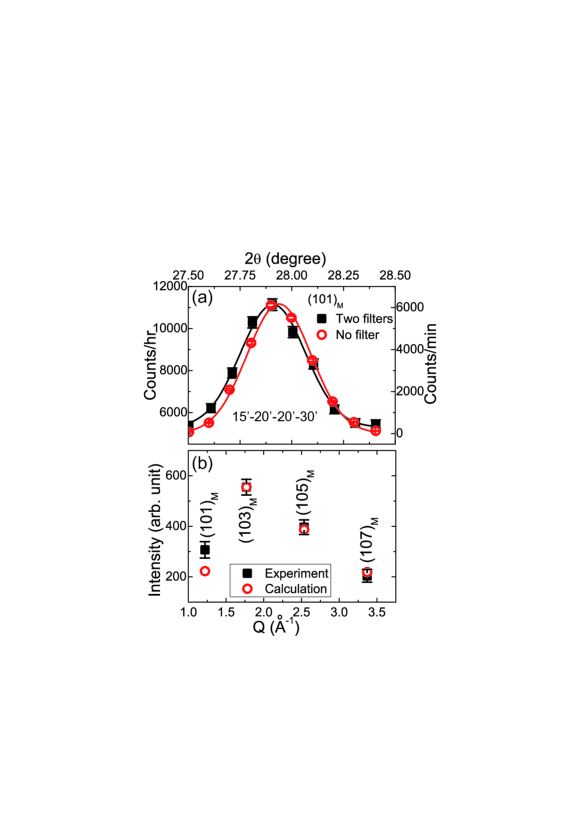
To determine the spin direction, we calculate the magnetic structure factors by assuming that the moments point to the -axis direction. The observed magnetic intensities are obtained by integrating the - scans at the expected magnetic peak positions () in the three-axis mode. A comparison of the calculated and observed magnetic peak intensities shown in Fig. 4(b) reveals that such a model explains the data reasonably well. The small deviation between the observed and calculated intensities sets a limit of the moment direction to be within 15 degrees away from the -axis. Therefore, the magnetic structure in Na1-δFeAs is the same as that in the Fe2As2 system as shown in Fig. 1(b) qhuang ; jzhao3 ; goldman . Assuming this spin structure, we can estimate an Fe moment of by comparing intensities of the AF Bragg peaks with with a series of nuclear peaks. Such a small moment explains why we as well as another group parker2 cannot find any AF Bragg peaks in neutron powder diffraction measurements.
Our results on Na1-δFeAs suggest that orthorhombic structure and collinear AF spin ordering in Fig. 1(b) are ubiquitous properties of undoped iron arsenides. Because of the difficulty in making stoichiometric samples of NaFeAs, Na deficiencies in the as-grown NaFeAs dopes holes onto the FeAs-plane that can induce superconductivity gfchen . For BaFe2As2, transport and neutron scattering experiments have shown that electron-doping reduces the -axis magnetic exchange coupling and separates the structural and magnetic phase transitions ni ; chu ; lester ; harriger . Theoretically, it has been argued that the strength of the -axis magnetic coupling controls the simultaneous or separated structural/magnetic phase transitions hu . For lightly doped BaFe1.96Ni0.04As2, inelastic neutron scattering experiments showed a dramatic drop in the -axis correlations with electron-doping. Based on density function theory calculations, the -axis exchange coupling of NaFeAs is smaller than that of BaFe2As2 but larger than that of LaFeAsO. Experimentally, the temperature separations between structural and magnetic phase transitions are similar for LaFeAsO cruz and NaFeAs. In addition, the AF order parameter showed no anomaly across similar to those of BaFe1.96Ni0.04As2 [Fig. 3(b)]. These results suggest that superconductivity in our Na1-δFeAs is filamentary and not a bulk phenomenon. Since our single crystals of Na1-δFeAs is slightly doped away from ideal stoichiometry (Na deficiency), it is unclear whether the observed small moment and large differences in structural/magnetic phase transition temperatures are the intrinsic or doping-induced -axis coupling reduction. Future inelastic neutron scattering experiments will be able to determine the exchange coupling along the -axis.
In conclusion, we have determined the lattice and magnetic structures of single crystal Na1-δFeAs. Our results indicate that the parent materials of NaFeAs and LiFeAs superconductors have orthorhombic lattice distortion and collinear AF order. This work establishes that the orthorhombic structure and AF collinear order are ubiquitous to all undoped iron arsenide materials. Superconductivity arises from electron or hole-doping of their AF parent compounds, and therefore suggesting that spin fluctuations are important for superconductivity of these materials.
We thank Jiangping Hu, J. A. Fernandez-Baca, Tao Xiang, Zhong-Yi Lu for helpful discussions. This work is supported by the U.S. NSF No. DMR-0756568, U.S. DOE BES No. DE-FG02-05ER46202, and by the U.S. DOE, Division of Scientific User Facilities. The work in IOP is supported by the Ministry of Science and Technology of China and NSFC.
References
- (1) Y. Kamihara et al., J. Am. Chem. Soc. 130, 3296 (2008).
- (2) C. de la Cruz et al., Nature (London) 453, 899 (2008).
- (3) M. A. McGuire et al., Phys. Rev. B 78, 094517 (2008).
- (4) J. Zhao et al., Nature Materials 7, 953 (2008).
- (5) S. A. J. Kimber et al., Phys. Rev. B 78, 140503 (2008).
- (6) J. Zhao et al., Phys. Rev. B 78, 132504 (2008).
- (7) Y. Chen et al., Phys. Rev. B 78, 064515 (2008).
- (8) Q. Huang et al., Phys. Rev. Lett. 101, 257003 (2008).
- (9) J. Zhao et al., Phys. Rev. B 78, 140504(R) (2008).
- (10) A. I. Goldman et al., Phys. Rev. B 78, 100506(R) (2008).
- (11) W. Bao et al, arXiv: 0809.2058.
- (12) Shiliang Li et al., Phys. Rev. B 79, 054503 (2009).
- (13) X. C. Wang et al., Solid State Commun. 148, 538 (2008).
- (14) M. J. Pitcher et al., Chemical Communications, 5918 (2008).
- (15) J. H. Tapp et al., Phys. Rev. B 78, 060505(R) (2008).
- (16) C. W. Chu et al., arXiv:0902.0806.
- (17) D. J. Singh, Phys. Rev. B 78, 094511 (2008).
- (18) R. A. Jishi and H. M. Alyahyaei, arXiv:0812.1215 (2008).
- (19) G. F. Chen et al., arXiv:0902.1100v1.
- (20) D. R. Parker et al., Chemical Communications, 2189 (2009).
- (21) T. Nomura et al., Supercond. Sci. Technol. 21, 125028 (2008).
- (22) S. D. Wilson et al., arXiv:0903.2430v1.
- (23) N. Ni et al., Phys. Rev. B 78, 214515 (2008).
- (24) J.-H. Chu et al., Phys. Rev. B 79, 014506 (2009).
- (25) C. Lester et al., Phys. Rev. B 79, 144523 (2009).
- (26) L. W. Harriger et al., arXiv:0904.3775v1.
- (27) C. Fang et al., Phys. Rev. B 77, 224509 (2008).