Radio and X-ray properties of submillimeter galaxies in the A2125 field
Abstract
We present the radio and X-ray properties of 1.2 mm MAMBO source candidates in a 1600 sq. arcmin field centered on the Abell 2125 galaxy cluster at . The brightest, non-synchrotron mm source candidate in the field has a photometric redshift, , and is not detected in a 31 ks Chandra X-ray exposure. These findings are consistent with this object being an extremely dusty and luminous starburst galaxy at high-redshift, possibly the most luminous yet identified in any blank-field mm survey. The deep 1.4 GHz VLA imaging identifies counterparts for 83% of the 29 mm source candidates identified at 4- ( mJy), implying that the majority of these objects are likely to lie at . The median mm-to-radio wavelength photometric redshift of this radio-detected sample is (first and third quartiles of 1.7 and 3.0), consistent with the median redshift derived from optical spectroscopic surveys of the radio-detected subsample of bright submm galaxies ( mJy). Three mm-selected quasars are confirmed to be X-ray luminous in the high resolution Chandra imaging, while another mm source candidate with potential multiple radio counterparts is also detected in the X-ray regime. Both of these radio counterparts are positionally consistent with the mm source candidate. One counterpart is associated with an elliptical galaxy at , but we believe that a second counterpart associated with a fainter optical source likely gives rise to the mm emission at .
1 Introduction
The discovery of massive, dust-obscured starburst galaxies in blank-field submm/mm-wavelength surveys has opened a new window on galaxy and structure formation in the early Universe (Smail, Ivison & Blain 1997; Hughes et al. 1998; Barger et al. 1998; Bertoldi et al. 2000). The bulk of this population exists at redshift, (Chapman et al. 2003, 2005; Aretxaga et al. 2003, 2007). These (sub)mm galaxies (hereafter SMGs) exhibit star-formation rates in excess of 1000 M⊙/yr, sufficient to build up the stellar mass of a giant elliptical galaxy in approximately 1 Gyr. This conclusion relies on the assumption that most of the far-infrared (FIR) luminosity in these objects is powered by star-formation rather than by an active galactic nucleus (AGN). X-ray studies of these SMGs confirm that while 28–50% do harbour an AGN, such AGN activity may only contribute to a small fraction of the enormous FIR luminosities (e.g. Alexander et al. 2005). Deep radio imaging of the 1.4 GHz emission in a subset of SMGs shows that this emission is extended over scales of a few kpc, also consistent with being associated with star-formation activity (e.g. Biggs & Ivison 2008). Further analysis of the X-ray and mid-infrared properties of SMGs are needed to reach stronger statistical conclusions regarding their AGN and star-forming nature, and such progress relies on the crucial first step of obtaining accurate positional information allowing unambiguous identification of a source at different wavelengths.
The coarse angular resolution of submm/mm detectors on single-dish telescopes (typically 10–20′′) means that it is impossible to immediately identify the optical/infrared counterpart responsible for the significant FIR luminosity of a SMG. Ideally one would like to use submm/mm-wavelength interferometry to identify the correct multi-wavelength counterparts, as has been done with the Plateau de Bure Interferometer (e.g. Downes et al. 1999) and the Submillimeter Array (Younger et al. 2007). Given the small field of view available with submm/mm-wavelength interferometers (typically 1′ diameter at wavelengths shorter than 1.2 mm) and present-day sensitivities, a more practical approach is to use radio interferometry, where the deepest 1.4 GHz Very Large Array (VLA111The NRAO is operated by Associated Universities Inc., under a cooperative agreement with the National Science Foundation.) imaging (rms 5–10 Jy/beam) is generally found to identify radio counterparts for 60–80% of the bright SMGs (e.g. Ivison et al. 2005). Many groups have been successful in using such deep radio interferometry (usually at 1.4 GHz) to localize the counterpart positions with subarcsecond accuracy (e.g. Ivison et al. 1998, 2000, 2002, 2007; Smail et al. 2000; Webb et al. 2003; Clements et al. 2004; Borys et al. 2004; Dannerbauer et al. 2004), which relies on the locally observed FIR-to-radio luminosity correlation (Condon 1992) holding at high-redshifts, which appears to be the case for FIR-selected star-forming galaxies out to redshifts, (Appleton et al. 2004; Kovacs et al. 2006; Ibar et al. 2008). Those submm/mm source candidates without radio counterparts are thought to be either spurious, to contain very cold dust, or to lie at redshifts .
The steepness of the submm/mm source counts means that wide-area surveys (1000 sq. arcminutes) are needed to identify members of the extremely bright SMG population ( mJy). One of the largest such surveys to date has been conducted with the 1.2 mm MAx-Planck Millimeter Bolometer (MAMBO) camera (Kreysa et al. 1998, 2002) toward the field of the A2125 cluster at (15h 41m, +66o 18m), covering 1600 sq. arcmins. The region centered on the A2125 cluster has been the target of a multi-wavelength observing campaign from X-ray to radio wavelengths (Wang et al. 2004; Owen et al. 2005a, 2005b, 2006; Voss et al. 2006). The main focus of the present study is on the brightest, mm-selected high-redshift starburst galaxies and AGN over the entire 1600 sq. arcmins surveyed by MAMBO. Although the large-scale overdense structure occupies most of the field, gravitational lensing of the background sources is likely to be unimportant, except near the cluster core, which only occupies 1 sq. arcmin. of the entire 1.2 mm MAMBO map. MAMBO identified four unusually bright mm sources with 1.2 mm flux densities in the range, mJy, of which three were deduced to be radio-loud quasars based on their significant X-ray luminosities and variability at mm-wavelengths. They also exhibit flat-spectrum mm-to-radio flux densities implying a non-thermal origin for the mm emission (Voss et al. 2006). The fourth object, MMJ1541+6630 (hereafter J154137+6630.5), is proposed to be a starburst-dominated galaxy, possibly with a weak obscured AGN. Its AGN nature has been concluded from a tentative identification of an X-ray counterpart in the low angular resolution ROSAT PSPC map (Voss et al. 2006).
In this paper we report on 1.4 GHz radio and Chandra X-ray observations (where available) of the most robust 1.2 mm sources identified in the A2125 field. In §2 we present the mm, radio and X-ray data used in our study, while in §3 we estimate the radio-to-mm photometric redshifts and the X-ray luminosities of our 1.2 mm sample. Finally, in section §4 we discuss the implications of our results. Throughout this work we adopt a cosmological model with km s-1 Mpc-1, and (Spergel et al. 2007).
2 Observations
2.1 Previous 1.2 mm MAMBO and 1.4 GHz VLA imaging
The MAMBO 37 and 117-element bolometer arrays (Kreysa et al. 1998, 2002) on the IRAM 30 m telescope were used to map the A2125 cluster field at 1.2 mm between 1999 and 2004. The total on-source integration time was 220 hours and the preliminary findings of this survey are presented by Bertoldi et al. (2000), Voss et al. (2006), and Sawitzki et al. (2009). The 1- depth of the final 1600 arcmin2 map ranges from 0.6 mJy/beam (11′′) at the center, to 3 mJy/beam around the edges. The data analysis and source extraction methods are described in detail by Sawitzki et al. (2009). Here, we consider the radio and X-ray properties of the 29 highest signal-to-noise 1.2 mm source candidates (4-) identified in the MAMBO map (Table 1). Relative to the cluster core, the nearest 1.2 mm source in our sample is separated by 3.4 arcmins, while the majority have separations greater than 10 arcmins. Using a lense model for the A2218 galaxy cluster, Knudsen et al. (2006) show that gravitational lensing is important for submm sources in the redshift range, , if they are within the central few square arcmins of the field centered on the cluster. As A2125 has a similar mass and redshift to that of A2218 (Wang, Owen & Ludlow 2004), we do not believe lensing will bias our analysis of the 1.2 mm sources in the A2125 field.
The A2125 field has also been imaged at 1.4 GHz with the VLA in all four configurations to a maximum depth of 6 Jy/beam, while the synthesized beam size is (position angle 87.9o) over an area of 40′ 40′. These observations, and the subsequent data analysis procedure is described by Owen et al. (2005a).
2.2 Chandra X-ray data
The analysis of an 82 ks Chandra ACIS-I image centered on the A2125 cluster is presented by Wang et al. (2004). These data successfully detect one of the three quasars, J153959+6605.8 (MMJ1540+6605), at X-ray wavelengths. Within the central 17 region of the field, these data detect 99 discrete X-ray sources, of which 10 are found to be radio-bright and physically associated with the A2125 complex.
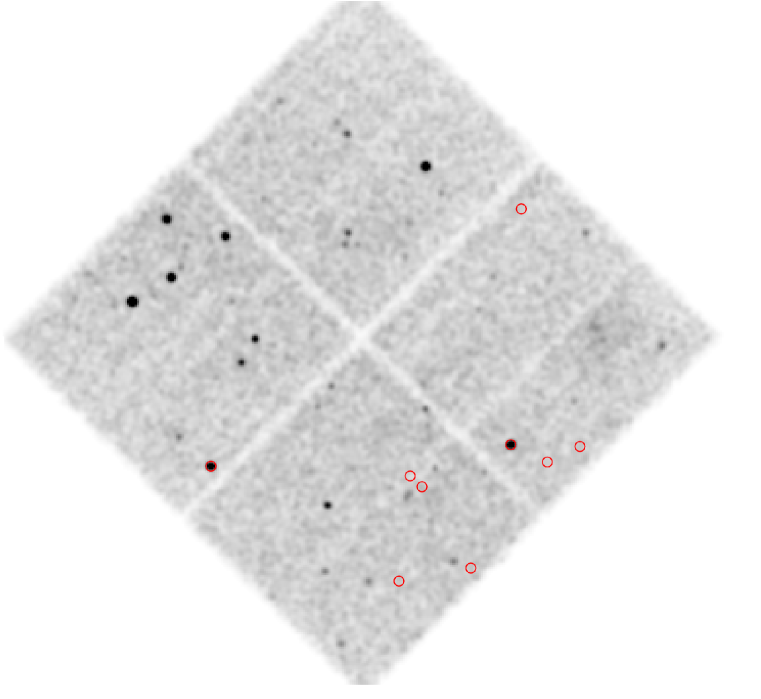
To study the X-ray properties of the high-redshift starburst galaxy, J154137+6630.5, as well as the other two mm-selected quasars in the A2125 field, a 31 ks Chandra ACIS-I exposure was obtained on April 2, 2006, for a field centered 17′ to the North-East of the deeper Chandra exposure. These new data were further analyzed using the Chandra Interactive Analysis of Observations (CIAO11footnotetext: See http://cxc.harvard.edu/ciao for a description of CIAO.) Version 4.0 tools after initial processing by the Chandra X-ray Center (CXC). The smoothed map is shown in Figure 1. Sources were identified using CELLDETECT.
3 Analysis
3.1 Identification of 1.4 GHz counterparts to MAMBO sources
We outline the criteria adopted for selecting the most probable radio counterparts to the 1.2 mm MAMBO source candidates in the A2125 field. We begin by searching a 5′′ radius around the positional centroid of each of the 23 MAMBO source candidates, proposing that any 1.4 GHz radio source detected at 4- (where is measured locally) within that area is a potential counterpart. The search radius is chosen to be half of the FWHM of the MAMBO beam at 1.2 mm, a value which has been demonstrated to be an appropriate search radius for previous studies of 850 m SCUBA sources (see Ivison et al. 2007). We then follow the method of Downes et al. (1986) to quantify the statistical probability, , that the radio counterpart could appear by chance given the local density of radio sources (see also Ivison et al. 2002, 2007). A radio counterpart with is considered to be a secure association. Using this approach, we find potential radio counterparts for 24 out of the 29 MAMBO source candidates (Table 1). Multiple radio counterparts are identified for three of our sources; J154004+6610.3, J153957+6613.6 and J154050+6608.6. Of the 5 mm sources without radio identifications, 3 (J153935+6629.7, J154249+6625.4 and J154239+6615.5) are found in regions of high noise, while two are found close to the edge of the MAMBO map. If these mm sources were spurious, then our detection rate of robust 1.2 mm sources would be 92%, consistent with the highest fraction of radio sources idenitified in other submm/mm-wavelength surveys (e.g. Ivison et al. 2005).
The median offset between the positional centroids of our mm and radio source candidates is 1.9′′ (Figure 2), a value in agreement with that found by Ivison et al. (2005) for their sample of robust SMGs (selected by comparing SCUBA and MAMBO source candidates) with secure radio counterparts in the Lockman Hole field.
3.2 Photometric redshift estimates
The radio-to-mm wavelength spectral indices of high-redshift SMGs can serve as a crude indicator of their redshifts. We apply the technique of Carilli & Yun (1999, 2000) to derive the most probable redshift for each of the 1.4 GHz detected, non-quasar source candidates in our sample (Table 1). The median photometric redshift of these radio-detected SMGs (excluding the three quasars) is (first and third quartile values of 1.7 and 3.0), which is consistent with the median redshift measured spectroscopically for bright, radio-detected SMGs by Chapman et al. (2003, 2005), and that derived for 850 m selected sources in the SCUBA HAlf Degree Extragalactic Survey (SHADES; Mortier et al. 2005; Coppin et al. 2006) adopting a more sophisticated photometric redshift technique (Aretxaga et al. 2007).
3.3 X-ray luminosities
The total 0.5–8.0 keV X-ray luminosity of a galaxy is defined as:
| (1) |
where is the 0.5-8 keV flux density (ergs cm-2 s-1) and is the luminosity distance (cm), while here we assume a photon index, , typical of unabsorbed AGNs (Tozzi et al. 2006). This X-ray luminosity can be used as a discriminant between starburst and AGN activity, as even for moderate redshifts, few starburst galaxies exhibit X-ray luminosities in excess of, 1042 ergs s-1 (e.g. Moran, Lehnert, & Helfand 1999; Zezas, Alonso-Herrero, & Ward 2001; Alexander et al. 2002). Two of the three high-redshift, mm-selected quasars originally identified by Voss et al. (2006), are confirmed to be X-ray luminous in our new Chandra data (J154321+6621.9 and J154141+6622.6; Table 2). The third quasar was previously detected in the 82 ks Chandra exposure presented by Wang et al. (2004).
The fourth bright mm source, J154137+6630.5 (MMJ1541+6630), is not detected in our high resolution Chandra data above a 0.5–8.0 keV flux of 710-16 erg/cm2/s. Only one other MAMBO source candidate, A2125_1200.22, is detected with the new X-ray data. The majority of the 1.2 mm source candidates are not detected in these X-ray data, which is consistent with the interpretation that most of their FIR luminosity is powered by star-formation, rather than AGN activity. Table 2 gives the X-ray properties of the four mm sources detected in our Chandra image. It is also possible that a non-detection of these SMGs in the X-ray bands is indicative of Compton-thick AGN activity.
For systems heavily obscured by dust and gas, strong X-ray emission is hardened due to reprocessing of the soft X-ray photons, which are absorbed and re-radiated in the (rest-frame) FIR. Quantitatively, the hardness ratio is calculated from the counts in the hard 2.0–8.0 keV band () to those in the soft 0.5–2.0 keV band (), and is defined here as: . Table 2 gives the hardness ratios of the three mm-selected quasars in the A2125 field.
4 Discussion
4.1 J154137+6630.5: an obscured starburst galaxy
Radio-to-mm wavelength photometric redshift estimates for J154137+6630.5 predict, , meaning that it is likely the highest redshift source in our sample, and potentially the most FIR luminous SMG discovered in any blank-field submm/mm-wavelength survey (51013 ). An X-ray counterpart to J154137+6630.5 is not detected in our new Chandra data, implying, erg s-1. This limit is consistent with the X-ray luminosities of the non-AGN SMGs detected in the 2 Ms Chandra survey of the Hubble Deep Field-North (HDF-N; Alexander et al. 2003), as well as low luminosity AGN. We therefore suggest that most of the far-infrared luminosity in J154137+6630.5 is likely powered by star-formation rather than AGN activity, however it is still possible that a Compton-thick AGN is present. If an AGN were present in J154137+6630.5, then correction for the AGN contribution to the radio flux density would result in a higher photometric redshift estimate for this object. If all of the FIR luminosity indicated by the 1.2 mm flux density were due to star-formation, the implied star-formation rate would be a tremendous, 18,000 yr-1.
4.2 Radio identification rate and implications for the redshift distribution of bright SMGs
The fraction of robust radio counterparts identified for the 1.2 mm source candidates (24/29) is similar to that typically found in blank-field submm/mm-wavelength surveys of comparable depths (85%; e.g. Ivison et al. 2005). This would suggest that the redshifts for the majority of our radio-detected sample are at , given the typical radio flux densities of these counterparts.
As mentioned previously, 3 of the 5 mm source candidates without radio counterparts are found in noisier regions of the MAMBO map. Based on previous surveys, it has been argued that some of those submm/mm source candidates without radio identifications are likely to be spurious. This charge motivated Ivison et al. (2005) to compile a sample of robust SMGs using a technique which combines source candidates identified in independent surveys of the Lockman Hole (at both 850 m and 1.2 mm), leading to a reduced likelihood of spurious sources in their final catalogue (10%). They then find that 80% of the sources in their catalogue have robust radio counterparts, so that only 10% of their candidates are likely to lie at redshifts, , in agreement with the results presented here. Along this same vein, for the SHADES survey, four independent analyses of the same dataset are performed in order to minimize systematic uncertainties introduced through the methods employed when calibrating low signal-to-noise bolometer data, effects which may have led to spurious source candidates in previous SCUBA surveys. The fraction of 850 m SHADES source candidates with robust radio identifications is 66% (Ivison et al. 2007), while the depth of the radio imaging is comparable between the SHADES and A2125 surveys. The typical 1.2 mm rms of the A2125 map is 1.0 mJy, while that of the 850 m SHADES imaging is 2.2 mJy. Assuming a greybody spectrum with emissivity index, , and dust temperature, K, typical of the bright SMG population (Kovacs et al. 2006; Laurent et al. 2006; Coppin et al. 2008), we can determine whether the relative depths of the two surveys should be sensitive to the same population of objects over all redshifts. For this assumed spectral energy distribution (SED), the MAMBO survey would be sensitive to a typical SHADES source out to redshifts, , beyond which the 850 m continuum emission is expected to be too faint at the limit of the SHADES survey. Conversely, the 1.2 mm emission should become brighter than the MAMBO detection threshold for SHADES sources at higher redshifts. Therefore, given our assumed SED, the 1.2 mm A2125 survey should be more sensitive to higher redshift SMGs, and we would expect a lower radio detection rate than in the 850 m SHADES survey if all source candidates are indeed real. Given the small areas covered by these two surveys, it may be that we are effected by cosmic variance in this sample comparison, and that a larger fraction of 1.2 mm A2125 sources are at lower redshifts than the SHADES sources. If gravitational lensing by the foreground cluster has amplified the flux densities of the 1.2 mm source candidates, then this comparison would be biased, though we do not believe this to be the case. It is also possible that a higher fraction of the SHADES sources may be spurious than has been estimated. If this is the case, then it is unlikely that more than 10–15% of bright SMGs exist beyond redshifts, , supporting the previous claim by Ivison et al. (2005).
Given the high density of radio sources associated with the A2125 cluster (Owen et al. 1999), it is possible that some of our proposed radio counterparts to the mm source candidates are in fact associated with foreground cluster members, rather than intrinsic to the higher redshift host galaxies responsible for the mm emission. In order to determine if this is indeed the case, we have compared our list of radio identifications with that of the radio positions of cluster members. Only one of our possible radio counterparts to a 1.2 mm MAMBO source candidate is spatially coincident with a cluster member, namely the second radio counterpart to J1540041+6610.3 associated with the cluster member, 24027 at (Owen et al. 2005b). However, this source is unlikely to be the correct counterpart given the far better positional agreement between the mm source and the primary radio counterpart. This primary radio counterpart to J1540041+6610.3 is detected in the Chandra X-ray image, and the implications of this are discussed below. Independant of which radio/X-ray counterpart gives rise to the mm emission in J1540041+6610.3, we can conclude that robust radio identifications are been obtained for at least 83% of our 1.2 mm source candidates in the A2125 field.
4.3 Luminous mm-selected quasars
The higher angular resolution Chandra imaging presented here and in Wang et al. (2004), confirms the significant X-ray fluxes of the three quasars identified by Voss et al. (2006). Two of these (J154321+6621.9 and J154141+6622.6) have spectroscopic redshifts measured from optical emission lines (Miller et al. 2004; Voss et al. 2006). In the case of the third quasar, J153959+6605.8, Voss et al. (2006) argue that the optical spectral energy distribution is consistent with , which we adopt in our luminosity calculations (Table 2). All of the quasars have intrinsic X-ray luminosities in the range, 1044–1045 ergs s-1, consistent with the interpretation that AGN are powering their tremendous X-ray luminosities. If the X-ray emission were due to star-formation activity, then these luminosities would imply rates in excess of 10,000 yr-1 (Grimm et al. 2003).
For an intrinsic power-law photon index , the hardness ratios of J154321+6621.9 and J154141+6622.6 are suggestive of moderate column densities of obscuring gas (51022 cm-2) at their measured redshifts. In the case of J153959+6605.8, its hardness ratio and assumed redshift () is consistent with that of an unobscured AGN with an HI column density, 1021 cm-2.
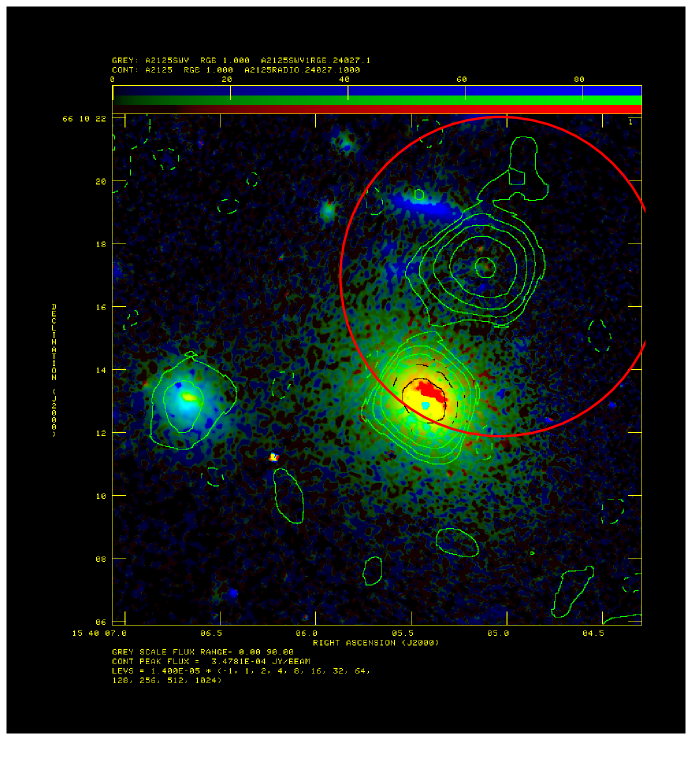
4.4 J154004+6610.3: a FIR luminous X-ray source
In addition to the three quasars, the only other mm source in the A2125 field with a proposed X-ray counterpart is J154004+6610.3. The 1.2 mm source candidate is positionally coincident with two radio counterparts (Figure 3), and each of these is associated with a Chandra X-ray source (Wang et al. 2004). While one counterpart is a cluster member (Owen et al. 2005b), both counterparts are spatially coincident with the concentration of low surface brightness X-ray emission (LSBXE) to the South-West of the A2125 cluster (Wang et al. 2004). The HST V-band image of this pair (Figure 3) reveals that the Southern X-ray component is associated with a bright elliptical galaxy (Wang et al. 2004) at a redshift z=0.2425. The optically faint component to the North is therefore most likely responsible for both the 1.2 mm emission and the second X-ray/radio component, which may be lensed by the foreground galaxy. The correct counterpart to the mm source candidate could be confirmed by submm/mm-wavelength interferometry. In the likely scenario whereby all of the mm emission arises from this second source, then the photometric redshift estimate predicts z=1.20. Assuming the range of redshifts consistent with the photometric redshift estimate, the derived X-ray luminosity of the Northern counterpart (Table 2) is in the range, ergs s-1, which would suggest an AGN-dominated system, if the source is unlensed. This interpretation is consistent with the point-like nature of the optical counterpart. The X-ray luminosity of the Southern counterpart ( erg s-1) is consistent with star-formation, but more likely arises from a weak AGN, as only a small fraction of such early-type galaxies generally contain detectable quantities of molecular gas (e.g. Combes et al. 2007), which is required to fuel a starburst.
5 Summary
We have presented the radio and X-ray properties of the 24 radio-detected 1.2 mm source candidates of the 29 detected in the A2125 field mapped by MAMBO. Our main findings can be summarized as follows:
-
1.
The bright thermal source discovered in the 1.2 mm MAMBO map is not detected in these new X-ray data, despite a previous claim of an identification in the ROSAT PSPC catalogue. The non-AGN nature of the FIR emission is therefore best explained by starburst activity, with an expected star-formation rate, 10,000 yr-1. Based solely on its 1.2 mm flux density, J154137+6630.5 is therefore likely to be the most luminous SMG identified in any blank-field submm/mm survey thus far.
-
2.
Our 1.4 GHz VLA imaging reveals an 83% detection rate for the mm source candidates, consistent with previous studies of bright SMGs in blank-field surveys of comparable sensitivity, suggesting that most of these objects lie at redshifts, . The median mm-to-radio photometric redshift of this radio-detected sample is , consistent with that of the median redshift of SMGs with optical spectroscopic redshifts (Chapman et al. 2003, 2005).
-
3.
The three mm-selected quasars discovered by Voss et al. (2006) are detected in these Chandra data, while their X-ray luminosities are consistent with AGN activity.
-
4.
X-ray emission is found to be associated with the most likely radio counterpart to one of the mm source candidates with a photometric redshift, .
Given the faintness of the optical and mid-infrared counterparts to J154137+6630.5 (not detected above an R-band magnitude of 27.2), the most probable route to obtaining a redshift for this object is through a broadband mm/cm-wavelength spectroscopic search for redshifted molecular CO line emission (e.g. Wagg et. al. 2007). Planned Submillimeter Array observations will soon reveal whether the single-dish mm emission from this object is composed of multiple components, providing an alternative explanation for its large apparent FIR luminosity.
With the recent advent of Spitzer, it has become possible to identify counterparts to SMGs in the mid-infrared (Egami et al. 2004; Frayer et al. 2004; Ashby et al. 2006; Pope et al. 2006; Ivison et al. 2007), which may also provide an alternative diagnostic of AGN activity. We will present an analysis of the mid-infrared properties of 1.2 mm source candidates in the A2125 field in a forthcoming article. Within the next two years, the EVLA will come online and provide an order of magnitude increase in 1.4 GHz continuum sensitivity. At such depths it will likely be possible to detect radio counterparts for essentially all of the bright SMG population (5 mJy at 850 m), depending on the nature of the relatively unstudied high-redshift ‘tail’ of this subsample (e.g. Wang et al. 2007). However, the steepness of the radio counts at these fainter flux density levels means that multiple plausible counterparts are likely to exist for a single bright SMG. As such, combined studies using both the EVLA and ALMA will be necesary to fully understand the submm and radio properties of this high-redshift galaxy population.
6 Acknowledgments
JW thanks Elizabeth Galle for assistance with the Chandra data analysis. JW and CC are grateful for support from the Max-Planck Society and the Alexander von Humboldt Foundation.
References
- (1)
- (2) Alexander, D.M., et al. 2002, ApJ, 568, L85
- (3)
- (4) Alexander, D.M., et al. 2003, AJ, 125, 383
- (5)
- (6) Alexander, D.M. et al. 2005, Nature, 434, 738
- (7)
- (8) Appleton, P.M. et al. 2004, ApJS, 154, 147
- (9)
- (10) Aretxaga, I., Hughes, D. H., Chapin, E. L., Gaztañaga, E., Dunlop, J. S., & Ivison, R. J. 2003, MNRAS, 342, 759
- (11)
- (12) Aretxaga, I., et al. 2007, MNRAS, 379, 1571
- (13)
- (14) Ashby M. L. N., et al., 2006, ApJ, 644, 778
- (15)
- (16) Barger, A. et al. 1998, Nature, 394, 248
- (17)
- (18) Baugh, C.M. et al. 2005, MNRAS, 356, 1191
- (19)
- (20) Bertoldi, F., et al. 2000, A&A, 360, 92
- (21)
- (22) Biggs, A. D., & Ivison, R. J. 2008, MNRAS, 385, 893
- (23)
- (24) Borys, C., Scott D., Chapman S., Halpern M., Nandra K., Pope A., 2004, MNRAS, 355, 485
- (25)
- (26) Borys, C., Smail, I., Chapman, S.C., Blain, A.W., Alexander, D.M., & Ivison, R.J., 2005, ApJ, 635, 853
- (27)
- (28) Carilli, C.L., Yun, M.S., 1999, ApJ, 513, L13
- (29)
- (30) Carilli, C.L., Yun, M.S., 2000, ApJ, 530, 618
- (31)
- (32) Chapman, S. et al. 2003, Nature, 422, 695
- (33)
- (34) Chapman, S. et al. 2005, ApJ, 622, 772
- (35)
- (36) Clements D. et al., 2004, MNRAS, 351, 611
- (37)
- (38) Combes, F., Young, L. M., & Bureau, M. 2007, MNRAS, 377, 1795
- (39)
- (40) Condon, J.J. 1992, ARA&A, 30, 575
- (41)
- (42) Coppin K., et al., 2006, MNRAS, 372, 1621
- (43)
- (44) Coppin K., et al., 2008, MNRAS, 384, 1597
- (45)
- (46) Dannerbauer H., Lehnert M.D., Lutz D., Tacconi L., Bertoldi F., Carilli C., Genzel R., Menten K.M., 2004, ApJ, 606, 664
- (47)
- (48) Dickey, J.M. & Lockman, F.J. 1990, ARA&A, 28, 215
- (49)
- (50) Downes, A.J.B., Peacock, J.A., Savage, A., Carrie, D.R. 1986, MNRAS, 218, 31
- (51)
- (52) Downes, D. et al. 1999, A&A, 347, 809
- (53)
- (54) Dwarakanath, K.S. & Owen, F.N., 1999, AJ, 118, 625
- (55)
- (56) Egami, e. et al. 2004, ApJS, 154, 130
- (57)
- (58) Frayer D. T., et al., 2004, ApJS, 154, 137
- (59)
- (60) Freeman P. E., Kashyap V., Rosner R., Lamb D. Q., 2002, ApJS, 138, 185
- (61)
- (62) Grimm, H.-J., Gilfanov, M. & Sunyaev, R. 2003, MNRAS, 339, 793
- (63)
- (64) Hughes, D.H. et al. 1998, Nature, 394, 241
- (65)
- (66) Ibar, E., et al. 2008, MNRAS, 386, 953
- (67)
- (68) Ivison, R.J., Smail I., Le Borgne J.-F., Blain A.W., Kneib J.-P., Bézecourt J., Kerr T.H., Davies J.K., 1998, MNRAS, 298, 583
- (69)
- (70) Ivison, R.J., Smail I., Barger A., Kneib J.-P., Blain A.W., Owen F.N., Kerr T.H., Cowie L.L., 2000, MNRAS, 315, 209
- (71)
- (72) Ivison, R.J. et al., 2002, MNRAS, 337, 1
- (73)
- (74) Ivison, R.J. et al. 2005, MNRAS, 364, 1025
- (75)
- (76) Ivison, R.J. et al. 2007, MNRAS, 380, 199
- (77)
- (78) Knudsen, K. K., et al. 2006, MNRAS, 368, 487
- (79)
- (80) Kovacs, A., et al. 2006, ApJ, 650, 592
- (81)
- (82) Kreysa, E., et al. 1998, in Advanced Technology MMW, Radio, and Terahertz Telescopes, SPIE, 3357, 319
- (83)
- (84) Kreysa, E., et al. 2002, in Experimental Cosmology at Millimetre Wavelengths, AIP Conf. Proc., 616, 262
- (85)
- (86) Laurent, G.T. et al. 2006, ApJ, 643, 38
- (87)
- (88) Marconi, A., & Hunt, L.K., 2003, ApJ, 589, L21
- (89)
- (90) Miller, N.A., Owen, F.N., Hill, J.M., et al. 2004, ApJ, 613, 841
- (91)
- (92) Moran, E. C., Lehnert, M. D., & Helfand, D. J. 1999, ApJ, 526, 649
- (93)
- (94) Mortier A. M. J., et al., 2005, MNRAS, 363, 563
- (95)
- (96) Owen, F.N., Ledlow, M.J., Keel, W.C., & Morrison, G.E., 1999, AJ, 118, 633
- (97)
- (98) Owen, F.N., Keel, W.C., Ledlow, M.J., Morrison, G.E., & Windhorst, R.A. 2005a, AJ, 129, 26
- (99)
- (100) Owen, F.N., Ledlow, M.J., Keel, W.C., Wang, Q.D., & Morrison, G.E., 2005b, AJ, 129, 31
- (101)
- (102) Owen, F.N., Keel, W.C., Wang, Q.D., Ledlow, M.J., & Morrison, G.E., 2006, AJ, 131, 1974
- (103)
- (104) Pope A., et al., 2006, MNRAS, 370, 1185
- (105)
- (106) Reid, M.J., et al. 1988, ApJ, 330, 809
- (107)
- (108) Sawitzki, M. et al. 2009, submitted
- (109)
- (110) Smail, I., Ivison, R. J., & Blain, A. 1997, ApJ, 490, L5
- (111)
- (112) Smail I., Ivison R.J., Owen F.N., Blain A.W., Kneib J.-P., 2000, ApJ, 528, 612
- (113)
- (114) Spergel D. N., et al., 2007, ApJS, 170, 377
- (115)
- (116) Tozzi, P., et al. 2006, A&A, 451, 457
- (117)
- (118) Voss, H. et al. 2006, A&A, 448, 823
- (119)
- (120) Wagg et al. 2007, MNRAS, 1485, 375, 745
- (121)
- (122) Wang, Q.D., Owen, F., & Ledlow, M. 2004, ApJ, 611, 821
- (123)
- (124) Wang, W.-H., et al. 2007, ApJ, 670, L89
- (125)
- (126) Webb T.M. et al., 2003, ApJ, 587, 41
- (127)
- (128) Younger, J.D., et al. 2007, ApJ, 671, 1531
- (129)
- (130) Zezas, A., Alonso-Herrero, A., & Ward, M. J. 2001, Ap&SS, 276, 601
- (131)
| Source | RA | DEC (J2000) | S1.2mm [mJy] | S1.4GHz [Jy] | RA [′′] | DEC [′′] | zphot a | |
|---|---|---|---|---|---|---|---|---|
| J153843+6610.2 | 15:38:43.77 | +66:10:12.33 | 8.92.0 | 96.021.3 | 0.5 | 2.4 | 0.003 | 3.05 |
| J153951+6610.3 | 15:39:51.24 | +66:10:15.07 | 4.20.9 | 39.59.3 | -1.7 | -1.3 | 0.008 | 3.27 |
| J153957+6613.6 | 15:39:58.17 | +66:13:34.78 | 4.10.7 | 309.217.2 | -0.5 | -0.7 | 2.410-4 | 1.19 |
| 84.29.8 | 2.7 | 4.7 | 0.01 | |||||
| J154004+6610.3 | 15:40:05.11 | +66:10:16.68 | 4.00.9 | 363.410.2 | 0.5 | -0.4 | 1.510-4 | 0.78 |
| 533.810.5 | -1.4 | 3.8 | 0.001 | |||||
| J154046+6615.9 | 15:40:47.03 | +66:15:52.64 | 3.10.7 | 108.27.3 | -1.0 | 0.8 | 0.001 | 1.86 |
| J154050+6608.6 | 15:40:50.21 | +66:20:15.31 | 3.20.6 | 99.018.4 | 1.2 | 0.2 | 0.001 | 1.58 |
| 64.38.4 | 4.8 | 0.2 | 0.017 | |||||
| J154101+6618.2 | 15:41:01.93 | +66:18:13.67 | 3.00.7 | 45.07.4 | -1.6 | -1.4 | 0.009 | 2.65 |
| J154115+6607.8 | 15:41:17.97 | +66:22:32.95 | 4.00.6 | 145.99.8 | 0.7 | -0.8 | 7.210-4 | 1.82 |
| J154123+6616.6 | 15:41:26.60 | +66:14:36.37 | 4.80.7 | 83.77.1 | -1.8 | -0.9 | 0.004 | 2.49 |
| J154127+6616.3 | 15:41:27.50 | +66:16:14.69 | 6.00.7 | 64.87.4 | 1.3 | -2.3 | 0.008 | 3.05 |
| J154128+6622.0 | 15:41:28.33 | +66:21:59.99 | 2.90.7 | 1331.212.1 | -2.7 | -2.7 | 7.610-4 | 0.53 |
| J154131+6610.9 | 15:41:31.12 | +66:10:50.25 | 3.70.7 | 39.77.6 | 1.7 | -0.2 | 0.007 | 1.01 |
| J154133+6611.9 | 15:41:33.22 | +66:11:58.26 | 2.90.7 | 54.17.1 | 0.1 | 0.7 | 9.210-4 | 2.45 |
| J154137+6630.5 | 15:41:37.17 | +66:30:31.94 | 15.81.9 | 97.918.5 | -0.1 | 0.3 | 1.710-4 | 3.93 |
| J154142+6605.9 | 15:41:42.66 | +66:05:57.26 | 3.90.9 | 95.010.8 | -1.7 | -1.0 | 0.003 | 2.18 |
| J154154+6618.5 | 15:41:54.12 | +66:18:30.22 | 3.80.8 | 37.98.4 | -1.9 | 0.1 | 0.008 | 3.16 |
| J154210+6621.2 | 15:42:10.71 | +66:21:12.54 | 3.50.7 | 173.110.3 | 0.0 | -1.3 | 9.910-4 | 1.62 |
| J154215+6621.6 | 15:42:14.80 | +66:21:35.35 | 2.80.7 | 74.017.5 | 0.8 | -0.1 | 0.001 | 2.11 |
| J154218+6618.1 | 15:42:18.83 | +66:18:04.32 | 2.80.7 | 68.49.5 | 2.4 | 0.1 | 0.006 | 1.86 |
| J154220+6607.2 | 15:42:20.75 | +66:07:12.94 | 4.60.9 | 66.012.1 | 3.0 | -2.5 | 0.01 | 2.72 |
| J154223+6610.1 | 15:42:23.35 | +66:10:03.25 | 2.70.7 | 120.110.1 | -5.0 | -2.3 | 0.009 | 1.67 |
| Source | [counts/ks] | Band ratioa | Fluxb | c | Referenced |
|---|---|---|---|---|---|
| J154321+6621.9 | 4.570.48 | -0.300.07 | 57.1 | 43.3 | (1) |
| J154141+6622.6 | 5.030.52 | -0.200.04 | 62.8 | 63.1 | (1) |
| J153959+6605.8 | 11.720.46 | -0.400.05 | 146.3 | 12.8 | (2) |
| J154137+6630.5 | 0.06 | - | 0.7 | 6.2–19.3 | (1) |
| J154004+6610.3 | 0.240.07 | - | 3.0 | 1.4–4.5 | (2) |
| 0.310.08 | - | 3.6 | 0.1 | (2) |