Stellar Clusters in the NGC 6334 Star Forming Complex
Abstract
The full stellar population of NGC 6334, one of the most spectacular regions of massive star formation in the nearby Galaxy, have not been well-sampled in past studies. We analyze here a mosaic of two Chandra X-ray Observatory images of the region using sensitive data analysis methods, giving a list of 1607 faint X-ray sources with arcsecond positions and approximate line-of-sight absorption. About 95% of these are expected to be cluster members, most lower mass pre-main sequence stars. Extrapolating to low X-ray levels, the total stellar population is estimated to be pre-main sequence stars. The X-ray sources show a complicated spatial pattern with 10 distinct star clusters. The heavily-obscured clusters are mostly associated with previously known far-infrared sources and radio HII regions. The lightly-obscured clusters are mostly newly identified in the X-ray images. Dozens of likely OB stars are found, both in clusters and dispersed throughout the region, suggesting that star formation in the complex has proceeded over millions of years. A number of extraordinarily heavily absorbed X-ray sources are associated with the active regions of star formation.
1 INTRODUCTION
The NGC 6634 (= Sharpless 8 = RCW 127) complex of molecular clouds and HII regions is an unusually rich region of massive star formation in the nearby Galaxy (see review by Persi & Tapia, 2008). At a distance of kpc (Neckel, 1978) and Galactic coordinates (351.2+0.7), it exhibits many phenomena associated with embedded OB stars: luminous far-infrared sources denoting embedded clusters (McBreen et al., 1983); radio continuum H II regions (Rodriguez et al., 1982); and complexes of molecular masers (Moran & Rodriguez, 1980). Early studies argued that the star formation started in the center of the region, where the stellar cluster appears dynamically relaxed, and proceeded outward where the embedded protostars are seen. Recent high-resolution millimeter-band maps of the dust distribution reveal hundreds of molecular clumps distributed along a narrow ridge along the Galactic Plane (Muñoz et al., 2007; Matthews et al., 2008). The total molecular mass is estimated to be M⊙ with typical column density cm-2 along the ridge. The total bolometric luminosity is L⊙ (Loughran et al., 1986) indicating that rich embedded stellar clusters with massive OB stars are present. Optical and infrared maps are dominated by bright and spatially complex nebular emission from HII regions and heated dust.
While deeply embedded massive stars in the region have been well-studied, less is known about the low mass pre-main sequence population associated with the massive stars. source lists are incomplete due to heavy obscuration and H II region nebulosity. A wide field survey of sources finds hundreds of embedded low mass stars around the high mass regions (Straw et al., 1989) and portions of the cloud have been surveyed to fainter levels in (Tapia et al., 1996; Persi et al., 2000). At both bright and faint magnitudes, near-infrared samples are severely contaminated by unrelated Galactic field stars.
High-resolution X-ray images of star forming molecular clouds from the Chandra X-ray Observatory can give rich samples of pre-main sequence stars which are complementary to those found in infrared surveys (see review by Feigelson et al., 2007). The X-ray band reveals all types of young stars. OB stars emit X-rays from their stellar winds on several scales: small instabilities in the wind acceleration region close to the stellar surface; magnetically channeled wind shocks; colliding wind shocks of close binaries; and shocked winds on parsec scales suffusing large H II regions (e.g. Cohen et al., 2003; Townsley et al., 2003; Schulz et al., 2003; Gagné et al., 2005; Skinner et al., 2005; Sana et al., 2006). Surveys of the Orion Nebula Cluster and Taurus clouds show that all lower mass stars emit X-rays during magnetic reconnection events near the stellar surface similar to, but far more powerful and frequent than, flares on the Sun (Getman et al., 2005; Güdel et al., 2007). Studies with the high-resolution Chandra X-ray Observatory are particularly effective in producing stellar samples with several benefits: low contamination by unrelated older stars; penetration deep into the obscuring cloud; sampling of rich populations of lower mass stars; (sub)arcsecond positions; and selection that is mostly unbiased with respect to the presence or absence of protoplanetary disks. Chandra studies of rich stellar clusters in obscured star forming regions around kpc distance include the Trifid Nebula (Rho et al., 2004), RCW 38 (Wolk et al., 2006), Cyg OB2 (Albacete Colombo et al., 2007), M 17 (Broos et al., 2007), NGC 6357 near NGC 6334 (Wang et al., 2007), and the Rosette Nebula and Molecular Cloud (Wang et al., 2008, 2009).
Two Chandra images of NGC 6334 are presented by Ezoe et al. (2006). Their study emphasizes the hard X-ray emission from individual stars and possibly from diffuse plasma suffusing the HII regions. They extract a sample of 792 X-ray sources, but do not provide a source list to facilitate further study. Prior to the Chandra observation, low resolution X-ray images gave only a glimpse of structure (Sekimoto et al., 2000). Ultra-hard X-ray emission attributed to background active galaxy has also been seen (Bykov et al., 2006).
We report here a reanalysis of the two Chandra exposures of NGC 6334 examined by Ezoe et al. (2006) using advanced data analysis techniques. Section 2 describes the data analysis methodology, §3 gives the astronomical results, and §4 presents conclusions. We find 1607 faint X-ray sources of which only 5% are likely problem sources or non-cluster contaminants. We give accurate positions and estimated absorption measurements for each star. From this dataset, we obtain an improved view of the clustering in the region: 10 X-ray clusters are identified, including several previously unreported lightly obscured star clusters. A considerable number of massive OB stars, some newly found, and deeply embedded protostars are detected. These may include extremely young Class 0 massive protostars.
2 X-RAY DATA ANALYSIS
2.1 Chandra Observations
The X-ray observations discussed here were previously presented by Ezoe et al. (2006). NGC 6334 was observed in two overlapping exposures of the Imaging Array of the Advanced CCD Imaging Spectrometer (ACIS-I), each 40 ks in duration and covering a field of view. The Chandra X-ray Observatory satellite and ACIS instrument are described by Weisskopf et al. (2002) and Garmire et al. (2003). The Chandra mirrors give an excellent subarcsecond point spread function (PSF) on-axis, but the PSF degrades substantially with off-axis distance. The field centers are and with a satellite roll angle of 269°. The exposure times are 40.2 ks and 40.1 ks, respectively. The observation was made in the standard Timed Exposure, Very Faint mode, with 3.2 s integration time and 5 pixel x 5 pixel event islands. Pre-Chandra X-ray observations with the low-resolution satellite are presented by Sekimoto et al. (2000). They and Ezoe et al. (2006) examine the spatially-integrated X-ray spectra of different components of NGC 6334 which we do not address here.
2.2 X-ray Source Identification
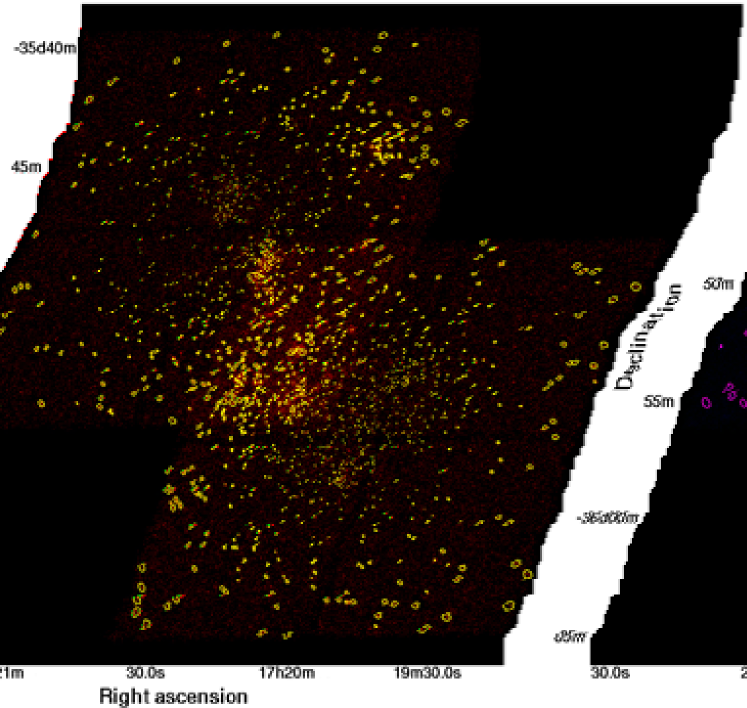
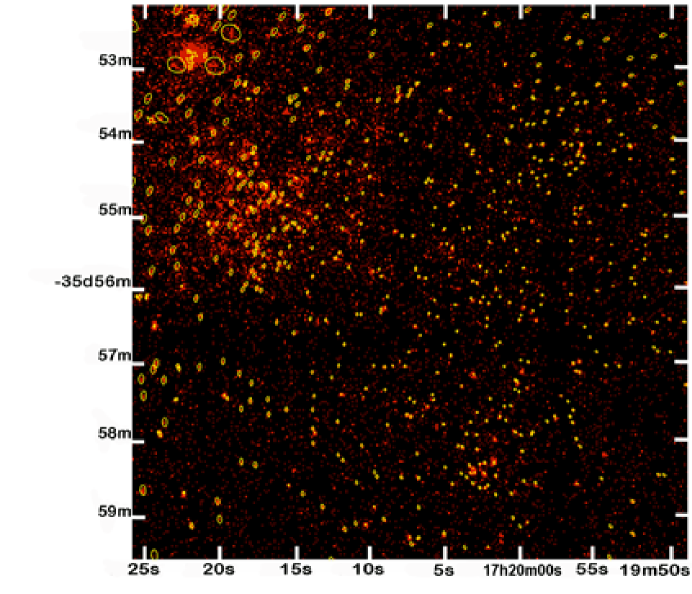
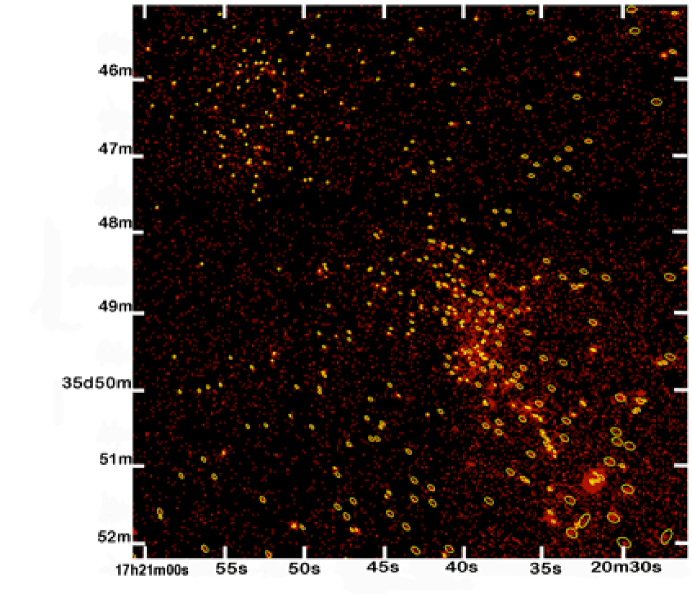
Our data reduction procedure follows those of Townsley et al. (2006) and Broos et al. (2007) with a few refinements. Level 1 event lists are first processed to recover an improved Level 2 event list as described by Townsley et al. (2003, Appendix B). This includes filtering of bad events, removal of the ″ positional randomization, and the correction of charge transfer inefficiency. Cosmic-ray afterglows are removed by searching for multiple events arriving on the same detector pixel within a few CCD readout frames with decreasing energies. Sub-pixel positioning of events with non-zero CCD ‘grades’ are refined using the algorithm of (Mori et al., 2001). Matching bright X-ray sources in the central region of the detectors to stars in the 2MASS Point Source Catalog, a 0.35″ correction was applied to astrometrically align the fields to the Hipparcos reference frame. Figure 1 shows the resulting merged ACIS fields at reduced resolution, and Figure 2 shows two expanded views.
It is challenging to reliably identify faint sources in overlapping, crowded fields with a spatially varying PSF, and to establish their statistical significance. We adopt a procedure where a superset of possible sources is first constructed by a variety of means, following by iterative pruning of low-significance sources. An initial list was obtained by running the wavdetect wavelet detection algorithm (Freeman et al., 2002) with a low threshold of . Other potential sources are added from visual inspection of the images and from a peak-finding algorithm applied to a maximum-likelihood reconstruction of the images (Lucy, 1974) using local PSFs, as described by Townsley et al. (2006). The Lucy-Richardson reconstruction is applied to the crowded central arcminute of the NGC 6334 fields with 0.1″ pixels. These steps are particularly important to identify closely-spaced sources which are merged by the wavelet algorithm. These procedures produced a superset of 2511 candidate sources. A few sources missed by the algorithm found by visual examination were added.
Photons are then extracted in polygonal regions closely matched to the local PSFs for each candidate source using the IDL-based program ACIS Extract111ACIS Extract (AE) and its associated Tools for ACIS Review and Analysis (TARA), developed by P. Broos and colleagues by the ACIS Team at Penn State, are publicly available at http://www.astro.psu.edu/xray/docs/TARA. AE is a versatile script written in IDL that performs source extraction, facilitates fitting X-ray spectra, creates light curves, and computes a wide variety of statistical properties of the sources. This analysis was performed using AE version 3.79.. The number of extracted events in the total Chandra keV band is compared to the local source-free background level. The statistic measures the probability that the extracted events would be found from random Poisson fluctuations in the local background (see the Appendix of Weisskopf et al., 2007). This use of as a source existence criterion has the advantage of being independent of the poorly understood sensitivity limits of the wavdetect and maximum-likelihood restoration processes in the presence of crowding and spatially varying PSFs.
For our analysis here of the NGC 6634 fields, we choose a significance threshold of source existence () for source existence. A list of candidate sources with was constructed to obtain measurements of local source-free background levels for the Poisson probability calculation. For each source, values are calculated in three X-ray bands ( keV, keV and keV) and, in the region overlapping the two ACIS fields, in both fields, and the lowest value is kept. After four iterations of this procedure in ACIS Extract, where candidate source significances are recalculated based on revised background levels, we emerge with 1607 sources with . These sources are listed in Table 1. Note that we obtain twice as many sources as the 792 sources obtained by Ezoe et al. (2006) using traditional data analysis methods.
Table 1 has a format similar to the source tables in Getman et al. (2005) and Townsley et al. (2006). Column (1) gives the ACIS running sequence number, and column (2) provides the IAU designation. Columns (3)(6) show R.A. and decl. in degrees, positional error in arcseconds, and off-axis angle in arcminutes. Columns (7)(11) give net counts in the full band, the associated 1 equivalent uncertainty based on Poisson statistics, background counts in the extraction region, net counts in the hard band, and the fraction of the PSF used for source extraction. PSF fraction values below indicate source crowding. Column (12) presents the probability of photometric significance when they lie in the range.
Column (13) of Table 1 gives the source s median energy in the full spectral band after background subtraction. The median energy is a reliable surrogate for interstellar gas absorption. For keV, an empirical relationship with the gaseous column density cm-2 is found for pre-main sequence stars in the Orion Nebula Cluster (Feigelson et al., 2005, see their Figure 8). This relationship is also found in a large population of M 17 stars (Getman et al., in preparation) and we assume it applies for NGC 6334 stars here. For normal interstellar gas-to-dust ratios, the column density can be converted to a visual absorption with the traditional relation mag (Gorenstein, 1975) or the revised relation derived from X-ray absorption measurements, mag (Vuong et al., 2003). We use these calibrations between the instrumentally dependent and physical absorption measures repeatedly in the science sections below.
2.3 Stellar Counterparts
Unfortunately, no wide-field, sensitive, and high-resolution near-infrared image has been published covering the ACIS fields of view in NGC 6334. We thus use the 2MASS Point Source Catalog to find stellar counterparts to the X-ray sources. Column (14) in Table 1 gives the magnitude of 2MASS stars lying within 1″ of the X-ray source positions. About half of the Chandra sources have a 2MASS star within 1″, but the majority of these have inaccurate photometry due to nebular contamination, star crowding, or sensitivity limits.
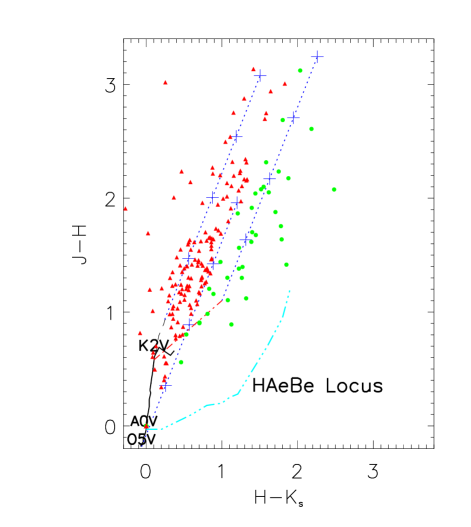
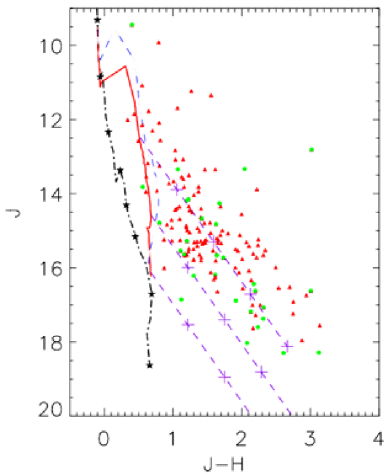
Figure 3 shows color-color and color-magnitude diagrams for the 2MASS stars with photometric errors better than mag in all three bands. The results are similar to diagrams obtained from other Chandra-selected populations in clusters with distances around kpc such as M17 and the Rosette Nebula (Broos et al., 2007; Wang et al., 2008, 2009). The majority of X-ray selected stars do not exhibit -band excesses attributed to the heated inner edges of protoplanetary disks; most would be classified as Class III pre-main sequence stars based on near-infrared photometry. The 2MASS photometric diagrams in Figure 3 show a wide range mag. Noting that the X-ray hardness measure exceeds 3.0 keV ( cm-2 or mag) for many of the X-ray sources without 2MASS counterparts, stellar counterparts for many X-ray sources will be too heavily absorbed to be present in the 2MASS catalog. Our experience with M17 and Rosette where deeper and higher-resolution near-infrared imaging was available also indicates that the 2MASS catalog includes only a fraction of the true stellar population represented by the Chandra sources biased towards those with higher bolometric luminosities, lower obscuration, and locations away from bright nebular emission. Due to these limitations of the 2MASS counterparts, we do not pursue scientific interpretation of these near-infrared sources (e.g., disk fractions, Initial Mass Function).
The final column of Table 1 gives possible associations between X-ray sources and objects from published objects in NGC 6334. These were obtained from the SIMBAD bibliographic database using a ″ positional agreement. The most common possible counterparts are from the shallow survey of Straw & Hyland (1989) with labels FIR-I to FIR-V corresponding to the major far-infrared clusters. We emphasize that some of these associations may not be correct due to positional inaccuracies or offsets between the X-ray and long-wavelength bands.
2.4 Completeness and Contaminants
Our source detection method is complete down to a statistical probability limit which can be converted to an ACIS count limit and, with considerable uncertainty, an X-ray flux limit. The faintest on-axis sources in Table 1 have counts. Based on comparison with other pre-main sequence studies of pre-main sequence populations (e.g., the sensitivity equation (7) in Feigelson et al., 2002), this corresponds to an absorption-corrected luminosity in the keV of erg s-1 for absorption around cm-2. This limit is quite approximate, as it depends on the intrinsic spectrum and cloud absorption; the limit will be a factor of lower for lightly-absorbed sources, several times higher for sources with cm-2, and roughly times higher for sources with cm-2. Significant instrumental spatial variations in sensitivity are also present due to off-axis telescope vignetting and degraded point spread function in each field and to the overlap region between the two exposures. While it is thus difficult to establish a single X-ray completeness limit for the NGC 6334 observations for these reasons, we are confident the most of the observed region is surveyed to a sensitivity better than erg s-1 except for sources suffering extremely high absorption.
Based on the well-established correlation between X-ray luminosity and mass (Telleschi et al., 2007), this sensitivity limit is sufficient to capture most of the cluster members with masses above 1 M⊙ (except for a minority of A and B stars, Stelzer et al., 2006), and some stars between M⊙. A survey complete down to M⊙ detects about 5% of the stellar population (including young brown dwarfs) assuming a standard Initial Mass Function (Chabrier, 2003). We can thus multiply the number of X-ray source by a factor of to estimate the total population of each cluster. This is only an approximation, as the X-ray sensitivity varies with absorption across the field and in the radial direction.
Our method of locating Chandra sources is considerably more sensitive than that used by Ezoe et al. (2006), but it entails several sources of error. Careful examination of the image suggests that several sources located in the wings of strong sources may be artifacts of the processing. We cannot immediately exclude these as spurious because studies of other young stellar clusters establish that close multiple X-ray sources can appear around massive stars (see HD 46150 in the Rosette’s NGC 2244, Wang et al., 2008). Some of the faintest sources are also likely not real, particularly in the densest cluster regions. Recalling that very X-ray faint stars should be present for each detected source, many low mass clusters members are expected to produce counts which are viewed as background by ACIS Extract. In addition, truly diffuse plasma emission from shocked O star winds may present, as discussed by Ezoe et al. (2006). The result of the elevated background is to reduce the statistical significance of real sources and to cause the values of to fluctuate with each iteration of ACIS Extract as different candidate sources are rejected and their photons enter the background. This effect generally leads to a more conservative list of faint sources than an environment without emission from diffuse plasma or unresolved stellar populations. Nonetheless, very weak sources in the most crowded regions have an increased chance to be spurious. Altogether we believe that no more than a few percent of the sources in Table 1 are spurious. Improved methods for pruning the source list in crowded regions are under development (Broos et al., in preparation).
A small fraction of the reliable X-ray sources are not members of the NGC 6334 population. Detailed modeling of contaminant populations in the foreground or background of Galactic Plane molecular clouds at distances around kpc have been made by Getman et al. (2006) and Wang et al. (2007). Scaling these results to the exposures, survey area and distance of NGC 6334, we estimate that sources are extragalactic sources (mostly quasars), are foreground field stars, and are background field stars. Thus, % of the 1607 sources in Table 1 are probably contaminants. However, these sources must be randomly distributed across the field and their contribution to the stellar clusters discussed here will be negligible.
2.5 Defining X-ray clusters
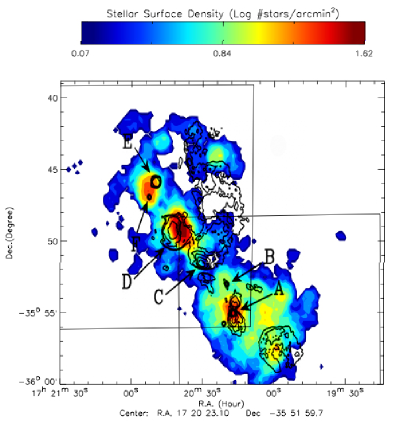
Cursory examination of the ACIS images in Figures 1-2 shows that the spatial distribution of X-ray sources is very inhomogeneous with distinct strong concentrations that represent young stellar clusters. This was previously found by Ezoe et al. (2006); see their Figures 2-3. Adopting the procedure used by Wang et al. (2009), we locate clusters on a map of the X-ray source density obtained by smoothing the locations of the 1607 sources with a Gaussian kernel of width ″ (0.4 pc). Here we ignore the few sources that are likely non-members of the cluster, and consider the X-ray source surface density to represent the stellar surface density of the NGC 6334 population. Note that these are not maps of smoothed X-ray emission; rather, the X-ray stars are viewed individual stars tracing the spatial structure of the full young stellar population. Wang et al. (2009) show that the existence of structures smaller than several arcminutes is not strongly affected by inhomogeneities in the X-ray sensitivity across the mosaic due to reduced sensitivity far off-axis of each pointing and increase sensitivity in the overlap region between adjacent images. Nonetheless, these variations in sensitivity reduce the accuracy of our estimates of cluster richness.
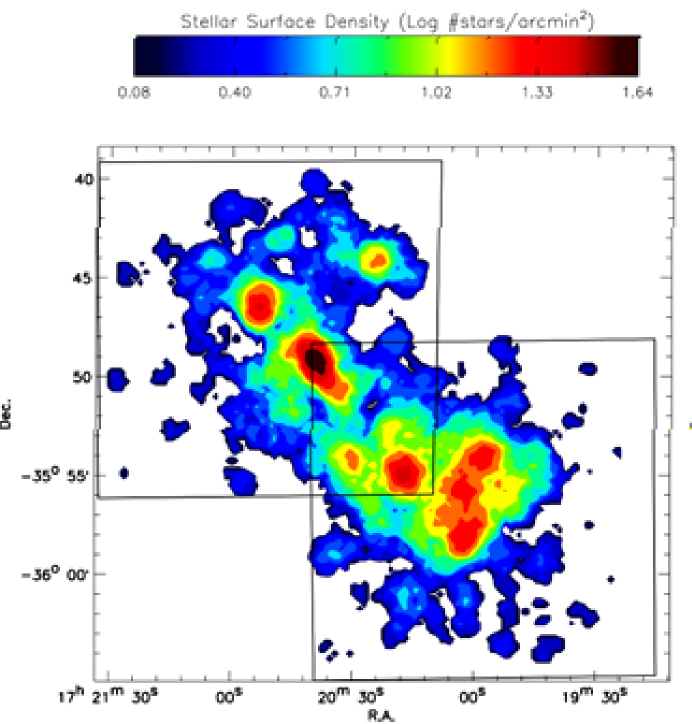
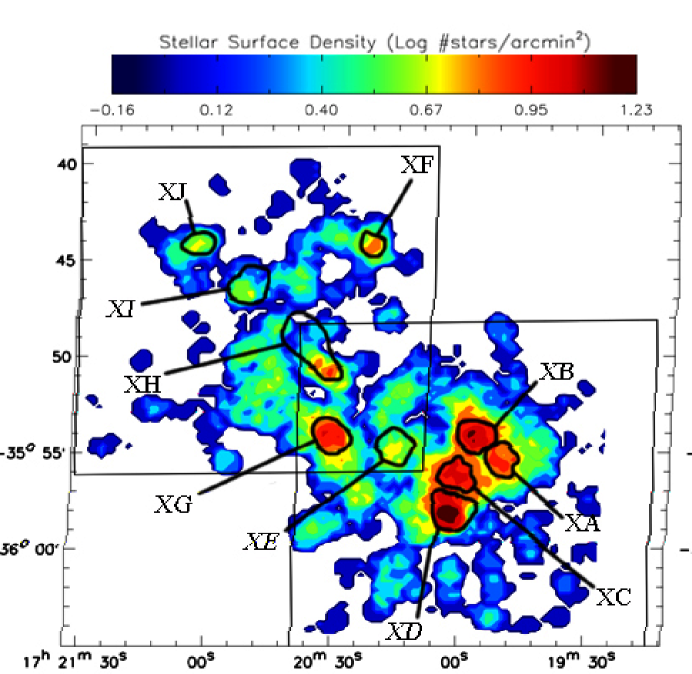
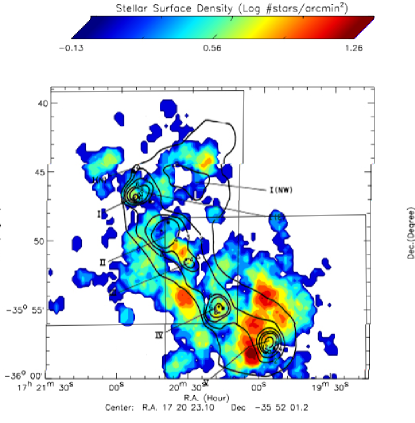
The resulting smoothed stellar surface density map is shown in Figure 4 for the total keV Chandra band, and in Figure 5 for a ‘soft’ and and ‘hard’. Here we choose to divide the sample into soft sources with keV and hard sources with keV; the boundary approximately corresponds to column density cm-2 and visual absorption mag. Hereafter, we refer to these subsamples as the ‘lightly obscured’ and ‘heavily obscured’ X-ray stars and clusters.
We have chosen to define clusters as localized peaks in X-ray source surface density which are at least 10-fold above the background level. This corresponds to the yellow contour in Figure 4 where dark blue represents the background level. Eight or nine clusters can be discerned in this total band map. However, examination of the smoothed soft and hard band stellar surface density maps shows dramatic differences; most clusters are prominent only in one band (Figure 5). From examination of the three smoothed maps, we emerge with a list of ten clusters listed in Table 2 and labeled in Figure 5. The table columns give our designations XA through XJ, central location (accurate to ), indicator of X-ray hardness, approximate extent based on the yellow contour in Figure 4, and the number of X-ray sources found inside this contour for each X-ray cluster. Recall that 1′ corresponds to about 0.5 pc at a distance of 1.7 kpc.
The procedure used here to define X-ray selected clusters based on peaks in a smoothed distribution is not unique. Other statistical techniques can be used: smoothing using different kernel widths; nearest-neighborhood methods (Román-Zúñiga et al., 2008), single-linkage agglomerative clustering (also called the ‘friends-of-friends’ algorithm), maximum-likelihood mixture models assuming Gaussian cluster shapes, and so forth. Each of these methods has advantages and disadvantages, and none gives a unique ‘correct’ result. Wang et al. (2009) compares our procedure to a 10-th nearest neighbor algorithm in a Chandra mosaic of the Rosette Molecular Cloud, and shows that the results are very similar. For any clustering method, the results may not be physically meaningful. For example, it is possible that the four clusters XA-XD represent a single physical structure that appears divided by inhomogeneous obscuration. The confusing effects of variable extinction in NGC 6334 was raised by Lindsay (1955) and others. Our trials in constructing the cluster list with different smoothing and associations between hard and soft structures gave clusters. We conclude that the division of the X-ray sources into ten distinct clusters is a reasonable, but far from unique, result.
2.6 Comparison to Long-Wavelength Studies of NGC 6334
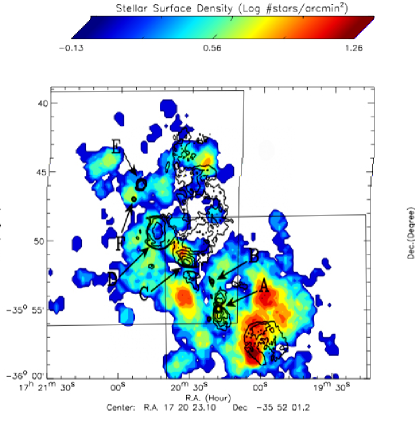
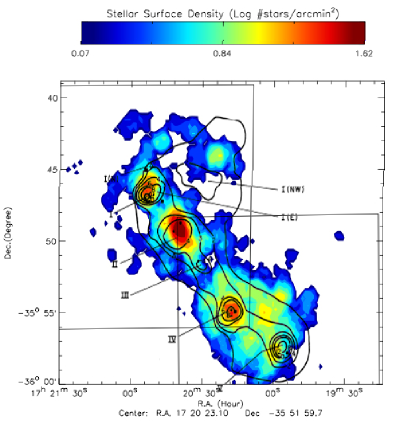
Figure 6 superposes the smoothed X-ray source distributions on wide-field maps at radio and far-infrared wavelengths. The top panels show contours from the Very Large Array 18 cm continuum map of Sarma et al. (2000) with labels for the NGC 6334 A-F HII regions identified by Rodriguez et al. (1982). Higher resolution radio maps of some components are presented by Carral et al. (2002). The bottom panels show a map at 71 m by Loughran et al. (1986) obtained with a balloon-borne telescope with their designations of far-infrared sources I-V. Somewhat higher resolution far-infrared maps from HIRES analysis of the IRAS satellite data appear in Kraemer et al. (1999).
Examination of these map overlays shows that there is a poor correspondence between lightly obscured X-ray clusters and radio/infrared structures, but a good correspondence when heavily obscured X-ray clusters are considered. Thus, XE appears associated with far-infrared IV and radio A, XH is associated with II and D, and XI is associated with far-infrared I and radio E and F. The lightly obscured clusters XA-XD, XF, XG, and XJ have little association with long wavelength structures, although some of the stars we include with XC-XD appear embedded and may be associated with far-infrared V and the southwestern radio shell.
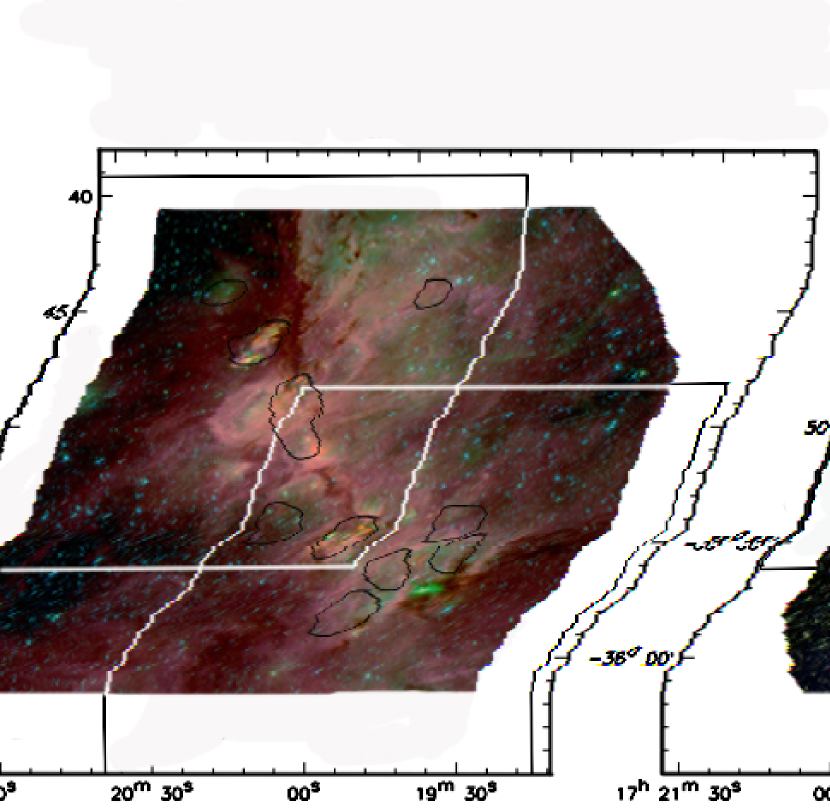
Figure 7 shows the X-ray clusters superposed on the mid-infrared emission observed by the Spitzer GLIMPSE survey (Benjamin et al., 2003). Some association can be seen with the heavily obscured clusters: XE lies in a confused region of bright and dark infrared nebulosities; XH is straddled by large bubbles emerging from the ridge line; and XI coincides with an isolated bright region within a larger dark cloud. There is also a hint that the massive stars in lightly obscured X-ray clusters (particularly XA, XC, XD and XG) have produced bowl-like cavities in the cloud material traced by the Spitzer map. But the relationship between the X-ray maps (which mostly represent lower mass stars) and the mid-infrared maps (which mostly represent heated dust and PAH molecules) is indirect. We do not significantly use the GLIMPSE map in the science analysis of this study, as we focus on the stars rather than the interstellar material.
We proceed with a more detailed examination of individual stars and star groups in various components of NGC 6334, proceeding west to east.
3 STARS AND STELLAR CLUSTERS IN THE CHANDRA POPULATION
3.1 Embedded Stars in NGC 6334 V
A group of faint embedded X-ray sources around ()=() lying behind the lightly absorbed cluster XD can be seen in the hard band image. Its surface density was not high enough to be classified as an X-ray cluster. The group includes sources #218, 219, 226, 228, 234, 236, 248, 249, 252, 266, 270, 282 and 294. Several of the sources exhibit extraordinarily high X-ray absorptions with keV, corresponding to cm-2 and mag based on the calibration discussed in §2.2. In nearby star formation regions, only a handful of young stellar objects with dense localized envelopes have comparable X-ray absorptions including the Class 0/I sources CrA IRS 7 and IC1396N BIMA 2 (Hamaguchi et al., 2005; Getman et al., 2007).
These X-ray sources lie on the southeast side of the NGC 6334 V far-infrared region and surround the embedded B-type protostars producing masers and the infrared emission nebulae IRN V-1 and IRN V-2 Hashimoto et al. (2008). These massive protostars are too heavily obscured to be seen in the near-infrared, consistent with the extreme absorption detected in the nearby X-ray sources which probably represent the most X-ray luminous low mass members of the associated cluster. This grouping bears some resemblance to the cluster of X-ray emitting low mass stars associated with the cluster of B-type protostars in the Kleinman-Low Nebula behind the Orion Nebula with cm-2 (Grosso et al., 2005).
A sparse but compact (diameter pc) group of faint, moderately absorbed X-ray sources appears to be associated with the bright H emission line star SS 303 (K=8.57) and the infrared source NGC 6334 V IRS 1. These include # 302, 305, 306, 310, 311 (= SS 303) and 320 (= NGC 6334 V IRS1). Jackson & Kraemer (1999) suggest that SS 303 ionizes the the southeastern radio shell, G351.20+0.70. Another possible ionizing source is the bright star #210 = FIR-V 51 (K=7.76), although it lies off-center within the radio shell.
3.2 Lightly Obscured Clusters XA-XD
The XA, XB, XC and XD clusters together constitute the largest and richest complex seen in the NGC 6334 region in the X-ray band. It is unclear whether they are structurally distinct structures or part of a single larger cluster subject to inhomogeneous absorption. The latter interpretation is supported by the smoother appearance of the source distribution in the hard band than in the soft band (Figure 5). These X-ray sources are lightly absorbed with E 2.5 keV, and relatively few are present in the hard X-ray maps. This obscuration corresponds to cm-2 and mag.
These X-ray structures have few published counterparts in other wavelengths, perhaps because they are older clusters and no longer embedded in dense cloud cores. The mid-infrared source IRAS 17175-3554 corresponds closely with XC, although we suspect is lies behind the cluster in the cloud interior. Cluster XD can be seen in the near-infrared H2 and band images obtained by Burton et al. (2000, see their Figure 5) where it was associated (perhaps incorrectly) with the embedded far-infrared source NGC 6334-V. Many of the X-ray sources with 2MASS counterparts with are likely low mass cluster members, and some are FIR-V stars from Straw & Hyland (1989). A number of stars bright in both the X-ray and bands are likely high mass cluster members. These include # 210 (= FIR-V 51, see §3.1), 354 (=FIR-V 10), 405 (= FIR-V 102), 415 (= FIR-V 107), 505, 564, and 586. Source #405 = FIR-V 102 () lies in a compact group (diameter pc) of X-ray sources around (,) that can be clearly seen in the X-ray image shown in Figure 2 (bottom panel). This group at the center of the XD cluster has the highest surface density in the NGC 6334 complex.
3.3 Heavily Obscured Cluster XE (HII region NGC 6334 A; FIR NGC 6334 IV)
XE is the most prominent cluster seen in hard X-rays in the southwest quadrant of the NGC 6334 complex. It is only very weakly detected in soft x-rays. XE is spatially associated with the radio HII region NGC 6334 A and the far-infrared stellar cluster NGC 6334 IV. This positional agreement confirms that the hard X-ray band can readily detect and resolve heavily embedded clusters as seen, for example, in Cepheus B (Getman et al., 2006), W3 Main (Feigelson & Townsley, 2008), and the Rosette Molecular cloud (Wang et al., 2009).
XE is a rich and concentrated cluster of obscured X-ray sources associated with far-infrared source FIR IV and the bipolar radio source A. X-ray ranges from around 2 to an extraordinary keV, corresponding to to 23.8 cm-2 or to 300 mag. These unusually heavily obscured sources in XE include #607, 669 (= FIR-IV 43), 692 (= FIR-IV 60), 712 and 715. They likely lie within the dense, pc-diameter molecular clump emitting brightly in high-excitation CS rotational emission lines (Kraemer et al., 1999). As with the group around IRN V-1(§3.1), we emphasize that young stars are rarely seen with keV in other star forming regions (see, for example, the Chandra Orion Ultradeep Project distribution in Feigelson et al., 2005).
Several of these heavily absorbed sources lie near the millimeter sources identified by Sandell (1999). Sources #737 and 739 lie near MM 1a, #712 lies near MM 1b and MM 2, and #712 lies near MM 2. Source #703 with keV (corresponding to cm-2 and ) coincides with the infrared star IRS 20 associated with infrared nebula IRN IV 2 (Hashimoto et al., 2008). The region around MM-3 is studied by Persi et al. (2009); only one of their embedded infrared-excess stars appears as an X-ray source (#757 = IRS 9). There is no concentration of sources around the ″ shell-like radio HII region NGC 6334 A discussed by Carral et al. (2002).
The hard band X-ray cluster XE has a very high stellar surface density and and inferred total stellar population of stars when undetected stars are considered (§2.4). The GLIMPSE image of the region shows a complex of irregular dense dark clouds superposed on bright emission nebulosity. The elongated obscuring material resemble Infrared Dark Clouds (IRDCs) noted in other star forming regions (e.g. Carey et al., 1998; Rathborne et al., 2006). Some of the heavy absorption seen in X-ray stars may be due to these dense obscuring irregular clouds.
3.4 Extragalactic Blazar RCM B
The very bright X-ray source #787 coincides with the compact radio continuum source NGC 6334 B (= RCM B = IGR J17204-3554) which has been widely discussed as a radio-loud active galactic nucleus lying behing the NGC 6334 star forming region (Rodriguez et al., 1988; Trotter et al., 1998; Bassani et al., 2005; Bykov et al., 2006). This source is an order of magnitude too bright for even the most extreme flaring pre-main sequence stars, and has no stellar counterpart corresponding to a cluster OB star. Its ACIS median energy keV (Table 1) indicates heavy absorption corresponding to cm-2 ( mag) consistent with the source lying behind the NGC 6334 cloud and other Galactic Plane material.
3.5 Lightly Obscured Cluster XF
NGC 6334 XF is a small and sparse cluster 0.5 pc across seen best in soft X-rays. It lies 2 pc (projected) north of the star forming ridge that defines the NGC 6334 complex. Cluster membership appears to be dominated by source #821 (), #846 (), and #881 (= CD -35∘11482 = IRAS 17170-3539, , B0.5e). Source #881, with 500 ACIS counts, is the brightest X-ray source in the NGC 6634 complex after the O7 star #972 = FIR-III 13 in cluster XH (§3.7). The unusually bolometrically bright stellar counterpart of # 821 may be a supergiant like HD 319701 and HD 319702 (§3.11). If correct, this suggests that the XF cluster is older than most of the other clusters with its most massive member evolved off of the main sequence.
X-ray absorptions of XF members are typically in the range keV corresponding to cm-2 and mag. The Spitzer GLIMPSE image of this region (Figure 7) shows very dark absorption bands characteristic of IRDCs. The GLIMPSE image shows bright nebular emission throughout the vicinity (previously labeled NGC 6334 I(NW), see Figure 6 bottom left panel), perhaps with an IRDC superposed.
3.6 Lightly Obscured Cluster XG
This cluster in similar to XF, lying off of the molecular ridge and appearing only in the soft X-ray image. The cluster is somewhat richer than XF with X-ray sources, implying a total population around members. It is the only x-ray cluster that is located to the south of the star forming ridge of NGC 6334. Source #911 is an unusually bright X-ray emitter in the cluster. Its stellar counterpart is a heavily reddened star with mag from DENIS catalog photometry. Cluster members have a range of absorptions centered around keV, corresponding to cm-2 and .
3.7 Heavily Obscured Cluster XH (HII region NGC 6334 D; FIR NGC 6334 II)
XH has the highest stellar surface density in the hard X-ray image. It is moderately heavily absorbed with typical keV corresponding to cm-2 or mag. A few of its sources appear in the soft X-ray band on the southwest side; this might be a separate sparse cluster. The X-ray concentration accurately coincides with the far-infrared source NGC 6334 II and, displaced ′ east of the X-ray peak, with the large radio HII region NGC 6334 D (Figure 6). This HII region appears as a bubble-like structure in the GLIMPSE map (Figure 7) and other tracers of heated interstellar material.
The brightest star in XH seen in both the near-infrared and X-ray bands is source #972 coincident with the star known variously as TICID 7374-463 from the Tycho Input Catalog, FIR-III 13 from the near-infrared photometric survey of Straw & Hyland (1989), and IRN III-1 from the near-infrared polarimetric survey of (Hashimoto et al., 2008). With 1653 ACIS counts, it is the brightest X-ray source in NGC 6334, appearing several arcminutes off-axis of both ACIS fields. It was marginally detected as the Einstein Observatory source 2E 1717.1-3548. As it lies 2′ southwest of the dense core of XH and is only moderately absorbed with keV, this star may be better interpreted as a isolated O star rather than as a member of XH. It may be the principal ionizing source of the northern portion of the NGC 6334 C HII region.
Other bright stellar counterparts to X-ray sources in XH include #1291 (= FIR-II-23) and 1312 with , and #953 (= FIR-III 10), 1051, 1107, and 1275 (= FIR III 24) with .
3.8 Heavily Obscured Cluster XI (HII regions NGC 6334 E and F;
FIR NGC 6334 I)
NGC 6334 XI is a small, sparse cluster seen in the hard X-ray band along the molecular ridge of NGC 6334. It corresponds closely to the far-infrared source I (= IRAS 17175-3544) and is centered between the two radio continuum HII regions NGC 6334 E and NGC 6334 F (Figure 6). The HII region NGC 6334 E, centered an arcminute north of the X-ray cluster, has a nearly circular radio continuum shell with ″ diameter and a compact radio source at the middle associated with a very heavily absorbed near-infrared star TPR 161 (Carral et al., 2002). This massive star does not appear in the Chandra image and there is no apparent concentration of lower mass stars within the radio HII region.
Although the XI cluster appears centrally concentrated in the smoothed maps of Figures 4-5, examination of the individual source positions in Figure 2 suggests the cluster may be bifurcated with subclusters centered at (, ) and (, ). The southern X-ray subcluster in cluster XI lies directly on the unusually strong far-infrared source NGC 6334 I with a 60 m flux density Jy and a bolometric luminosity L⊙ (Sandell, 2000). This is the far-infrared source NGC 6334 I and IRAS source 17175-3544. A cluster of near-infrared stars extends over 2′ (Tapia et al., 1996).
At millimeter wavelengths, the core of NGC 6334 I is resolved into several sources, some associated with a cometary ultracompact HII region in radio continuum and masers (Hunter et al., 2006). This is clearly a concentrated subregion of current massive star formation. X-ray sources # 1428, 1429, 1430, 1431, and 1435 lie within a ″ region associated with NGC 6334 I-SMA3, IRS-1E, IRS-I 1 and the bright head of the radio continuum structure. See Hunter et al. (2006), Beuther et al. (2007), Beuther et al. (2008), and Seifahrt et al. (2008) for detailed multiwavelength maps of this crowded subregion. Two X-ray sources in this crowded region have counterparts within 1″ at long wavelengths. Source #1428 with keV (corresponding to cm-2 or mag) coincides with the star IRS-I-1 (Keck II OSCIR designation, De Buizer et al., 2002) or IRS1-W (Very Large Telescope NACO designation, Seifahrt et al., 2008) with estimated spectral type B2. Source #1429 with keV coincides with IRS1-SW seen with the NACO camera (Seifahrt et al., 2008). Several other X-ray sources are present close to this dense core, and the locally high density of photons assigned to detector background strongly suggests that additional fainter sources would be resolved in a longer X-ray exposure.
The cometary ultracompact radio HII region NGC 6334F (= G351.42+0.64; Carral et al., 2002) lies ″ west of the peak concentration of NGC 6334 I and is associated with the far-infrared source IRAS 17175-3544. The moderately strong and absorbed X-ray source #1406 lies within the ″ radio nebula and possibly associated with the near-infrared star TPR 43. It could be an X-ray detection of the exciting star of NGC 6334 F. About 10 unassigned X-ray photons lie within a few arcseconds of #1406, representing either the shocked stellar wind or emission from unresolved faint low-mass stars.
On the northern edge of the X-ray cluster XI lies the important protostellar region called NGC 6334 I(N). This is a strong extended (sub)millimeter continuum emitter associated with M⊙ of dense molecular gas, molecular outflow and maser emission, but no radio or infrared counterparts (Sandell, 2000, and references therein). It has been resolved into a compact cluster of millimeter massive protostars (Hunter et al., 2006). See Beuther et al. (2008) for detailed multiwavelength maps of this subregion. Three faint X-ray sources are detected in the ″ NGC 6334 I(N) subregion: #1447, 1454 and 1463. Sources #1454 and 1463 exhibit extraordinarily high X-ray absorption with keV, corresponding to cm-2 and mag. These are very likely members of the embedded cluster. Source #1454 lies within 1″of the millimeter source SMA 7 and a faint Spitzer IRAC star, while #1463 may be associated with the near-infrared star TPR 216 and/or methanol masers. Source #1447 appears coincident with SMA 6 but, due to its lower X-ray absorption ( keV), may instead be a foreground star.
3.9 Lightly Absorbed Cluster XJ
NGC 6334 XJ is a sparse and small cluster ( 1pc across) seen only in soft x-rays. Its dominant star is the counterpart of #1528, 2UCAC 16657515 with and .
3.10 Absent Clusters
The long-established far-infrared source NGC 6334 III at the center of NGC 6334 is thought to be more evolved than sources at the southwest and northeast extremeties. It has no masers or outflows but is associated with the large, diffuse bipolar HII region NGC 6334 C. The infrared source lies between the lightly-obscured X-ray cluster XG and the heavily obscured cluster XH, but there is no concentration of X-ray sources clearly associated with it or the NGC 6334 C HII region. We suggest that no stellar cluster is present here.
3.11 Unclustered massive stars
A number of X-ray sources with counterparts lie outside the main cluster concentrations. Several bolometrically luminous stars appear as X-ray sources west of the XA-XD clusters. The faint X-ray source #2 coincides with HD 319701 (K=6.76), an isolated and lightly obscured B1Ib supergiant (Neckel, 1978) lying southwest of the XA-XD complex. The faint source #63 similarly lies southwest of the main clusters and appears to be associated with a heavily absorbed massive star. Several other sources bright both in the X-ray and bands are distributed in this region are likely previously unnoticed massive stars (e.g., # 77, 79, 108 and 130).
The bolometrically brightest of these stars are counterparts of #564 with a counterpart lying northeast of XB, #949 with a counterparts lying north of XG, and #972 near cluster XH discussed in §3.7. Other apparently massive stars distributed across the field include # 628, 719, 726, 728, 748, 757, 817, 890, 953 and 1051. These may be massive or intermediate-mass stars that have drifted or been ejected from one of the rich clusters.
Source #1371 coincides with the X-ray and bolometrically bright star HD 319702 () on the eastern side of the NGC 6334 complex, several arcminutes south of cluster XI. It has been spectroscopically classified as a B1Ib supergiant (Neckel, 1978) and a O8 III((f)) giant (Walborn, 1982). Although HD 319701 and HD 319702 were identified as the exciting stars of the NGC 6334 HII region in early work (e.g., Sharpless, 1959), it now appears likely that they are older stars that have drifted from the main concentrations of heated molecular gas. Other optically bright O stars commonly associated with NGC 6334 (HD 156738, 319699 and 319703) lie outside the Chandra fields of view. HD 319703 is a bright X-ray source detected with the Einstein Observatory (Chlebowski et al., 1989).
4 DISCUSSION AND CONCLUSIONS
This Chandra-based study of the stellar population in the NGC 6334 star forming region must be viewed as preliminary in several respects. First, the construction of the sensitive catalog of X-ray sources has deficiencies. Some of the faintest sources may be spurious, source properties such as X-ray luminosities are not estimated, and inhomogeneities in the survey coverage are not quantitatively treated. Second, the exposures are short so that only % of the full Initial Mass Function is detected. Third, the interpretation of X-ray photons which are not assigned to resolved sources is not addressed here: do they arise from fainter X-ray stars which must be present in the clusters (§2.4), or from diffuse plasma from shocked O star winds (Ezoe et al., 2006)? Both the incompleteness of the X-ray catalog to faint cluster members, and the interpretation of these unassigned photons, require substantially longer Chandra exposures than available for this study. Fourth, the association of X-ray sources with near-infrared sources is inadequate. The 2MASS catalog has insufficient resolution to resolve crowded cluster regions and to obtain reliable photometry in the presence of spatially complex nebular emission. Scientific inferences from infrared color-magnitude and color-color diagrams, such as Initial Mass Functions and protoplanetary disk fractions, can not be reliably obtained.
Despite these deficiencies, our survey represents the deepest penetration into the Initial Mass Function of the young population over the full NGC 6334 region, and is effective in identifying both dozens of luminous OB stars (many of which were not previously identified) and hundreds of lower mass members of concentrated stellar clusters. These advantages accrue in large part to the low contamination of the X-ray selected population by extraneous sources. The principal results are:
-
1.
A catalog of 1607 faint X-ray sources is presented, most with subarcsecond positions. Although only half have 2MASS counterparts, we infer from past studies that % of these sources are likely cluster members. The remaining sources are extragalactic and stars unrelated to NGC 6334. The X-ray survey suffers far less contamination from Galactic field stars or diffuse nebular emission than infrared surveys, and should be nearly unbiased with respect to protoplanetary disk emission. In addition, we obtain estimates of line-of-sight absorption to each source individually from the median energy of its detected photons.
-
2.
The X-ray exposures are roughly complete to erg s-1. Based on X-ray studies of the stellar populations in the nearby Taurus and Orion clouds, this sensitivity captures the top % of the pre-main sequence X-ray luminosity function and most of the cluster members with masses above 1 M⊙. The total inferred population of NGC 6334 is around stars.
-
3.
The spatial distribution of X-ray sources is very inhomogeneous and differs greatly when lightly obscured sources are compared to heavily obscured sources. From smoothed maps of the source distribution, ten X-ray selected clusters are identified, labeled XA to XJ. Seven of the clusters are mostly seen in the soft X-ray band and, with out exception, were previously unnoticed in visible, infrared or radio studies. The three hard-band X-ray clusters, plus a small group behind clusters XC-XD, are closely associated with well-studied luminous far-infrared clusters. HII regions are loosely associated with these clusters, but are not generally concentrated in the center of the clusters.
-
4.
The X-ray population includes some of the previously identified OB stars, and detected a considerable number of additional stars with band magnitudes indicative of new OB members. Some of the massive stars are dispersed across the X-ray fields, several parsecs from the concentrations of current star formation. At least two appear to be (super)giants. This suggests that these massive stars have either drifted or been ejected from their natal sites, and that star formation has been ongoing in NGC 6334 for several million years or longer.
-
5.
The X-ray population also includes some extraordinarily obscured sources with X-ray absorption up to cm-2 or mag. It is likely that such high absorptions cannot be produced by interstellar cloud material, but more likely by localized infalling envelopes around protostars (Getman et al., 2006). Several of these sources emit mostly in the submillimeter band, an indicator of Class 0 classification. These include well-studied systems in NGC 6334 I, NGC 6334 I(N), NGC 6334 IV, and NGC 6334 V. If some of these X-ray sources are truly massive Class 0 protostars known from submillimeter studies; they may be the youngest stars ever detected in the X-ray band. The only comparably embedded systems reported in the X-ray band are the lower-mass Class 0-I sources IRS 7 in Coronal Australis cloud with cm-2 and IRAS 21391+5802 with cm-2 in the triggered cloudlet IC 1396N (Hamaguchi et al., 2005; Getman et al., 2007). We note, however, that it is difficult with the available data to distinguish emission from the submillimeter source itself from closely associated lower mass pre-main sequence stars. For example, the Becklin-Neugebauer Object in the OMC-1 core behind the Orion Nebula is a very faint X-ray source lying only ″ ( AU) from a much more X-ray luminous lower mass companion (Grosso et al., 2005).
It is clear that there is great promise in further study of the stellar population of NGC 6334 based the results obtained here. First, the existing 40 ks Chandra exposures are photon-starved, with most detections having 10 counts and the vast majority of lower mass stars undetected. A 10-fold increase in exposure would alleviate this problem and provide an empirical basis for interpreting the unresolved X-ray emission as stellar or diffuse. Second, wide-field, near- and mid-infrared images with sub-arcsecond resolution are urgently needed for comparison with the X-ray source catalog. The challenge here is less reaching high sensitivity, as the counterparts to the X-ray sources will mostly have , as resolving stars from the bright, spatially complex nebular emission. Third, near-infrared spectroscopy of X-ray selected stars would provide spectral types and direct estimates of stellar masses. The highest priority for spectra are the counterparts which are likely new OB members of the cluster.
References
- Albacete Colombo et al. (2007) Albacete Colombo, J. F., Caramazza, M., Flaccomio, E., Micela, G., & Sciortino, S. 2007, A&A, 474, 495
- Baraffe et al. (1998) Baraffe, I., Chabrier, G., Allard, F., & Hauschildt, P. H. 1998, A&A, 337, 403
- Bassani et al. (2005) Bassani, L., et al. 2005, ApJ, 634, L21
- Benjamin et al. (2003) Benjamin, R. A., et al. 2003, PASP, 115, 953
- Bessell & Brett (1988) Bessell, M. S., & Brett, J. M. 1988, PASP, 100, 1134
- Beuther et al. (2007) Beuther, H., Walsh, A. J., Thorwirth, S., Zhang, Q., Hunter, T. R., Megeath, S. T., & Menten, K. M. 2007, A&A, 466, 989
- Beuther et al. (2008) Beuther, H., Walsh, A. J., Thorwirth, S., Zhang, Q., Hunter, T. R., Megeath, S. T., & Menten, K. M. 2008, A&A, 481, 169
- Broos et al. (2007) Broos, P. S., Feigelson, E. D., Townsley, L. K., Getman, K. V., Wang, J., Garmire, G. P., Jiang, Z. & Tsuboi, Y. 2007, ApJS, 169, 353
- Burton et al. (2000) Burton, M. G., et al. 2000, ApJ, 542, 359
- Bykov et al. (2006) Bykov, A. M., et al. 2006, ApJ, 649, L21
- Carey et al. (1998) Carey, S. J., Clark, F. O., Egan, M. P., Price, S. D., Shipman, R. F., & Kuchar, T. A. 1998, ApJ, 508, 721
- Carral et al. (2002) Carral, P., Kurtz, S. E., Rodríguez, L. F., Menten, K., Cantó, J., & Arceo, R. 2002, AJ, 123, 2574
- Chabrier (2003) Chabrier, G. 2003, PASP, 115, 763
- Chlebowski et al. (1989) Chlebowski, T., Harnden, F. R., Jr., & Sciortino, S. 1989, ApJ, 341, 427
- Cohen et al. (2003) Cohen, D. H., de Messières, G. E., MacFarlane, J. J., Miller, N. A., Cassinelli, J. P., Owocki, S. P., & Liedahl, D. A. 2003, ApJ, 586, 495
- De Buizer et al. (2002) De Buizer, J. M., Radomski, J. T., Piña, R. K., & Telesco, C. M. 2002, ApJ, 580, 305
- Ezoe et al. (2006) Ezoe, Y., Kokubun, M., Makishima, K., Sekimoto, Y., & Matsuzaki, K. 2006, ApJ, 638, 860
- Feigelson et al. (2002) Feigelson, E. D., Broos, P., Gaffney, J. A., III, Garmire, G., Hillenbrand, L. A., Pravdo, S. H., Townsley, L., & Tsuboi, Y. 2002, ApJ, 574, 258
- Feigelson et al. (2005) Feigelson, E. D., et al. 2005, ApJS, 160, 379
- Feigelson et al. (2007) Feigelson, E., Townsley, L., Güdel, M., & Stassun, K. 2007, Protostars and Planets V, 313
- Feigelson & Townsley (2008) Feigelson, E. D., & Townsley, L. K. 2008, ApJ, 673, 354
- Freeman et al. (2002) Freeman, P. E., Kashyap, V., Rosner, R., & Lamb, D. Q. 2002, ApJS, 138, 185
- Gagné et al. (2005) Gagné, M., Oksala, M. E., Cohen, D. H., Tonnesen, S. K., ud-Doula, A., Owocki, S. P., Townsend, R. H. D., & MacFarlane, J. J. 2005, ApJ, 628, 986
- Garmire et al. (2003) Garmire, G. P., Bautz, M. W., Ford, P. G., Nousek, J. A., G. R., Jr. 2003, Proc. SPIE, 4851, 28
- Getman et al. (2005) Getman, K. V., et al. 2005, ApJS, 160, 319
- Getman et al. (2006) Getman, K. V., Feigelson, E. D., Townsley, L., Broos, P., Garmire, G., & Tsujimoto, M. 2006, ApJS, 163, 306
- Getman et al. (2007) Getman, K. V., Feigelson, E. D., Garmire, G., Broos, P., & Wang, J. 2007, ApJ, 654, 316
- Gorenstein (1975) Gorenstein, P. 1975, ApJ, 198, 95
- Grosso et al. (2005) Grosso, N., et al. 2005, ApJS, 160, 530
- Güdel et al. (2007) Güdel, M., et al. 2007, A&A, 468, 353
- Hamaguchi et al. (2005) Hamaguchi, K., Corcoran, M. F., Petre, R., White, N. E., Stelzer, B., Nedachi, K., Kobayashi, N., & Tokunaga, A. T. 2005, ApJ, 623, 291
- Hashimoto et al. (2008) Hashimoto, J., et al. 2008, ApJ, 677, L39
- Hunter et al. (2006) Hunter, T. R., Brogan, C. L., Megeath, S. T., Menten, K. M., Beuther, H., & Thorwirth, S. 2006, ApJ, 649, 888
- Jackson & Kraemer (1999) Jackson, J. M., & Kraemer, K. E. 1999, ApJ, 512, 260
- Kraemer et al. (1999) Kraemer, K. E., Deutsch, L. K., Jackson, J. M., Hora, J. L., Fazio, G. G., Hoffmann, W. F., & Dayal, A. 1999, ApJ, 516, 817
- Lada & Adams (1992) Lada, C. J., & Adams, F. C. 1992, ApJ, 393, 278
- Lindsay (1955) Lindsay, E. M. 1955, Irish Astronomical Journal, 3, 182
- Loughran et al. (1986) Loughran, L., McBreen, B., Fazio, G. G., Rengarajan, T. N., Maxson, C. W., Serio, S., Sciortino, S., & Ray, T. P. 1986, ApJ, 303, 629
- Lucy (1974) Lucy, L. B. 1974, AJ, 79, 745
- Matthews et al. (2008) Matthews, H. E., McCutcheon, W. H., Kirk, H., White, G. J., & Cohen, M. 2008, AJ, 136, 2083
- McBreen et al. (1983) McBreen, B., Jaffe, D. T., & Fazio, G. G. 1983, AJ, 88, 835
- Meyer et al. (1997) Meyer, M. R., Calvet, N., & Hillenbrand, L. A. 1997, AJ, 114, 288
- Moran & Rodriguez (1980) Moran, J. M., & Rodriguez, L. F. 1980, ApJ, 236, L159
- Mori et al. (2001) Mori, K., Tsunemi, H., Miyata, E., Baluta, C. J., Burrows, D. N., Garmire, G. P., & Chartas, G. 2001, New Century of X-ray Astronomy, 251, 576
- Muñoz et al. (2007) Muñoz, D. J., Mardones, D., Garay, G., Rebolledo, D., Brooks, K., & Bontemps, S. 2007, ApJ, 668, 906
- Neckel (1978) Neckel, T. 1978, A&A, 69, 51
- Persi et al. (2000) Persi, P., Tapia, M., & Roth, M. 2000, A&A, 357, 1020
- Persi & Tapia (2008) Persi, P., & Tapia, M. 2008, in Handbook of Star Forming Regions, vol II, San Francisco: Astro. Soc. Pacific, 456
- Persi et al. (2009) Persi, P., Tapia, M., Roth, M., & Gómez, M. 2009, A&A, 493, 571
- Rathborne et al. (2006) Rathborne, J. M., Jackson, J. M., & Simon, R. 2006, ApJ, 641, 389
- Rho et al. (2004) Rho, J., Ramírez, S. V., Corcoran, M. F., Hamaguchi, K., & Lefloch, B. 2004, ApJ, 607, 904
- Rodriguez et al. (1982) Rodriguez, L. F., Canto, J., & Moran, J. M. 1982, ApJ, 255, 103
- Rodriguez et al. (1988) Rodriguez, L. F., Canto, J., & Moran, J. M. 1988, ApJ, 333, 801
- Román-Zúñiga et al. (2008) Román-Zúñiga, C. G., Elston, R., Ferreira, B., & Lada, E. A. 2008, ApJ, 672, 861
- Sana et al. (2006) Sana, H., Rauw, G., Nazé, Y., Gosset, E., & Vreux, J.-M. 2006, MNRAS, 372, 661
- Sandell (1999) Sandell, G. 1999, A&A, 343, 281
- Sandell (2000) Sandell, G. 2000, A&A, 358, 242
- Sarma et al. (2000) Sarma, A. P., Troland, T. H., Roberts, D. A., & Crutcher, R. M. 2000, ApJ, 533, 271
- Schulz et al. (2003) Schulz, N. S., Canizares, C., Huenemoerder, D., & Tibbets, K. 2003, ApJ, 595, 365
- Seifahrt et al. (2008) Seifahrt, A., Thorwirth, S., Beuther, H., Leurini, S., Brogan, C. L., Hunter, T. R., Menten, K. M., & Stecklum, B. 2008, J. Physics Conf. Ser., 131, 012030
- Sekimoto et al. (2000) Sekimoto, Y., Matsuzaki, K., Kamae, T., Tatematsu, K., Yamamoto, S., & Umemoto, T. 2000, PASJ, 52, L31
- Sharpless (1959) Sharpless, S. 1959, ApJS, 4, 257
- Siess et al. (2000) Siess, L., Dufour, E., & Forestini, M. 2000, A&A, 358, 593
- Skinner et al. (2005) Skinner, S. L., Zhekov, S. A., Palla, F., & Barbosa, C. L. D. R. 2005, MNRAS, 361, 191
- Stelzer et al. (2006) Stelzer, B., Huélamo, N., Micela, G., & Hubrig, S. 2006, A&A, 452, 1001
- Straw & Hyland (1989) Straw, S. M., & Hyland, A. R. 1989, ApJ, 340, 318
- Straw et al. (1989) Straw, S. M., Hyland, A. R., & McGregor, P. J. 1989, ApJS, 69, 99
- Tapia et al. (1996) Tapia, M., Persi, P., & Roth, M. 1996, A&A, 316, 102
- Telleschi et al. (2007) Telleschi, A., Güdel, M., Briggs, K. R., Audard, M., & Palla, F. 2007, A&A, 468, 425
- Townsley et al. (2003) Townsley, L. K., Feigelson, E. D., Montmerle, T., Broos, P. S., Chu, Y.-H., & Garmire, G. P. 2003, ApJ, 593, 874
- Townsley et al. (2006) Townsley, L. K., Broos, P. S., Feigelson, E. D., Garmire, G. P., & Getman, K. V. 2006, AJ, 131, 2164
- Trotter et al. (1998) Trotter, A. S., Moran, J. M., & Rodriguez, L. F. 1998, ApJ, 493, 666
- Vuong et al. (2003) Vuong, M. H., Montmerle, T., Grosso, N., Feigelson, E. D., Verstraete, L., & Ozawa, H. 2003, A&A, 408, 581
- Walborn (1982) Walborn, N. R. 1982, AJ, 87, 1300
- Wang et al. (2007) Wang, J., Townsley, L. K., Feigelson, E. D., Getman, K. V., Broos, P. S., Garmire, G. P., & Tsujimoto, M. 2007, ApJS, 168, 100
- Wang et al. (2008) Wang, J., Townsley, L. K., Feigelson, E. D., Broos, P. S., Getman, K. V., Román-Zúñiga, C. G., & Lada, E. 2008, ApJ, 675, 464
- Wang et al. (2009) Wang, J., Townsley, L. K., Feigelson, E. D., Broos, P. S., Getman, K. V., Román-Zúñiga, C. G., & Lada, E. 2009, ApJ, in press
- Weisskopf et al. (2002) Weisskopf, M. C., Brinkman, B., Canizares, C., Garmire, G., Murray, S., & Van Speybroeck, L. P. 2002, PASP, 114, 1
- Weisskopf et al. (2007) Weisskopf, M. C., Wu, K., Trimble, V., O’Dell, S. L., Elsner, R. F., Zavlin, V. E., & Kouveliotou, C. 2007, ApJ, 657, 1026
- Wolk et al. (2006) Wolk, S. J., Spitzbart, B. D., Bourke, T. L., & Alves, J. 2006, AJ, 132, 1100
![[Uncaptioned image]](/html/0905.0716/assets/x8.png)
| Source | Position | X-ray Properties | Star | |||||||||||
|---|---|---|---|---|---|---|---|---|---|---|---|---|---|---|
| Seq. | CXOU J | (J2000.0) | PSF | Pos. ID | ||||||||||
| (deg) | (deg) | (”) | (’) | (cts) | (cts) | (cts) | (cts) | (keV) | (mag) | |||||
| (1) | (2) | (3) | (4) | (5) | (6) | (7) | (8) | (9) | (10) | (11) | (12) | (13) | (14) | (15) |
| 1424 | 172053.21354305.7 | 260.221741 | -35.718252 | 0.2 | 4.2 | 4.9 | 2.8 | 0.1 | 5.0 | 0.39 | -5.0 | 3.7 | SM 6 | |
| 1425 | 172053.30354943.2 | 260.222091 | -35.828676 | 0.3 | 2.4 | 2.8 | 2.3 | 0.2 | 1.9 | 0.89 | -3.0 | 2.0 | ||
| 1426 | 172053.34354136.7 | 260.222287 | -35.693554 | 0.8 | 5.7 | 4.7 | 3.0 | 1.3 | 3.0 | 0.90 | -3.1 | 3.5 | ||
| 1427 | 172053.37354329.4 | 260.222395 | -35.724858 | 0.4 | 3.8 | 5.6 | 3.0 | 0.4 | 5.8 | 0.90 | -5.0 | 4.2 | ||
| 1428 | 172053.41354701.7 | 260.222549 | -35.783810 | 0.1 | 0.3 | 13.8 | 4.3 | 0.2 | 11.8 | 0.71 | -5.0 | 2.8 | 10.39 | IRS-I = IRN I-1 = I(N)-SMA 3 |
| 1429 | 172053.44354704.2 | 260.222677 | -35.784503 | 0.2 | 0.3 | 4.6 | 2.8 | 0.4 | 3.6 | 0.83 | -4.1 | 3.0 | ||
| 1430 | 172053.48354702.3 | 260.222866 | -35.783987 | 0.1 | 0.3 | 3.8 | 2.5 | 0.2 | 2.8 | 0.62 | -4.2 | 3.1 | 10.6: | |
| 1431 | 172053.55354704.6 | 260.223137 | -35.784620 | 0.1 | 0.2 | 9.0 | 3.7 | 1.0 | 9.0 | 0.51 | -5.0 | 4.1 | ||
| 1432 | 172053.56355029.2 | 260.223199 | -35.841458 | 2.3 | 5.4 | 1.0 | 4.4 | 13.0 | 0.0 | 0.90 | -5.0 | 1.2 | 12.79 | |
| 1433 | 172053.57354600.7 | 260.223221 | -35.766872 | 0.2 | 1.3 | 2.8 | 2.3 | 0.2 | 2.8 | 0.90 | -3.3 | 5.4 | ||
| 1434 | 172053.58354636.0 | 260.223279 | -35.776668 | 0.2 | 0.7 | 4.8 | 2.8 | 0.2 | 2.9 | 0.90 | -5.0 | 2.1 | 12.79 | FIR-I 18 = TPR 117 |
| 1435 | 172053.60354704.3 | 260.223339 | -35.784538 | 0.1 | 0.3 | 5.6 | 3.0 | 0.4 | 5.6 | 0.41 | -4.9 | 4.3 | ||
| 1436 | 172053.64354548.5 | 260.223502 | -35.763493 | 0.1 | 1.5 | 8.0 | 3.4 | 0.0 | 8.0 | 0.41 | -5.0 | 4.1 | ||
| 1437 | 172053.65354650.0 | 260.223553 | -35.780566 | 0.2 | 0.5 | 3.8 | 2.5 | 0.2 | 3.8 | 0.90 | -4.7 | 4.2 | TPR 83 | |
| 1438 | 172053.76354642.4 | 260.224023 | -35.778449 | 0.2 | 0.6 | 3.8 | 2.5 | 0.2 | 3.9 | 0.89 | -5.0 | 3.1 | TPR 105 | |
| 1439 | 172053.79354537.0 | 260.224127 | -35.760301 | 0.2 | 1.7 | 3.8 | 2.5 | 0.2 | 0.8 | 0.90 | -4.7 | 1.5 | TPR 197 | |
| 1440 | 172053.84354620.0 | 260.224356 | -35.772224 | 0.1 | 1.0 | 3.0 | 2.3 | 0.0 | 2.0 | 0.39 | -5.0 | 2.8 | TPR 148 | |
| 1441 | 172053.97354639.4 | 260.224885 | -35.777635 | 0.2 | 0.7 | 4.8 | 2.8 | 0.2 | 4.9 | 0.89 | -5.0 | 3.3 | 12.6: | FIR-I 16 = TPR 111 |
| 1442 | 172054.04354548.5 | 260.225205 | -35.763475 | 0.2 | 1.5 | 5.8 | 3.0 | 0.2 | 5.8 | 0.90 | -5.0 | 4.5 | TPR 185 | |
| 1443 | 172054.14354605.7 | 260.225603 | -35.768258 | 0.2 | 1.2 | 6.8 | 3.2 | 0.2 | 6.9 | 0.90 | -5.0 | 4.2 | TPR 160 | |
Note. — Table 1 is available in its entirety in the electronic edition of the Journal. Only a portion of the table around NGC 6334 I(N) is shown here.
Col. (1): X-ray catalog sequence number, sorted by RA.
Col. (2): IAU designation.
Cols. (3) and (4): Right ascension and declination for epoch (J2000.0).
Col. (5): Estimated standard deviation of the random component of the position error, . The single-axis position errors, and , are estimated from the single-axis standard deviations of the PSF inside the extraction region and the number of counts extracted.
Col. (6): Off-axis angle.
Cols. (7) and (8): Net counts extracted in the total energy band (0.5–8 keV); average of the upper and lower errors on col. (7).
Col. (9): Background counts expected in the source extraction region (total band).
Col. (10): Net counts extracted in the hard energy band (2–8 keV).
Col. (11): Fraction of the PSF (at 1.5 keV) enclosed within the extraction region. A reduced PSF fraction (significantly below 90%) may indicate that the source is in a crowded region.
Col. (12): Log of the probability that the source arises from fluctuations in the local background based on Poisson statistics.
Col. (13): Background-corrected median photon energy (total band).
Col. (14): magnitude of 2MASS Point Source Catalog stars within 1″ of the X-ray position. “:” indicates photometric confusion by a nearby star or nebular emission, or photometric accuracy worse than mag. “” indicates source was detected in the or bands but not the band.
Col. (15): Possible counterparts within 3″ of the X-ray source in the SIMBAD database of published objects. FIR-V sources are from Straw & Hyland (1989), TPR stars are from Tapia et al. (1996), and other designations are discussed in the text.
| X-ray Clusters | IRAS | FIR | Radio | ||||||
|---|---|---|---|---|---|---|---|---|---|
| ID | Soft | Hard | Extent | ||||||
| (1) | (2) | (3) | (4) | (5) | (6) | (7) | (8) | (9) | (10) |
| XA | 17:19:54 | -35:55:30 | Y | N | 9 | ||||
| XB | 17:19:58 | -35:54:00 | Y | W | 31 | ||||
| XC | 17:20:02 | -35:56:00 | Y | W | 36 | nr 17165-3554 | |||
| XD | 17:20:04 | -35:58:15 | Y | W | 43 | V | |||
| XE | 17:20:18 | -35:55:00 | W | Y | 48 | IV | A | ||
| XF | 17:20:24 | -35:44:15 | Y | W | 7 | ||||
| XG | 17:20:33 | -35:54:00 | Y | N | 25 | ||||
| XH | 17:20:38 | -35:49:00 | Y | W | 94 | 17172-3548 | II | D | |
| XI | 17:20:53 | -35:46:00 | N | Y | 15 | 17175-3544 | I, I(N) | E, F | |
| XJ | 17:21:05 | -35:44:00 | Y | N | 5 | ||||
Note. —
Col. (1): X-ray Cluster designation
Col. (2) and (3): Right ascension and declination for epoch (J2000.0)
Col. (4)and (5): Indicator of cluster richness in soft (col. 4) and hard (col. 5) band: Y = Yes, N = No, W = Weak
Col. (6): The spatial extent of the x-ray cluster, rounded to the nearest arcminute.
Col. (7): X-ray source count in the X-ray cluster.
Cols. (8): IRAS point source catalog counterpart. nr = near.
Cols. (9): Far-infrared counterpart (Loughran et al., 1986)
Cols. (10): Radio HII region counterpart (Rodriguez et al., 1982).