Measurements of Charmless Hadronic
Penguin Decays in the Final State and First Observation of
S.-H. Kyeong
Yonsei University, Seoul
Y.-J. Kwon
Yonsei University, Seoul
I. Adachi
High Energy Accelerator Research Organization (KEK), Tsukuba
H. Aihara
Department of Physics, University of Tokyo, Tokyo
A. M. Bakich
University of Sydney, Sydney, New South Wales
V. Balagura
Institute for Theoretical and Experimental Physics, Moscow
E. Barberio
University of Melbourne, School of Physics, Victoria 3010
A. Bay
École Polytechnique Fédérale de Lausanne (EPFL), Lausanne
K. Belous
Institute of High Energy Physics, Protvino
M. Bischofberger
Nara Women’s University, Nara
A. Bozek
H. Niewodniczanski Institute of Nuclear Physics, Krakow
M. Bračko
University of Maribor, Maribor
J. Stefan Institute, Ljubljana
T. E. Browder
University of Hawaii, Honolulu, Hawaii 96822
M.-C. Chang
Department of Physics, Fu Jen Catholic University, Taipei
Y. Chao
Department of Physics, National Taiwan University, Taipei
A. Chen
National Central University, Chung-li
B. G. Cheon
Hanyang University, Seoul
C.-C. Chiang
Department of Physics, National Taiwan University, Taipei
I.-S. Cho
Yonsei University, Seoul
Y. Choi
Sungkyunkwan University, Suwon
J. Dalseno
High Energy Accelerator Research Organization (KEK), Tsukuba
A. Das
Tata Institute of Fundamental Research, Mumbai
A. Drutskoy
University of Cincinnati, Cincinnati, Ohio 45221
W. Dungel
Institute of High Energy Physics, Vienna
S. Eidelman
Budker Institute of Nuclear Physics, Novosibirsk
Novosibirsk State University, Novosibirsk
N. Gabyshev
Budker Institute of Nuclear Physics, Novosibirsk
Novosibirsk State University, Novosibirsk
P. Goldenzweig
University of Cincinnati, Cincinnati, Ohio 45221
H. Ha
Korea University, Seoul
J. Haba
High Energy Accelerator Research Organization (KEK), Tsukuba
B.-Y. Han
Korea University, Seoul
T. Hara
High Energy Accelerator Research Organization (KEK), Tsukuba
Y. Hasegawa
Shinshu University, Nagano
K. Hayasaka
Nagoya University, Nagoya
H. Hayashii
Nara Women’s University, Nara
Y. Hoshi
Tohoku Gakuin University, Tagajo
H. J. Hyun
Kyungpook National University, Taegu
K. Inami
Nagoya University, Nagoya
A. Ishikawa
Saga University, Saga
R. Itoh
High Energy Accelerator Research Organization (KEK), Tsukuba
M. Iwasaki
Department of Physics, University of Tokyo, Tokyo
N. J. Joshi
Tata Institute of Fundamental Research, Mumbai
D. H. Kah
Kyungpook National University, Taegu
J. H. Kang
Yonsei University, Seoul
P. Kapusta
H. Niewodniczanski Institute of Nuclear Physics, Krakow
N. Katayama
High Energy Accelerator Research Organization (KEK), Tsukuba
T. Kawasaki
Niigata University, Niigata
H. O. Kim
Kyungpook National University, Taegu
J. H. Kim
Sungkyunkwan University, Suwon
Y. I. Kim
Kyungpook National University, Taegu
Y. J. Kim
The Graduate University for Advanced Studies, Hayama
K. Kinoshita
University of Cincinnati, Cincinnati, Ohio 45221
B. R. Ko
Korea University, Seoul
S. Korpar
University of Maribor, Maribor
J. Stefan Institute, Ljubljana
P. Križan
Faculty of Mathematics and Physics, University of Ljubljana, Ljubljana
J. Stefan Institute, Ljubljana
R. Kumar
Panjab University, Chandigarh
M. J. Lee
Seoul National University, Seoul
T. Lesiak
H. Niewodniczanski Institute of Nuclear Physics, Krakow
T. Kościuszko Cracow University of Technology, Krakow
J. Li
University of Hawaii, Honolulu, Hawaii 96822
C. Liu
University of Science and Technology of China, Hefei
Y. Liu
Nagoya University, Nagoya
R. Louvot
École Polytechnique Fédérale de Lausanne (EPFL), Lausanne
A. Matyja
H. Niewodniczanski Institute of Nuclear Physics, Krakow
S. McOnie
University of Sydney, Sydney, New South Wales
K. Miyabayashi
Nara Women’s University, Nara
H. Miyata
Niigata University, Niigata
Y. Miyazaki
Nagoya University, Nagoya
R. Mizuk
Institute for Theoretical and Experimental Physics, Moscow
Y. Nagasaka
Hiroshima Institute of Technology, Hiroshima
E. Nakano
Osaka City University, Osaka
M. Nakao
High Energy Accelerator Research Organization (KEK), Tsukuba
Z. Natkaniec
H. Niewodniczanski Institute of Nuclear Physics, Krakow
S. Nishida
High Energy Accelerator Research Organization (KEK), Tsukuba
K. Nishimura
University of Hawaii, Honolulu, Hawaii 96822
O. Nitoh
Tokyo University of Agriculture and Technology, Tokyo
S. Ogawa
Toho University, Funabashi
T. Ohshima
Nagoya University, Nagoya
S. Okuno
Kanagawa University, Yokohama
H. Ozaki
High Energy Accelerator Research Organization (KEK), Tsukuba
P. Pakhlov
Institute for Theoretical and Experimental Physics, Moscow
G. Pakhlova
Institute for Theoretical and Experimental Physics, Moscow
C. W. Park
Sungkyunkwan University, Suwon
H. Park
Kyungpook National University, Taegu
H. K. Park
Kyungpook National University, Taegu
R. Pestotnik
J. Stefan Institute, Ljubljana
L. E. Piilonen
IPNAS, Virginia Polytechnic Institute and State University, Blacksburg, Virginia 24061
H. Sahoo
University of Hawaii, Honolulu, Hawaii 96822
K. Sakai
Niigata University, Niigata
Y. Sakai
High Energy Accelerator Research Organization (KEK), Tsukuba
O. Schneider
École Polytechnique Fédérale de Lausanne (EPFL), Lausanne
J. Schümann
High Energy Accelerator Research Organization (KEK), Tsukuba
C. Schwanda
Institute of High Energy Physics, Vienna
A. J. Schwartz
University of Cincinnati, Cincinnati, Ohio 45221
A. Sekiya
Nara Women’s University, Nara
K. Senyo
Nagoya University, Nagoya
M. E. Sevior
University of Melbourne, School of Physics, Victoria 3010
M. Shapkin
Institute of High Energy Physics, Protvino
C. P. Shen
University of Hawaii, Honolulu, Hawaii 96822
J.-G. Shiu
Department of Physics, National Taiwan University, Taipei
B. Shwartz
Budker Institute of Nuclear Physics, Novosibirsk
Novosibirsk State University, Novosibirsk
J. B. Singh
Panjab University, Chandigarh
R. Sinha
Institute of Mathematical Sciences, Chennai
A. Sokolov
Institute of High Energy Physics, Protvino
S. Stanič
University of Nova Gorica, Nova Gorica
M. Starič
J. Stefan Institute, Ljubljana
J. Stypula
H. Niewodniczanski Institute of Nuclear Physics, Krakow
K. Sumisawa
High Energy Accelerator Research Organization (KEK), Tsukuba
T. Sumiyoshi
Tokyo Metropolitan University, Tokyo
G. N. Taylor
University of Melbourne, School of Physics, Victoria 3010
Y. Teramoto
Osaka City University, Osaka
K. Trabelsi
High Energy Accelerator Research Organization (KEK), Tsukuba
S. Uehara
High Energy Accelerator Research Organization (KEK), Tsukuba
Y. Unno
Hanyang University, Seoul
P. Urquijo
University of Melbourne, School of Physics, Victoria 3010
G. Varner
University of Hawaii, Honolulu, Hawaii 96822
K. E. Varvell
University of Sydney, Sydney, New South Wales
K. Vervink
École Polytechnique Fédérale de Lausanne (EPFL), Lausanne
A. Vinokurova
Budker Institute of Nuclear Physics, Novosibirsk
Novosibirsk State University, Novosibirsk
C. H. Wang
National United University, Miao Li
M.-Z. Wang
Department of Physics, National Taiwan University, Taipei
P. Wang
Institute of High Energy Physics, Chinese Academy of Sciences, Beijing
Y. Watanabe
Kanagawa University, Yokohama
R. Wedd
University of Melbourne, School of Physics, Victoria 3010
E. Won
Korea University, Seoul
B. D. Yabsley
University of Sydney, Sydney, New South Wales
Y. Yamashita
Nippon Dental University, Niigata
Z. P. Zhang
University of Science and Technology of China, Hefei
V. Zhilich
Budker Institute of Nuclear Physics, Novosibirsk
Novosibirsk State University, Novosibirsk
V. Zhulanov
Budker Institute of Nuclear Physics, Novosibirsk
Novosibirsk State University, Novosibirsk
T. Zivko
J. Stefan Institute, Ljubljana
A. Zupanc
J. Stefan Institute, Ljubljana
O. Zyukova
Budker Institute of Nuclear Physics, Novosibirsk
Novosibirsk State University, Novosibirsk
Abstract
We report measurements of charmless hadronic decays into the
final state. The analysis uses a sample of
pairs collected with the Belle detector at the KEKB
asymmetric-energy collider at the resonance. The
decay is observed for the first time; the
significance is and the corresponding partial branching
fraction for is
. We also obtain the first evidence for with significance and for with significance. For the
two-body decays and , the
significances are and , respectively, and the
upper limits on the branching fractions are and
at 90% confidence level.
pacs:
11.30.Er, 13.25.Hw, 14.40.Nd
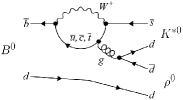
In the Standard Model (SM), charmless hadronic
meson decays occur mainly via two processes: (i)
transitions mediated by penguin diagrams, and (ii)
transitions mediated by tree diagrams. These diagrams as they
pertain to conjugate , for example,
are shown in Fig. 1. Both of these processes are
suppressed relative to the more common decays due to
either (i) the one-loop structure or (ii) the small ratio of CKM
matrix CKM elements , respectively. Because
of this suppression, these decays are especially sensitive to non-SM
contributions nonSM .
(a)
(b)
Figure 1: Feynman diagrams for charmless hadronic decays
pertaining to : (a) penguin diagram,
(b) tree diagram.
There have been several puzzling results from
measurements of charmless hadronic decays. For example,
decays to and show different patterns of direct
violation Nature , which are inconsistent with naïve SM
expectations. It has been suggested shed that vector-vector
() final states with the same quark combinations, e.g. may give insights to this puzzle, as any
difference between and their counterparts will be mainly
hadronic. In addition, charmless decays to final states show
intriguing results in the final-state polarizations.
The decays and ,
both occurring mostly via the penguin process, are found to have
large transverse polarizations expB2phiKst ; rzKstzBaBar ; rpKstzBelle , in contrast to the expectation from factorization. On
the other hand, ,
which is mostly a tree-diagram process,
is almost fully polarized
longitudinally rhorho . There have been
theoretical shed ; rzKst:theory studies of these modes, in part
focusing on the final-state polarizations within and beyond the SM.
One difficulty in measuring charmless
decays, however, is that non-resonant decays to the same final
state can be a significant background nonResVV . Such
non-resonant decays may have different decay properties, e.g.,
different polarization of the vector mesons. While
there are several experimental studies of decays to the
final
state rzKstzBaBar ; exp_pipiKpi , there is no
experimental information on the non-resonant components of these
final states.
In this paper, we analyze charmless hadronic decays of to the
final state. We search for two-body
final states such as and , and also for
three-body states , fz_BF ,
and , where the or
pairs are non-resonant.
A comprehensive understanding of these decays with
a clear distinction between
non-resonant and two-body resonant decays
would advance our understanding of strong and weak interaction
dynamics.
We use a data sample containing pair events
collected with the Belle detector Belle at the KEKB KEKB
asymmetric-energy collider ( on ), operating at
the resonance.
To reconstruct decays including the
intermediate states ,
, and , we select four charged tracks of
which two are positively charged and two are negatively charged. Each
track is required to originate within 5.0 cm of the interaction
point (IP) along the beam direction, and within 0.2 cm of the IP in
the transverse plane rpKstzBelle . We also require that the
transverse momentum of each track be larger than
rpKstzBelle . Tracks identified as electrons
are rejected. We identify charged kaons and pions by
combining particle identification (PID) information obtained from the
central drift chamber, the time-of-flight system,
and the aerogel Cherenkov
counters PID .
Signal candidates are selected for further analysis based on four
kinematic variables: the and invariant masses
( and ), the energy difference , and the beam-energy-constrained mass , where is the beam energy and
and are the energy and momentum, respectively, of the candidate
-meson. These variables are all evaluated in the
center-of-mass (CM) frame. We retain events satisfying , , and . To optimize the
background suppression criteria, tighter “signal regions” are
defined for and : and
. The fraction of events having multiple candidates
is approximately 20%. For multiple-candidate events, we select the
candidate decay having the smallest from the vertex fit.
Given a set of four particles, , two combinations of () and () may lie inside the selected mass ranges. In
this case, which occurs in less than 1% of signal decays, we pair the
higher-momentum with the .
The dominant source of background is from continuum
events (). These events are distinguished from the
signal by their event shape. Since mesons are spinless and
produced nearly at rest in the CM frame, their daughter particles are
distributed almost isotropically. On the other hand, continuum events
usually produce two back-to-back jets in the CM frame. We use Monte
Carlo (MC) simulated evtgen signal events and sideband data
() for optimizing the
continuum suppression requirements. First we form a Fisher discriminant
based on a set of modified Fox-Wolfram
moments KSFW . These moments are uncorrelated with the four
kinematical variables mentioned above. Two more variables are used
for continuum suppression: , the cosine of the polar angle of
the flight direction in the CM frame; and , the displacement
along the beam direction between the vertex of the signal and that
of the other in the event. Likelihood functions for signal
() and continuum background () are formed from products of
the probability density functions (PDFs) for , , and
. These are combined into a likelihood ratio . To obtain improved continuum suppression, we optimize the
requirement on as a function of flavor-tagging information from
the accompanying meson. The Belle flavor-tagging
algorithm TaggingNIM yields the -flavor variable (=), and the quality variable . The latter ranges from zero for no
flavor discrimination to one for unambiguous flavor assignment.
We optimize the requirement independently in six bins of . For
, for example, the optimized requirements
remove 99% of the background while retaining 42% of the
signal.
decays to a charm meson ( or ) and multiple pions
constitute a significant background that exhibits peaking behavior in
and similar to that of the signal. To eliminate this
background, we veto candidates that have a , , or
invariant mass consistent with a ,
, and decay, respectively.
The signal yields are obtained from a four-dimensional extended
unbinned maximum-likelihood LYONS fit (4D fit) to , ,
and . The likelihood function is
(1)
where is the yield of the -th component, is
the PDF value for the -th component of the -th event, and
runs over all events in the fit region (). We include 13
components in Eq. (1): decays to ,
, and ; the non-resonant components
, , , and ; the feed-down
components , , and ; and background components from continuum (),
charmed -decays (), and charmless -decays ().
The PDFs for the signal are separated into two categories: correctly
reconstructed events and self-cross-feed (SCF) events. The SCF events
include at least one track that is taken from the accompanying
meson decay. For correctly reconstructed events, a sum of two
Gaussians with a common mean is used for the and
shapes. The and distributions are modeled by
relativistic Breit-Wigner functions. The , and
resonance parameters are fixed to their PDG
values PDG . Parameters of the resonance shape are
fixed to the results of Ref. MORI ; these values have higher
precision than the corresponding PDG values. PDFs for the SCF
components are modeled using Kernel Estimation Kernel of SCF MC
distributions. For the and PDFs of non-resonant
components, a threshold function and/or Chebyshev polynomials are
used. The and shapes for the signal PDFs are calibrated
using a large , control
sample, to take into account small differences observed between
MC-simulated events and data.
The PDF shapes of the background are modeled with an
ARGUS argus_ftn function for , linear functions for
, and combinatorial shapes for and . For background, the PDFs are obtained separately for correctly
reconstructed and for random combinations. The
fraction of each component is fixed from the MC simulation. The PDF
shapes for background are modeled with non-parametric PDFs
using Kernel Estimation Kernel .
Figure 2: (color online) Projection of the 4D fit results onto (a) , (b)
, (c) , (d) ,
with the other variables required to satisfy (except for
the variable plotted)
, ,
and .
The curves are for the (solid-shaded),
the sum of and (dashed),
and the sum of feed-down modes (dot-dashed),
the sum of the backgrounds (dotted), and the total (solid).
The following parameters are floated in the 4D fit: the yields of the
signal modes (given in Table 1) and background yields
of and ; the parameters of the PDF describing
the , and combinatorial shapes of and
. The branching fractions of the feed-down components are fixed
to the results of Ref. feeddown_BABAR . The yield of
is fixed to 43.0 events as obtained from
two-dimensional - fitting in bins of as discussed
later. The remaining parameters are fixed to values obtained from
MC simulations.
The fit projections are shown in Fig. 2, and
the results are summarized in Table 1.
There are moderate correlations between some modes, which we check
by fitting an ensemble of Geant-simulated
MC samples.
We find a negligible effect on the measured signal yields.
The branching fraction of each mode is determined by , where
is the fitted signal yield, is the event
selection efficiency including daughter branching fractions as
obtained from MC simulation and is an
efficiency correction (=0.96) for PID that
accounts for small differences between MC and data. The production
rates of and pairs are assumed to be equal.
The fit yields the first observation for with a
significance of . The significance is defined as
, where () is the value of the
likelihood function when the yield is fixed to zero (allowed to vary).
We include systematic uncertainties by smearing the likelihood
function with a Gaussian whose width is equal to the systematic
uncertainty (discussed below). We also find evidence
for with a significance of , and
evidence for with a significance of
. For and , we
observe excesses of events with significances of and
, respectively. For the non-resonant decay components, the
and values correspond to the ranges
, , and
assume three-body phase space distributions. For modes with less than
significance, we also list a 90% confidence level (C.L.)
upper limit. This limit is determined via
(2)
Table 1: The signal yield and its statistical uncertainty,
corrected MC efficiency (assuming for
), significance including
the systematic uncertainties, measured branching fraction
and the upper limit (UL) at the 90% confidence level
. For non-resonant decay components, ,
and are obtained for
and assuming phase space
distributions. For the branching fraction, the first (second)
uncertainty is statistical (systematic).
Mode
(events)
(%)
()
()
()
5.73
5.56
11.15
-
11.43
6.74
-
6.84
Table 2: Summary of systematic uncertainties (%) in
the efficiency () determination.
Source
MC statistics
Tracking
PID
cut
-
-
-
-
-
Sum
The sources and sizes of systematic uncertainties in
the efficiency determination and the yield extraction are
summarized in Tables 2 and 3, respectively.
The main sources of
efficiency uncertainties are tracking (4.2%), PID (3.7%–3.8%),
MC sample statistics (0.5%–2.1%) and the
requirement (3.4%).
Table 2 also includes the uncertainty from
(1.4%). While this does not affect the
efficiency determination, it leads to a
multiplicative uncertainty in .
An additional uncertainty in the efficiency for
arises from the unknown fraction of longitudinal polarization ().
For our central value, we take = 0.5 and estimate the
uncertainty by considering the two extreme cases
and .
The systematic uncertainties in the yield extraction
are obtained by varying all fixed parameters of the PDFs
by , feed-down yields by , and
the fractions of SCF and backgrounds by %,
respectively.
We consider the effects of higher resonances
by including a PDF for
and repeating the 4D fit with its yield floated
by extending the fitting region in to
; the resulting changes are included
as a systematic uncertainty.
Table 3: Summary of systematic uncertainties (events)
in the signal yield () extraction.
Source
Fitting PDFs
Fitting bias
Interference
-
Sum
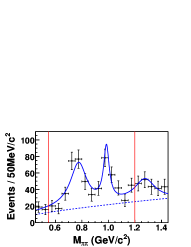
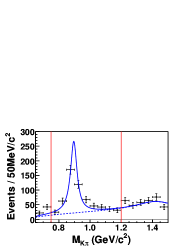
Figure 3: Signal yields obtained from the two-dimensional fits to
and in bins of (left) and (right) up to the
higher-mass regions. Solid curves show the results of the
two-dimensional binned fit, and dashed curves show the contributions of
non-resonant (left) and the sum of non-resonant
and (right). The vertical lines show the
nominal 4D fit regions.
We study the effects of possible interference among ,
, , and non-resonant modes by including
interference terms with variable phases in the relativistic
Breit-Wigner function. The effect is estimated by refitting with this
modified PDF; the resulting shifts in the yields are included in the
systematic uncertainties. We obtain the systematic
uncertainty due to possible interference between
, , and non-resonant in the
mass spectrum in a similar manner. Uncertainties due to possible
fitting bias are determined using a large sample of MC-simulated
events. We assign the small biases found in the MC simulation as
systematic uncertainties.
To verify the large contribution from non-resonant components (see
Table 1), we study background-subtracted and
spectra. These spectra are obtained by binning the data in
or and, for each bin, fitting the two-dimensional
- distribution to determine the sum of resonant and
non-resonant yields. Figure 3 shows these yields as a
function of and . Relativistic Breit-Wigner functions
are used as PDF’s for the resonances with their parameters fixed to
their PDG values PDG . The PDFs for the non-resonant
contributions are modeled by threshold functions using MC-simulated
events.
In summary, we have made the first observation of the
three-body decay with significance and
obtained the first evidence for non-resonant
and decays.
The corresponding partial branching
fractions are measured. For the and
modes, we find approximately signal
excesses and obtain the results listed in Table 1.
Our result for these
two-body decays are and lower, respectively, than
in the previous measurement rzKstzBaBar .
We have also searched for the fully non-resonant four-body decay
and calculated a 90% C.L. upper limit on
its partial branching fraction.
Our results for the non-resonant modes are the first such results
and may help us understand the polarization puzzle in
decays. With additional data, these measurements can be
used to constrain models of new physics beneke_2 .
We thank the KEKB group for excellent operation of the
accelerator, the KEK cryogenics group for efficient solenoid
operations, and the KEK computer group and
the NII for valuable computing and SINET3 network support.
We acknowledge support from MEXT, JSPS and Nagoya’s TLPRC (Japan);
ARC and DIISR (Australia); NSFC (China);
DST (India); MEST, KISTI, and NRF (Korea); MNiSW (Poland);
MES and RFAAE (Russia); ARRS (Slovenia); SNSF (Switzerland);
NSC and MOE (Taiwan); and DOE (USA). S.-H. K. acknowledges
support by the Seoul Science Fellowship.
References
(1) Throughout this paper, charge-conjugate processes
are implied unless explicitly stated otherwise.
(2) M. Kobayashi and T. Maskawa, Prog. Theor. Phys. 49, 652 (1973); N. Cabibbo, Phys. Rev. Lett. 10, 531 (1963).
(3) See, for example,
A.J. Buras and R. Fleischer, Eur. Phys. J. C 16, 97 (2000);
Y.Y. Keum, H.N. Li, A.I. Sanda, Phys. Rev. D 63, 054008
(2001).
(4) S.-W. Lin et al. (Belle Collaboration), Nature
452, 332 (2008); B. Aubert et al.
(BaBar Collaboration), Phys. Rev. Lett. 99, 021603
(2007).
(5) M. Beneke, et al., Phys. Rev. Lett. 96,
141801 (2006); C. S. Kim et al., Phys. Rev. D 76, 074019
(2007).
(6)
B. Aubert et al. (BaBar Collaboration), Phys. Rev. D 78, 092008 (2008);
B. Aubert et al. (BaBar Collaboration), Phys. Rev. Lett. 99, 201802 (2007);
K.-F. Chen et al. (Belle Collaboration), Phys. Rev. Lett. 94, 221804 (2005).
(7) B. Aubert et al. (BaBar Collaboration),
Phys. Rev. Lett. 97, 201801 (2006).
(8) J. Zhang et al. (Belle Collaboration),
Phys. Rev. Lett. 95, 141801 (2005).
(9) B. Auber et al. (BaBar Collaboration), Phys. Rev. Lett. 102, 141802 (2009);
B. Aubert et al. (BaBar Collaboration), Phys. Rev. D 76, 052007 (2007);
A. Somov et al. (Belle Collaboration), Phys. Rev. Lett. 96, 171801 (2006);
J. Zhang et al. (Belle Collaboration), Phys. Rev. Lett. 91, 221801 (2003).
(10) M. Beneke et al., Nucl. Phys. B774, 64 (2007);
H. W. Huang et al., Phys. Rev. D 73, 014011 (2006);
S. Baek et al., Phys. Rev. D 72, 094008 (2005);
M. Ladisa et al., Phys. Rev. D 70, 114025 (2004);
S. Oh, Phys. Rev. D 60, 034006 (1999).
(11)
P. Goldenzweig et al. (Belle Collaboration), Phys. Rev. Lett
101, 231801 (2008);
C.-C. Chiang et al. (Belle Collaboration), Phys. Rev. D 78, 111102 (2008).
(12) B. Aubert et al. (BaBar collaboration), Phys. Rev. D 76,
071104 (2007); W. Adam et al. (DELPHI Collaboration), Z. Phys. C 72,
207 (1996).
(13) In this paper, we assume a branching fraction
of 100% for .
(14)
A. Abashian et al. (Belle Collaboration),
Nucl. Instr. and Meth. A 479, 117 (2002).
(15) S. Kurokawa and E. Kikutani, Nucl. Instr. and Meth. A 499, 1
(2003), and other papers in this volume.
(16)
E. Nakano, Nucl. Instr. and Meth. A 494, 402 (2002).
(17)
Evtgen generator, D.J. Lange, Nucl. Instr. and Meth. A 462,
152 (2001). The detector response is simulated with Geant,
R. Brun et al., Geant 3.21, CERN Report
No. DD/EE/84-1, 1984.
(18)
S. H. Lee et al. (Belle Collaboration),
Phys. Rev. Lett. 91, 261801 (2003).
(19)
H. Kakuno et al.,
Nucl. Instr. and Meth. A 533, 516 (2004).
(20)
L. Lyons, Statistics for Nuclear and Particle
Physicists Cambridge U. Press, Cambridge (1986).
(21)
C. Amsler et al. (Particle Data Group),
Phys. Lett. B 667, 1 (2008).
(22)
T. Mori et al. (Belle Collaboration), Phys. Rev. D 75,
051101 (2007).
(23)
K. Cranmer, Comput. Phys. Commun. 136, 198 (2001).
(24)
H. Albrecht et al. (ARGUS Collaboration),
Phys. Lett. B 241, 278 (1990).
(25)
B. Aubert et al. (BaBar Collaboration), Phys. Rev. Lett.
100, 051803 (2008); F. Blanc (BaBar Collaboration),
Proceedings of the 2007 Rencontres de Moriond.
(26)
M. Beneke, et al., Eur. Phys. J. C 61, 429 (2009).