Measurement of the Double Beta Decay Half-life of 150Nd and Search for Neutrinoless Decay Modes
with the NEMO–3 Detector
A thesis submitted to the University of Manchester for the degree of Doctor of Philosophy in the Faculty of Engineering and Physical Sciences
2009
Nasim Fatemi-Ghomi
Particle Physics Group
School of Physics and Astronomy
Abstract
The half-life for two-neutrino double beta decay of 150Nd has been measured with data taken by the NEMO 3 experiment at the Modane Underground Laboratory. Using days of data recorded with g of 150Nd the half-life of this process is measured to be
This result is the world’s most accurate half-life measurement of this isotope. A search for neutrinoless double beta decay of this isotope is presented using the same data taking period. No significant excess of events above the background expectation is observed and the limit on the half-life of this process is set to be
This result has significantly improved the previous limit on neutrinoless double beta decay of this isotope. Limits are also set on several other neutrinoless double decay modes.
Declaration
No portion of the work referred to in this dissertation has been submitted in support of an application for another degree or qualification of this or any other university or other institute of learning.
The author of this thesis (including any appendices and/or schedules to this thesis) owns any copyright in it (the “Copyright”) and she has given The University of Manchester the right to use such Copyright for any administrative, promotional, educational and/or teaching purposes.
Copies of this thesis, either in full or in extracts, may be made only in accordance with the regulations of the John Rylands University Library of Manchester. Details of these regulations may be obtained from the Librarian. This page must form part of any such copies made.
The ownership of any patents, designs, trade marks and any and all other intellectual property rights except for the Copyright (the “Intellectual Property Rights”) and any reproductions of copyright works, for example graphs and tables (“Reproduction”), which may be described in this thesis, may not be owned by the author and may be owned by third parties. Such Intellectual Property Rights and Reproductions cannot and must not be made available for use without the prior written permission of the owner(s) of the relevant Intellectual Property Rights and/or Reproductions.
Further information on the conditions which disclosure, publication and exploitation of this thesis, the Copyright and any Intellectual Property Rights and or Reproductions described in it may take place is available from the Head of School of Physics and Astronomy.
The Author
The author gained a first class BSc degree in Physics at the Science and Research Branch of Tehran Azad University, before obtaining a MSc degree from the School of Physics and Astronomy at the University of Manchester in 2005. The work presented here was undertaken in Manchester between 2005 and 2009.
Acknowledgements
First and foremost I would like to thank my supervisor, Stefan Söldner-Rembold, for his guidance and advice and most importantly encouragement through the past three years. I am grateful to Vladimir Vasiliev of UCL for getting me started with NEMO 3 data analysis and striving to answer any and all of the questions I had over the last three years. Thanks to Fred Loebinger for being so friendly and always willing to help and Sabah Salih for his support. My thanks goes to all members of the Manchester HEP group who made my time here enjoyable.
Thanks to all the members of the NEMO 3 analysis group for all the interesting discussions and useful meetings related to this analysis, especially Ruben Saakyan, Xavier Sarazin, Alexander Barabash, Victor Tretyak and Vera Kovalenko. I am also grateful to Wade Fisher at Fermilab and Mark Owen who provided help and guidance on running the limit setting program used in this thesis. I would also like to thank Irina Nasteva, Chris Jackson, Steve Snow and Lisa Alexander for proof reading my thesis.
I am lucky for having a wonderful family and I would like to thank them all. Thank you Navid, Natalie, Parisa, Darius and Leila for being there for me whenever I needed a break. Thank you Mark for being supportive and patient when I was stressed out with work and for making me feel happy. Thank you mum for being so great, for bringing me up to be a feminist independent woman and for being my best friend through all of my life.
I would like to dedicate this thesis to my father Taghi (baba) and my brother Nader (dadash Nana) who I lost during my teenage years. You have been always with me and I will always remember you.
Chapter 1 Introduction
Neutrinoless double beta decay is a lepton number violating process which provides unique evidence that neutrinos are Majorana particles, i.e. their own anti-particle. Neutrinoless double beta decay is also sensitive to the neutrino mass scale. The experimental signature of decay is the observation of two electrons, for which the total energy sum is equal to the nuclear transition energy.
This thesis presents a measurement of the half-life of neodymium-150 (150Nd) two-neutrino double beta decay () and a search for different modes of neutrinoless double beta decay (). The data used for this thesis were collected by NEMO 3 between 2003 and 2006, corresponding to days of data taking.
The 150Nd isotope has a nuclear transition energy of MeV, which is higher than for most of the natural radioactive sources of background, and has a large phase space factor. These properties have made 150Nd a strong candidate for next generation double beta decay experiments, such as SuperNEMO [1] and SNO+ [2].
In NEMO 3 the backgrounds to are divided into decay and radioactive backgrounds. The background is irreducible as it has the same event topology as decay. The precise half-life measurement of decay is therefore important for searches. It also helps to improve the understanding of nuclear matrix elements (NME), which are the major source of uncertainty in the derivation of the neutrino mass from the half-life. The radioactive backgrounds are reduced by applying two-electron event selection criteria. The measurement of their activities is necessary for estimating the number of remaining events due to these backgrounds. This is achieved by studying control channels with final states different from the signal.
The thesis is set out as follows. The theoretical background to the work presented in this thesis and the current status of double beta decay experiments are described in Chapter 2. Chapter 4 describes the NEMO 3 experiment. The analysis techniques used are discussed in Chapter 5. The radioactive backgrounds to double beta decay of 150Nd are introduced and their activity measurements are described in Chapter 6. This chapter also shows that the background estimation can describe data well in several different analysis channels.
Chapter 7 is dedicated to a measurement of the 150Nd half-life. The systematic uncertainty on the measurement is estimated and the result is compared to other measurements of the 150Nd half-life. Chapter 8 presents the limits on half-lives of different neutrinoless double beta modes and compares these results with other searches for new physics in double beta decay experiments. Finally, Chapter 9 summarises the work described and gives a conclusion.
Chapter 2 Theoretical background
2.1 Introduction
The neutrino was first proposed by Wolfgang Pauli in 1930 [3] as a light neutral particle to solve the observed non-conservation of energy in beta decay. Since then much work has been done to establish a theory that can describe the fundamental particles and the observed interactions between them. As a result, neutrinos have become one of the building blocks of the Standard Model (SM) of particle physics, but several of their properties such as mass and their Dirac or Majorana nature are not known.
This chapter presents the theoretical background for the measurements and searches presented in this thesis. It begins with a brief introduction to the Standard Model. Sections 2.3 to 2.4 review the properties of neutrinos with emphasis on the properties which are not known. These sections also explain how decay can answer some of the questions regarding the nature and masses of the neutrinos. Section 2.5 gives details of the different double beta decay theories and modes. Section 2.5.5 introduces the nuclear matrix elemenet of the double beta decay.
2.2 The Standard Model
In the SM there are two general classes of fundamental particles: fermions, which have non-integer spin; and bosons, which have integer spin. The twelve types of fermions are subdivided into two groups, leptons and quarks. Leptons have three flavours and consist of the charged electron, muon and tau, together with three corresponding charge-neutral neutrinos: electron neutrino, muon neutrino and tau neutrino. The interactions of particles in the SM are mediated by the exchange of gauge bosons. There are three types of interaction in the SM: electromagnetic, weak and strong interactions. The properties of fermions and gauge bosons in the SM are given in Tables 2.2 and Table 2.2, respectively. In the SM fermions and gauge bosons obtain masses through the Higgs mechanism [4] which introduces an additional field with an associated particle, the Higgs boson.
| fermions | charge | mass | |
| leptons | electron | -1 | 0.51 MeV |
| electron-neutrino () | 0 | eV | |
| muon | -1 | 105.6 MeV | |
| muon-neutrino () | 0 | eV | |
| tau | -1 | 1777 MeV | |
| tau-neutrino () | 0 | eV | |
| quarks | up (u) | 1.5–4 MeV | |
| down (d) | 4–8 MeV | ||
| charm (c) | 1.15–1.35 GeV | ||
| strange (s) | 80–130 MeV | ||
| top (t) | GeV | ||
| bottom (b) | 4.1–4.4 GeV |
| gauge bosons | interaction | mass (GeV) |
|---|---|---|
| (photon) | electromagnetic | 0 |
| boson | weak | 91.1880.002 |
| boson | weak | 80.425 0.038 |
| g (gluon) | strong | 0 |
Definition of lepton number in SM
Each generation of leptons has associated with it a quantum number. There are three lepton numbers: electron number (), muon number () and tau number (). The electron and electron neutrino have and the positron and electron anti-neutrino have . For all other leptons . Similarly, and for leptons not in the muon and tau generations, respectively. In the SM, the sums of lepton numbers are conserved in all known interactions.
2.3 The nature of massive neutrinos
Despite the success of the SM, it is not able to account for massive neutrinos. In the SM, neutrinos are considered to be left-handed and this precludes the possibility that neutrinos have mass, as helicity is conserved only for a massless particle. However, the observation of the oscillation between the different flavours of neutrinos [6, 7] has shown that the neutrino mass eigenstates ( and ) and the flavour eigenstates (, and ) are different, and thus neutrinos have mass. This leads to two fundamental questions: what is the nature of the neutrino mass and what is the mass scale of the neutrino? The latter is discussed in Section 2.4.2. This section focuses on the question of the nature of the neutrino. Neutrinos are either Dirac particles, which means that they are distinct from their own anti-particles, or they are Majorana particles, meaning they are their own anti-particles.
2.3.1 Dirac neutrino
The Dirac mass term of the neutrino Lagrangian is written as [8]
| (2.1) |
where is the non-diagonal Dirac mass matrix, and and are the chirally right-handed and left-handed flavour neutrino fields defined as
| (2.2) |
The second term in Equation 2.1 is the Hermitian conjugate () of the first term. As right-handed neutrinos do not couple through the weak interaction, the Dirac model predicts three right-handed sterile neutrinos which do not interact and can not be detected. Dirac mass terms require four independent components (,, , ) and thus suggest that neutrinos and anti-neutrinos are distinct and lepton number is conserved. The Dirac model leads to small coupling of the neutrino to the Higgs field (in comparison with the coupling of other leptons). The Dirac model can not explain why the neutrino mass is much lower than that of other leptons.
2.3.2 Majorana neutrino
The Majorana mass term may be constructed out of solely the left-handed or right-handed neutrino. However, the left-handed mass is not invariant under the electroweak gauge group. Thus, it is more common to see the mass term in the right-handed construction. The neutrino mass Lagrangian can be written as [8]
| (2.3) |
where is the right-handed symmetric Majorana mass matrix, and is the charge-conjugate field of , which satisfies the Majorana condition , where is the charge conjugation matrix, and denotes transposition. This field also has the property that , where is the left-handed projection operator, that is is left-handed. This can be considered in terms of the picture of moving into a reference frame where the helicity of the massive neutrino flips.
The Majorana neutrino field is self-conjugate and therefore Majorana neutrinos are their own antiparticles. Among all fermions only neutrinos can be Majorana particles as they do not carry charge. Since the Majorana field has only two independent components (, ) compared to the four in the Dirac field, the Majorana theory is simpler and more natural than the Dirac theory. As there is no reason for the Majorana term to be zero, neutrinos are assumed to be Majorana particles in most theories beyond the SM.
The see-saw mechanism
The see-saw mechanism [9] is a Dirac-Majorana model which is developed in order to justify the smallness of the mass of the neutrinos in comparison with other fermions in the SM. If the neutrino has a Dirac mass as other fermions in the SM do and also a right-handed Majorana mass defined through Equation 2.3, then its total Dirac-Majorana neutrino mass term is constructed as
| (2.8) |
The matrix = is referred to as the neutrino mass matrix. Equation 2.8 can be diagonalised to give the mass eigenstates with eigenvalues
| (2.9) |
If it is assumed that the Dirac mass, of the neutrino is of the same order of magnitude as the Dirac mass of other fermions in the SM and that the right-handed Majorana mass term is much heavier than the Dirac mass term (), the first approximation of these eigenvalues gives and . Thus this model predicts two physical neutrinos: the light left-handed neutrino and a very heavy right-handed Majorana neutrino. If the heavy neutrino mass is at the GUT (Grand Unified Theory) scale ( GeV), then the mass of the light neutrino is order of few eV. Therefore this model can explain why the mass of the SM neutrino is much lower than the mass of the other fermions. As the Majorana mass term appears in both neutrino mass eigenvalues, this mechanism predicts that neutrinos are Majorana particles.
2.4 PMNS matrix
In the full three neutrino mixing framework the weak eigenstates can be expressed as superpositions of three neutrino mass eigenstates (, , ) linked via a unitary matrix :
| (2.10) |
This can be rewritten as
| (2.11) |
This unitary mixing matrix is known as the Pontecorvo-Maki-Nakagawa-Sakata (PMNS) matrix [10, 11]. The unitary matrix can be parametrised in the following form
| (2.12) |
is the diagonal matrix defined as
| (2.13) |
where , are the sine and cosine of the mixing angle , is the Dirac phase and and are the Majorana phases, which only affect Majorana neutrinos. Thus the matrix only appears in the PMNS matrix if neutrinos are Majorana particles.
Dirac and Majorana phases
The Dirac and Majorana phases in the PMNS matrix are CP-violating phases. The Dirac CP-violating phase, , can be measured by oscillation experiments via comparing the probability of neutrino and anti-neutrino oscillations from a certain flavour to another. However, the oscillation experiments are not able to measure the Majorana CP-violation phases and as they only appear on the leading diagonal of the PMNS matrix and therefore cancel in all measurable quantities in oscillation experiments. Neutrinoless double beta decay experiments may be able to provide a possible constraint on CP-violation phases, as is sensitive to the value of the effective neutrino mass:
| (2.14) |
where . More details about neutrinoless double beta decay are given in Section 2.5.3.
2.4.1 Neutrino mass hierarchy problem
The probability for a neutrino to change from one flavour to another is related to the difference between the masses squared of the mass eigenstates, . Based on the observations from neutrino oscillations, various mass models have been proposed [12]. These can be categorised as the normal hierarchy in which has the lowest mass among the three, and the inverted hierarchy in which has the lowest mass. In both scenarios and have similar masses. The third model is degenerate, where the three mass eigenstates have similar masses. Figure 2.1 shows a schematic view of the normal and inverted hierarchy models. The approximate mass squared difference between the mass eigenstates found by oscillation experiments is shown [13, 14].

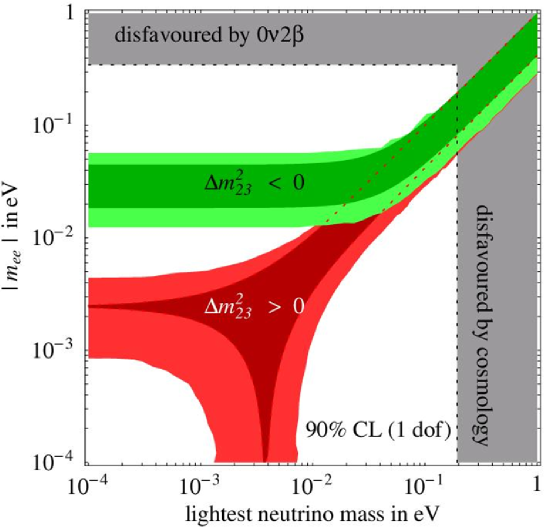
Figure 2.2 shows the distribution of with respect to the oscillation parameters for normal (red) and inverted hierarchy (green). The next generation double beta decay experiments will be sensitive to the full degenerate and inverted hierarchy regions. If no neutrinoless double beta decay event is observed by these experiments, then the inverted hierarchy can be excluded.
2.4.2 Absolute mass scale of neutrino
Oscillation experiments are trying to measure the difference between mass eigenstates of the neutrinos, but they are not sensitive to the absolute mass scale of the neutrino. Experimentally there are three possible ways to constrain or measure the absolute mass scale. One way is to search for the neutrino rest mass by exploring the endpoint energy of the electron spectrum in tritium beta decay and thus find the mass scale of the neutrino () directly from the kinematics of the decay. Currently a limit for the electron neutrino mass of less than eV has been achieved [15, 16]. The advantage of this experimental approach is that it is independent of the nature of the neutrino (Dirac or Majorana); however, the measurement of the mass from the decay spectrum is limited by the energy resolution of the experiments and background considerations. This makes it experimentally difficult to improve the sensitivity of the experiment to an energy scale of meV.
The second way to constrain the neutrino mass is from analysing cosmological data. The astrophysical experiments are able to set limits on the sum of the neutrino masses (). These limits are based on the cosmological models which give the neutrino contribution to the density of the universe. The most recent limits for range from to eV at confidence level [17]. This range can constrain the lightest neutrino mass ( or ). The disfavoured region of lightest neutrino mass is shown by a vertical gray bound in Figure 2.2. As the cosmological models are based on several assumptions, it would be challenging to improve these results.
The third approach to constrain the absolute mass scale of neutrinos is searching for neutrinoless double beta decay . As mentioned previously in Section 2.4, neutrinoless double beta decay is sensitive to the effective neutrino mass if the neutrino is a Majorana particle.
2.5 Theory of double beta decay
2.5.1 Beta decay
Beta () decay is a type of radioactive decay in which the weak interaction converts a down quark of the neutron into an up quark of a proton while emitting an electron and an antineutrino. Thus, this process changes the atomic number, , of a nucleus by one unit, while the atomic mass remains the same:
| (2.15) |
There are also two other possible modes of this process which are known as and electron capture (EC) and defined as:
| (2.16) | |||||
| (2.17) |
2.5.2 Double beta decay
Double beta decay, [18], is a process in which two beta decays occur simultaneously with emission of two electrons and two antineutrinos:
| (2.18) |
Double beta decay can only occur in nuclei with even atomic number and atomic mass (even-even). In these nuclei the single beta decay can be either energetically forbidden or strongly suppressed. The nuclear transition energy, , for this process is defined as:
| (2.19) |
where and are, respectively, the masses of the initial and final nuclei and is the mass of the electron. Figure 2.3 shows a diagram of the energy requirements for double beta decay. This process is the rarest known kind of radioactive decay, and it is predicted in only isotopes. Double beta decay occurs within the SM and involves a second order weak interaction as shown in Figure 2.4a. The rate of the process is characterised by its very long lifetime (more than years).


The half-life () of the double beta decay process is expressed by the equation:
| (2.20) |
where is an analytically calculable phase space integral which scales with and the atomic number, [19]. The term is the nuclear matrix element (NME) (Section 2.5.5) for double beta decay which gives the probability of the process and can be calculated theoretically. To test the methods used to calculate NMEs, it is important to determine the half-life of experimentally. Two neutrino double beta decay is an irreducible background for searches for beyond the Standard Model (BSM) double beta decay processes for detectors with weaker energy resolutions.
2.5.3 Neutrinoless double beta decay
Neutrinoless double beta decay () [20] involves a transition of two neutrons into two protons with the emission of two electrons and no neutrinos (Figure 2.4b):
| (2.21) |
In this process a right-handed antineutrino emitted at one vertex undergoes a helicity flip and is absorbed into the other vertex as a left-handed neutrino. This can only happen if neutrinos and antineutrinos are identical (Majorana particles) and have mass. This process violates total lepton number by two units and is forbidden in the SM. Observation of neutrinoless double beta decay would prove that neutrinos are Majorana particles and would answer the most fundamental question about the nature of the neutrinos.
As there are no neutrinos in the final state, the experimental signature of is two electrons, with energies summing to the nuclear transition energy (). For decay the energy sum of the two electrons forms a continuous spectrum (Figure 2.5).
The half-life of is expressed by:
| (2.22) |
where is the effective Majorana neutrino mass and is the electron rest mass. Thus the experimentally measured half-life, or in case of non-observation of the process its lower limit, can provide the effective neutrino mass or an upper limit on it.
The phase space integral, , is proportional to and the atomic number, [21]. Thus the neutrinoless double beta decay rate is higher for isotopes with high value.
Right-handed current
The mechanism that involves the helicity flip of the neutrino due to its mass is known as the mass mechanism. This mechanism is not the only possibility that leads to emission of two electrons in the final state. There are theories beyond the Standard Model which predict the existence of pure right-handed bosons () or bosons with mixtures of left-handed and right-handed bosons () [19]. If exists and the neutrino is a Majorana particle, then a right-handed neutrino can interact at the other vertex without need for a helicity flip. This mechanism is known as the right-handed current mechanism of neutrinoless double beta decay. In this thesis a limit is set only on the half-life of pure right-handed neutrinoless double beta decay. The half-life of this process is inversely related to the phase space factor of this process, the NME () and , the coupling constant of the right-handed neutrino with ,
| (2.23) |
2.5.4 Double beta decay with emission of Majorons
Several beyond the SM models exist in which global B-L (Baryon-Lepton) symmetry is broken spontaneously. These lead to the prediction of a massless Goldstone boson, called the Majoron [22] which can couple to the neutrino. There are three types of Majoron models: singlet Majoron, doublet Majoron and triplet Majoron [23]. The measurement of the boson width at LEP [24] has ruled out the doublet and triplet Majoron models, but singlet and dominantly singlet Majoron models are still possible. These models predict that the two neutrinos in double beta decay couple with a Majoron, :
| (2.24) |
Figure 2.6a shows a diagram of such an emission. The drawback of the singlet Majoron models is that in these models the Majoron couples to the neutrino with a coupling strength of [25] where is the mass of the light neutrino and is the symmetry-breaking scale (which is higher than the electroweak scale GeV). In order to have an observable rate for Majoron emitting double beta decay (), the singlet Majoron model requires severe fine tuning. To avoid the fine tuning problem, several new Majoron models have been constructed. Here the term Majoron means light or massless boson with couplings to neutrinos. In this definition the Majoron is not constrained to be a Goldstone boson.
There is a doublet Majoron model in supersymmetry which predicts neutrinoless double beta decay with emission of two Majorons [23]:
| (2.25) |
Figure 2.6b shows the neutrinoless double beta decay diagram with the emission of two Majorons. In this diagram the Zino, , is the fermionic supersymmetric partner of the boson. There are also other Majoron models which predict double beta decay with emission of one or two Majorons. Majorons in these models are predicted to be vector bosons and carry lepton charge and have mass [26, 27, 28].
A model for neutrino masses is proposed in the context of large extra dimensions. In this model the global B-L symmetry is broken spontaneously by a gauge singlet Higgs field in a bulk [29]. This leads to a bulk singlet Majoron which is observable in neutrinoless double beta decay.


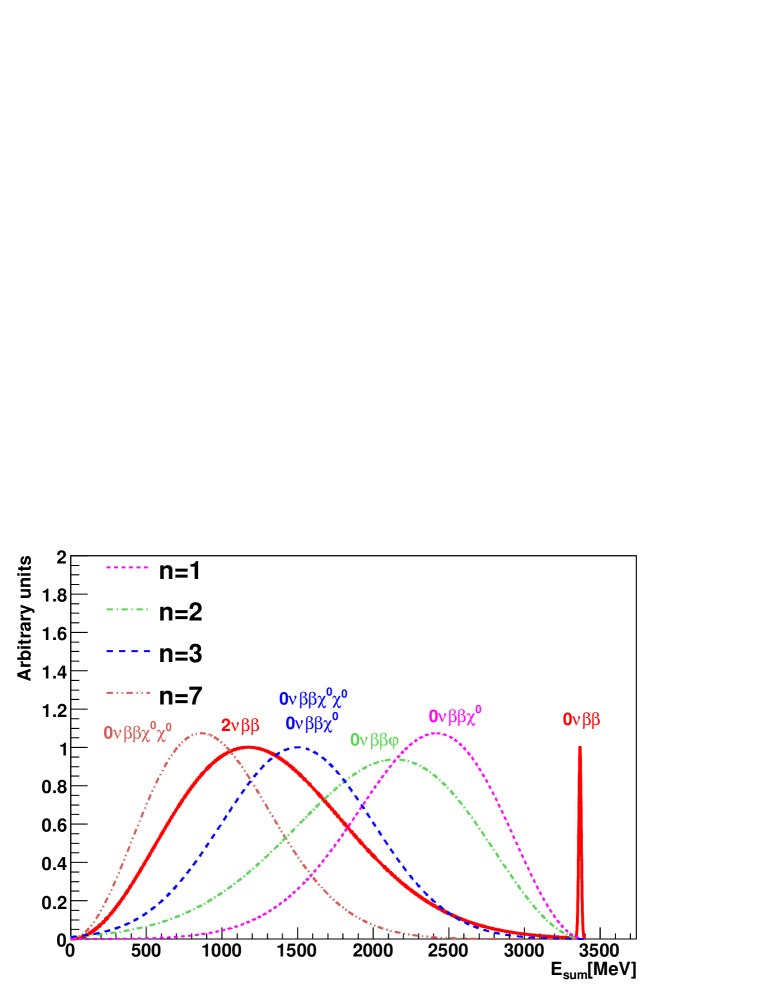
There are in total Majoron models (one bulk Majoron and light or massless bosonic Majorons) that are of interest in double beta decay experiments. The energy of the final state electrons from these ten models can form four distinguishable distributions [27]. The possible two electron energy spectra () for different Majoron modes of 150Nd are shown in Figure 2.5. In the figure, the index defines the shape of the spectrum by modifying the distribution with a factor . Majoron mode one denotes the theories which lead to emission of one Majoron, Majoron mode two denotes the bulk Majoron emission, Majoron mode three denotes the emission of one or two massless lepton number carrying Majorons and Majoron mode seven denotes the emission of two light Majorons. Note that electrons from the mode have on average lower energies than electrons; thus, it is more difficult to extract experimentally, since most backgrounds tend to dominantly produce low-energy electrons. The half-life of Majoron-emitting double beta decay is expressed by
| (2.26) |
The index indicates the Majoron mode, is the effective coupling constant of Majoron mode , is the phase space factor and is the nuclear matrix element of each Majoron mode.
2.5.5 Nuclear Matrix elements
If the half-life of neutrinoless double beta decay is measured, the effective neutrino mass can be calculated from Equation 2.22. Accurate calculations of the NME are necessary in order to measure the effective neutrino mass with minimum uncertainty.
Two main theoretical methods have been widely used to calculate the nuclear matrix elements for neutrinoless double beta decay: the nuclear shell model (NSM) and the quasi-particle random phase approximation (QRPA). The NSM [30] is useful for calculating single particle states close to the Fermi level and is only reliable for light nuclei such as 48Ca, 76Ge and 82Se. For medium to heavy double beta decay isotopes the shell model calculations are difficult to carry out.
For heavier nuclei the proton-neutron QRPA (pn-QRPA) [31] has been found to be a powerful model. The QRPA can handle a great number of intermediate states. In double beta decay the initial nucleus decays to the final nucleus through virtual excitations of all states of the intermediate nucleus. The intermediate excited states are obtained by solving the QRPA equations. The QRPA calculations contain two two-body interaction matrix elements: particle-particle (pp) which is correlated to the proton-proton interaction and particle-hole (ph) which is correlated to the proton-neutron interaction. Both matrices contain independent interaction constants and [32].
The ph matrix elements mainly affect the giant Gamow-Teller resonance [33], which is reproduced accurately by the QRPA and as such is generally fixed. The constant, which has a large effect on NME and double beta decay, is a free parameter. This parameter causes uncertainties in NME calculations and thus much of the work into QRPA has been focused on the problem. One method in the early stage of development is to fix the value of by fitting it to the available and decay data. Another important issue in QRPA is that the nuclei of experimental interest are assumed to have spherical symmetry. As many heavy nuclei are deformed [34] this approximation does not give a realistic calculation for these nuclei (such as 150Nd). Table 2.3 presents the most recent calculated NMEs () for several double beta decay isotopes.
| isotope | |
|---|---|
| 76Ge | 3.33–4.58 |
| 82Se | 2.01–4.17 |
| 96Zr | 1.01–1.28 |
| 100Mo | 2.22 –3.53 |
| 130Tl | 2.27–3.77 |
| 150Nd | 3.14–4.04 |
Chapter 3 Double beta decay experiments
The challenging task in double beta decay experiments is to search for the peak in the electron energy spectrum within the continuum of and natural radioactive background. This chapter presents the experimental criteria and status of double beta decay experiments.
3.1 Experimental criteria
In order to search for signal and minimise backgrounds several factors need to be considered in experiments [36]:
-
•
The double beta decay isotopes and the detector components must have high purity. This goal can be achieved via purification of double beta decay sources and constructing smaller and more granular detector components.
-
•
To suppress cosmic ray backgrounds the detectors are situated underground.
-
•
The isotopes with large are favoured as the energy region of interest is above potential backgrounds (more details are given in Section 3.1.1).
-
•
A good energy resolution is required to prevent the tail of the spectrum from extending into the region of interest. This produces a good signal over background ratio.
-
•
To reject background, event reconstruction and good particle identification is required.
-
•
The NME is understood for some isotopes more than others. The interpretation of limits or, in case of discovery, signals requires measurements for a range of isotopes.
-
•
Several modes can be studied through energy and angular distributions of the electrons in the final states.
So far, no experiment searching for has managed to include all the above criteria for its searches. Section 3.2 gives details of the current experimental status of double beta decay detectors.
3.1.1 Choice of isotopes
As mentioned in Section 2.5.2, occurs in isotopes. However, it is not experimentally favourable (and interesting) to detect the decay in all these isotopes. Most of these isotopes have a low value which is similar to the values of other natural radioactive decays. As double beta decay is rare, it will be difficult to detect it above background. Currently there are nine double beta decay isotopes which are experimentally considered for neutrinoless double beta decay searches: 48Ca, 76Ge, 82Se, 96Zr, 100Mo, 116Cd, 130Te, 136Xe and 150Nd. Table 3.1 gives the value and natural abundance of each of these isotopes.
| Transition | (keV) | Natural Abundance (%) |
|---|---|---|
| Se | 2039 | 7.8 |
| Ba | 2479 | 8.9 |
| Xe | 2533 | 34.5 |
| Sn | 2802 | 7.5 |
| Kr | 2995 | 9.2 |
| Ru | 3034 | 9.6 |
| Mo | 3350 | 2.8 |
| Sm | 3367 | 5.6 |
| Ti | 4271 | 0.187 |
This thesis is about the double beta decay study of 150Nd, thus the rest of this section describes the properties of this isotope.
3.1.2 Neodymium-150
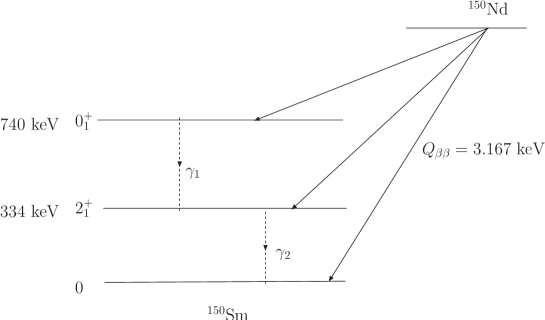
The double beta decay of 150Nd to the ground state of 150Sm is accompanied by the simultaneous emission of two electrons. The decay to the ground state of 150Sm has already been observed by several experiments. Figure 3.1 shows a decay scheme of this isotope. In addition, 150Nd can decay to 150Sm and excited states and then de-excite by emitting photons. In the case of a decay to the excited state, the two electrons in the final state are accompanied by two photons with energies keV and keV, and in the case of decaying to the state, electrons are emitted with one keV photon. The half-life of these processes is predicted to be greater than y [37].
A precise measurement of the decay of this isotope to the ground state is important since it is an irreducible background to and also can be used to improve current NME calculations.
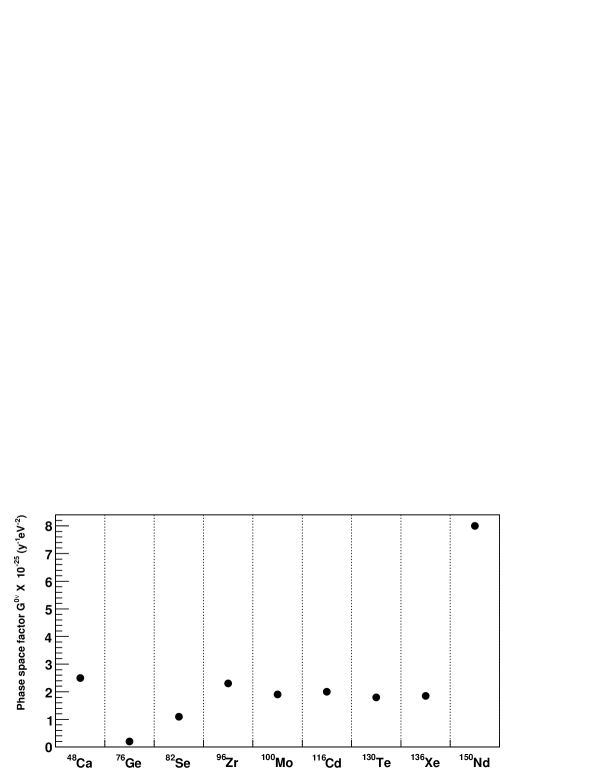
The Neodymium-150 (150Nd) isotope has the second highest value of all the double beta decay isotopes (after 48Ca). This, combined with a high atomic number, makes the neutrinoless double beta decay phase space factor ) the highest of all isotopes. Figure 3.2 shows approximate values for several double beta decay isotopes. From Equation 2.22 it is shown that the half-life of process is inversely related to , thus the event rate for 150Nd is expected to be higher than all other isotopes, assuming identical NMEs. This feature makes 150Nd a strong candidate for next generation double beta decay experiments such as SNO+ [2] and SuperNEMO [1] (Section 3.2). Currently, the only drawback of using 150Nd for searches is the high uncertainty on the NME calculation due to its mass and deformation [38].
3.2 Experimental status
The observation of neutrinoless double beta decay can answer important questions in neutrino physics. In the past ten years several experiments have been therefore constructed and many more are currently in the R&D stage. The double beta detectors are divided into two main categories: homogeneous (source equal to detector) experiments in which the double beta decay source is part of the active detector and heterogeneous (source not equal to detector) experiments in which the source is separated from the detector. The homogeneous detection technique gives good energy resolution. The heterogeneous experiments contain tracking detectors which give them a good particle identification.
3.2.1 Experiments following the homogeneous system
Semiconductor germanium (Ge) detectors are among the most popular double beta decay experiments. This is because of the cheap enrichment process for 76Ge. The NME of this isotope is also relatively well known. There have been two previous semiconductor 76Ge detectors which produced important search results: Heidelberg-Moscow and IGEX. Heidelberg-Moscow was a semi-conductor germanium detector, enriched to in 76Ge. The final design of the detector consisted of five individual sub-detectors with a total mass of kg. The experiment ran between and . A claim for discovery of was made in by a sub-group of the Heidelberg-Moscow collaboration [40]. The half-life value of was obtained to be years, with eV. Figure 3.3 shows the result of this experiment. However, this result has received criticism [41]. It is believed that the background and the systematic uncertainties of this experiment are underestimated. The IGEX experiment used a similar experimental technique to the Heidelberg-Moscow experiment and produced a limit on the half-life of years at confidence level (CL) [42].
To confirm or disprove the Heidelberg-Moscow results, two experiments are being designed to study the region highlighted by the Heidelberg-Moscow experiment: GERDA [43] and MAJORANA [42]. Both of these detectors will use Ge enriched to 76Ge. In the first phase of its running, GERDA will utilize the existing Heidelberg-Moscow and IGEX experiments (18 kg of 76Ge) and will reach a half-life sensitivity of years. This sensitivity can rule out or confirm the Heidelberg-Moscow results. In the second phase of its running another kg will be added, giving a half-life sensitivity of years, which corresponds to meV. MAJORANA’s eventual half-life sensitivity is hoped to be y, corresponding to 61 meV. The final design of this experiment is still under development.
One running source equal detector experiment is CUORICINO [44]. This experiment uses bolometers containing double beta decay isotopes, running at extremely low temperatures (order of mK). When a double beta decay event occurs, the electrons of the decay increase the temperature by depositing energy inside a crystal. By measuring the temperature rise the deposited energy is measured. Each bolometer is cm3 and is fixed into a layered tower structure. The total mass of the crystals is kg, corresponding to 11 kg of 130Te. This detector has set a limit on the half-life of neutrinoless double beta decay of 130Te to be more than years, corresponding to eV [44]. CUORE [45], which is the next generation of the CUORICINO experiment, will have kg of TeO2 crystals with a total of 206 kg 130Te. It will consist of towers which have the same size as the CUORICINO tower. It is expected to reach a half-life sensitivity of years which corresponds to a mass sensitivity of meV, depending on NME.
The COBRA [46] experiment is in the R&D stage and is going to use CdZnTe semiconductor crystals. CdZnTe contains nine double beta isotopes, with 130Te and 116Cd having the highest abundance in the detector. This experiment is also searching for , EC and EC EC processes by studying 106Cd, 64Zn, 108Cd and 120Te decays. The finished experiment will hold 64000, cm3 CdZnTe detectors. The detector will have kg mass, in which 183 kg will be Cd enriched to 90% in 116Cd. The half-life sensitivity of this experiment will be greater than years, corresponding to meV.
The SNO+ experiment is planning to use most of the SNO experiment infrastructure and shielding (SNO was a successful experiment that confirmed neutrino oscillations in solar neutrinos), replacing the heavy water with tones of Nd-loaded liquid scintillator. A Nd-loading would correspond to 560 kg of natural Nd [47] or 56 kg of 150Nd. It is also a possibility that this experiment could load the scintillators with enriched 150Nd. This experiment is multi-purpose and apart from double beta decay studies is going to focus on low energy solar neutrinos as well as geo-neutrinos, reactor and supernova neutrinos [47].
3.2.2 Experiments following the heterogeneous system
These type of experiments are divided into two categories: the time projection chambers (TPCs), where the double beta decay isotope is a filling gas or liquid, and tracking-calorimeter experiments, where the double beta decay source is a solid foil. The EXO [48] experiment is a TPC experiment. Its goal is to use between 1 to 10 tons of Xe enriched to 80% in 136Xe. The experiment is developing a high resolution liquid xenon TPC with good tracking capability. A high voltage cathode will be located in the middle of the TPC volume. At each end there will be horizontal and vertical anode wires. These wires will be for charge collection, allowing energy measurement and particle trajectory reconstruction. The liquid xenon is also an efficient scintillator. The use of both collected charge and scintillator light improves the energy resolution. The experiment will have two phases; the first phase is called EXO-200 (200 kg of 136Xe is used) and is expected to reach a mass sensitivity of 30 meV. In the second phase the EXO detector is expected to trap and identify the 136Ba ions, the daughter isotope of 136Xe, by laser spectroscopy. These ions can be identified via atomic spectroscopy by optical pumping with blue and red lasers [49]. The radioactive background events can be significantly reduced by Ba tagging.
NEMO 3 [50] follows the tracker-calorimeter technique and is currently the only running experiment of this type. More details about this detector are given in Chapter 4. The SuperNEMO detector is a next generation double beta decay experiment which is going to use the same experimental approach as NEMO 3 but will improve the sensitivity to neutrino mass scale by one order of magnitude ( meV). This experiment will comprise individual modules, each of which has a rectangular shape with the source foil in the centre surrounded by the tracker and the calorimeter. This experiment will use kg– kg 150Nd and/or 82Se isotope.
| Experiment | Isotope | mass (kg) | Expected (meV) | Time scale |
|---|---|---|---|---|
| GERDA Phase 1 | 76Ge | 250-440 | 2010 | |
| GERDA Phase 2 | 76Ge | 124 | 2011 | |
| CUORICINO | 130Te | 420–580 | current limit | |
| CUORE | 130Te | 45–53 | 2011–2016 | |
| SNO+ | 150Nd | 56 or 560 | under study | 2012 |
| COBRA | 116Cd | 38–96 | – | |
| EXO-200 | 136Xe | 200 | 30 | 2009 |
| NEMO 3 | 100Mo | 7 | 630–110 | current limit |
| SuperNEMO | 150Nd/82Se | 100–200 | 45–85 | 2012 |
| MOON | 100Mo | 1000 | 50 | |
| DCBA phase 1 | natural Nd | 600 | 120 |
There are also two other experiments which are planning to use heterogeneous techniques: MOON [51] and DCBA [52]. MOON will use one tonne of 100Mo and hopes to achieve an effective neutrino mass sensitivity of meV. DCBA will use natural 150Nd in its first phase of data taking and then enriched 150Nd in the second phase. They hope to reach a sensitivity of eV. Table 3.2 summarises the current and future double beta decay experiments, the isotopes they use for searches, the isotope masses, their expected effective neutrino mass sensitivity and their running time scale.
Chapter 4 The NEMO 3 detector
The Neutrino Ettore Majorana Observatory 3 (NEMO 3) experiment has been running in the Fréjus Underground Laboratory (Laboratoire Souterrain de Modane) in France since February 2003. The main objective of the experiment is to search for evidence of neutrinoless double beta decay in a variety of isotopes.
The NEMO 3 detector is a heterogeneous system, in which the radioactive sources do not make up part of the active detector. Particle tracking and energy measurements are also performed independently, giving good particle identification and understanding of radioactive backgrounds.
4.1 General description of the NEMO 3 detector
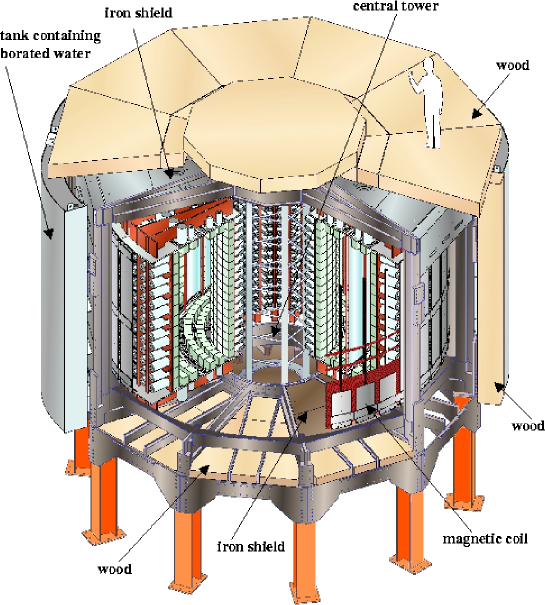
NEMO 3 is cylindrical in design and is segmented into 20 sectors. The sectors are numbered from 0 to 19. Each sector contains tracking chambers and calorimeters in order to directly detect decay particles emanating from the radioactive source foils. The source foils are positioned in the centre of each sector and divide the sectors into two parts: the inner part, which is from the source foil to internal wall of each sector; and the outer part, which is from the source foil to external wall of each sector. The whole detector is surrounded by a solenoid providing a magnetic field of 25 Gauss, external neutron shielding and an anti-radon tent.
The NEMO 3 detector can be defined in both right-handed Cartesian and cylindrical coordinate systems. In the Cartesian system, the axis starts from the centre of the detector and is along the edge of sector 0. The axis starts from the centre of the detector and is along the edge of sector 5. The axis starts from the centre of the detector and points vertically upward. By performing notational conversion, the radius (), polar angle () and of the cylindrical coordinates are formed. Figures 4.1 and 4.2 show a cutaway view of the NEMO 3 detector and a view of one of the sectors of the detector, respectively.

4.2 The NEMO 3 sources
Unlike all other currently running double beta decay experiments where calorimeters serve as both double beta decay source and detector, the sources in NEMO 3 are independent from the detector. Inside NEMO 3 there are seven double beta decay isotopes, thus permitting study and comparison of results from different isotopes. Each sector contains seven foils mounted vertically at a radius of 155 cm from the centre within a metallic support frame. This structure allows multiple isotopes to be mounted within one sector. Each source foil has a height of 2.5 m, a width of 65 mm and an area density of 30–60 mg/cm2.
The choice of source nuclei for NEMO 3 was based on several factors: the double beta decay transition energy, , the phase space factors, and , corresponding to neutrinoless decay and two-neutrino decay; the nuclear matrix elements ( and ); the background in the energy region around the value; and the natural abundance and enrichment possibilities of the isotope.
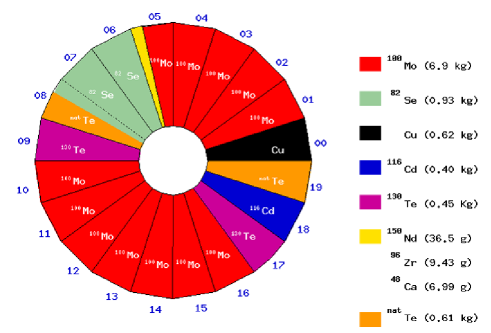
Nine isotopes in various quantities were chosen for NEMO 3 and these are placed in the order and quantities displayed in Figure 4.3. Double beta decay occurs in seven of them: 116Cd, 82Se, 100Mo, 96Zr, 150Nd, 48Ca and 130Te. The two other isotopes, Cu and natural Te, have a negligible impurity and are mainly used for measuring the background from external sources. The 100Mo and 82Se foils have the highest mass in the experiment, thus much effort has been focused by the NEMO collaboration into neutrinoless double beta decay searches of these isotopes [53, 54, 55].
The neodymium source foil
The neodymium-150 composite foil (Nd2O3) was enriched (95.0 0.5% of isotope 150) by the Institute for Nuclear Research of Moscow. It is situated in foil 6 of sector 5 (Figure 5.1). The length of the active foil is 234 cm and the width is cm. The total mass of the 150Nd foil is 57 g, in which g is 150Nd, 6.458 g is a Mylar support film and the remainder is composed of foil impurities and polyvinyl alcohol (PVA). The impurities inside the foil were measured using a high purity germanium (HPGe) detector to be 234mPa, 207Bi, 154Eu, 152Eu,214Bi, 214Pb, 208Tl and 40K [50].

4.3 The tracking detector
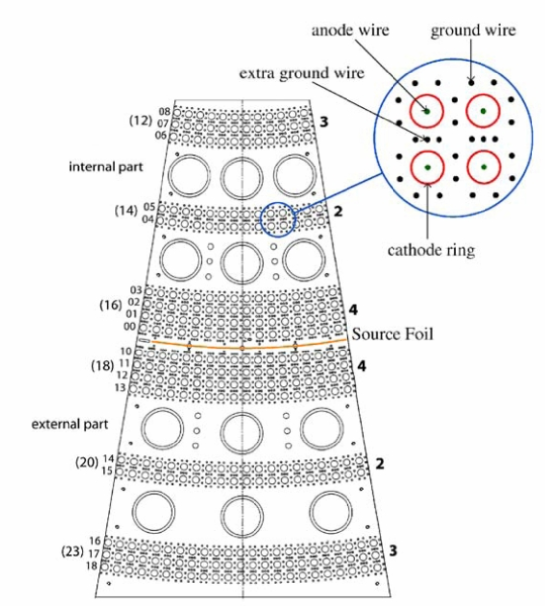
The tracker consists of octagonal drift cells operating in Geiger mode [56]. Each of the 20 sectors has an internal and external tracking volume, each containing drift cells arranged in a 4-2-3 layer configuration as shown in Figure 4.5. This gives a total of nine drift cell layers on each side of the source foil to reconstruct the particle tracks.
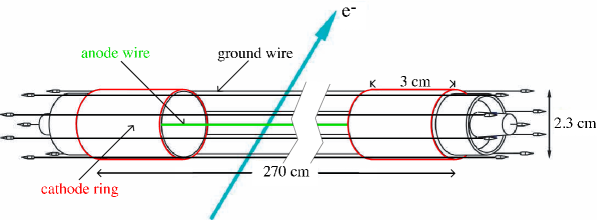
Each cell has a diameter of 3 cm and a length of 270 cm, and contains a central anode wire surrounded by eight ground wires. The layers of drift cells are separated by an extra ground wire in order to reduce electrostatic cross-talk. All wires are composed of stainless steel and have a diameter of 50 m. The tracking cells are strung between top and bottom walls. At the top and bottom of the wires there are 3 cm long copper cathode rings with a diameter of 2.3 cm. Figure 4.6 shows a diagram of a drift cell in NEMO 3.
Drift cell operation in NEMO 3
The tracking system is immersed in a gas mixture of helium (95%), argon (1%), ethyl alcohol (4%) and water (1500 ppm). The Geiger mode operating voltage of the cells is around 1620 V. When a charged particle passes through a cell, it causes ionisation of the gas atoms. The result is a track of He+ ions and free electrons. These electrons drift towards the anode wire and cause further ionization, triggering an avalanche process as the electrons accelerate. The avalanche process becomes significant in the region very close to the wire (around 1 mm), where the electric field is high. When the avalanche arrives on the anode, it causes a pulse which has a typical rise time of 10 ns. The time to digital convertor (TDC) connected to the anode gives the arrival time of the initial avalanche to the anode and thus the transverse position of the particle track.
The helium ions produced by the charged particle and the resulting avalanche create UV photons which travel further along the cell. These cause further ionisation in the drift cell and new avalanches. Under the high voltage environment of the drift cell this process is smooth and propagates at a constant velocity toward both ends of the cell. Upon reaching the ends, the ions are collected by the copper cathode rings. The arrival time of the plasma at each cathode, which is measured by the TDC of each cathode, is used to determine the vertical position of the particle track passing through the cell.
Helium is a low atomic number gas, thus it minimises the energy loss by a charged particle passing through the gas. Ethyl alcohol plays the role of the quencher, which neutralises helium ions and limits the creation of the UV photons and therefore avalanches. A small amount of argon (1%) and water (1500 ppm) were added later during the commissioning of the detector in order to increase the plasma propagation efficiency and to reduce noise and improve the cell stability [57].
4.4 The calorimeter
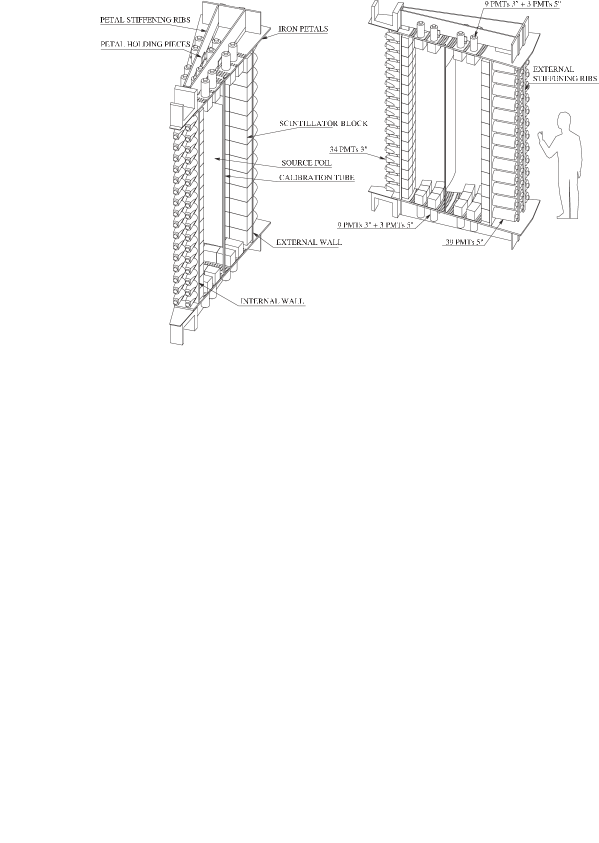
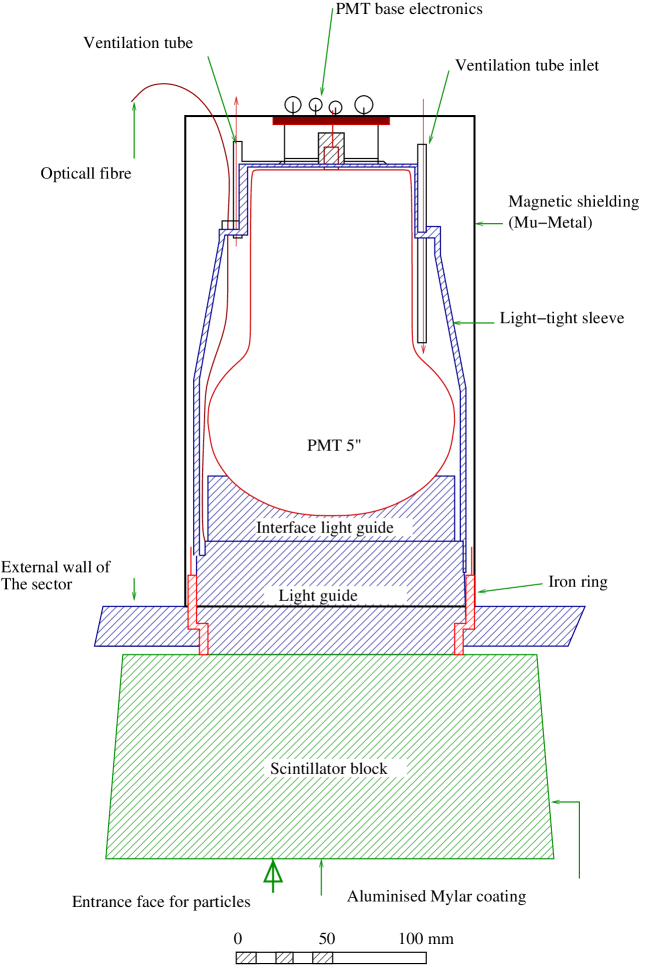
The calorimeter in NEMO 3 measures the energy and the time of flight (TOF) of particles. It consists of 1940 large scintillator blocks coupled to 3” and 5” photomultiplier tubes (PMTs) via light guides. The scintillator blocks are produced from low radioactive polystyrene which also provides minimum back scattering. The blocks cover the inner and outer cylindrical walls that surround the tracking volume and the top and bottom of each sector. In order to minimise energy loss, the scintillator blocks are mounted inside the helium-alcohol gas mixture of the tracking volume. Figure 4.7 shows a schematic view of one of the scintillation detectors with a 5” PMT. The energy resolution (full width half maximum, FWHM), , of the NEMO 3 calorimeter is 14% at 1 MeV and 8% at 3 MeV, and the time resolution is 250 ps. In addition to 1940 PMTs in the calorimeter, there are six reference PMTs situated outside the detector that are only used during laser calibrations (Section 4.8).
4.4.1 The scintillators and the light guides
The scintillators of the calorimeter are made in seven different shapes designed to completely cover the cylindrical geometry of NEMO 3. The thickness of the scintillators is approximately 10 cm throughout. The width and length are between 11 cm and 15 cm. Charged particles lose energy rapidly when passing through polystyrene via molecule excitation. As the molecules de-excite, photons are produced at a wavelength transparent to polystyrene. Photons incident on the scintillator lose energy via Compton scattering and the resulting electrons then lose energy as described previously. The scintillation detectors have a detection efficiency of 50% at 500 keV.
In order to transmit scintillation photons to the PMTs, polymethyl methacrylate (PMMA) light guides are optically glued to the back face of the scintillator blocks. The light guides are 60 mm thick and are glued to the detector walls to provide a seal against the helium-alcohol environment of the tracker.
4.4.2 The photomultiplier tubes
The photomultiplier tubes (PMTs) convert optical signals from scintillators to measurable electrical signals. They achieve this via the photoelectric effect and avalanche multiplication. There are two sizes of PMTs used in the calorimeter, 3” and 5”. The 3” PMTs are mounted on scintillators at the top and bottom regions of each sector, and the 5” PMTs are mounted on scintillators around the inner and outer cylinder walls. The PMTs used have been specially produced to have three times lower radioactive contamination than a standard PMT. The gain of the PMTs is adjusted to cover a range of energies up to 12 MeV. In order to protect them from the external light the PMTs are contained in black plastic boxes. The output signals from PMTs pass through discriminators. These produce logic high signals when the PMT pulse passes a minimum threshold. The discriminator signals are used to start the time measurement and charge integration which are performed by time to digital convertors (TDCs) and analogue to digital convertors (ADCs), respectively.
4.5 The Trigger and readout
The trigger ensures that only events of interest are read out. As NEMO 3 is a low count rate experiment a simple hardware trigger is used to achieve this. The trigger is connected to the calorimeter electronics. When it receives a signal from a PMT which has passed a discriminator threshold of 48 mV, it generates the STOP-PMT signal after ns. This signal stops the charge integration and time measurements performed by an ADC and a TDC, respectively.
In the next stage, the tracking readout system is programmed to search for activation of drift cells in each half-sector (inner or outer). If enough cells are activated (3 out of 9 layers), the STOP-A signal is generated and sent to the drift cell acquisition boards with a programmable delay set at s after the STOP-PMT. The STOP-A signal stops the TDC measurement of the drift cell anodes (TDCA) and the anode drift times are calculated.
Finally, the STOP- signal is sent to the drift cell acquisition boards with a fixed delay of 710 s after the STOP-PMT signal. This signal is to stop the TDCα, which is a TDC independent of TDCA, and is used for calculation of the drift time for delayed hits. This is designed to detect alpha () particles from daughter isotopes of radon and have a half-life of 164 s. The value of 710 s is more than four times this half-life to have high detection efficiency for –particles.
4.6 Magnetic coil and shielding
A solenoid surrounding the entire detector produces a 25 Gauss magnetic field vertically through the detector. The coil is cylindrical and is 5220 mm in diameter and 2713 mm in height. This causes charged particle tracks to bend as they pass through the detector allowing the identification of electron and positron tracks.
Iron plates, wood panelling, borated water and an anti-radon tent form the external shielding for the detector. The iron plates are 20 cm thick and use low radioactivity iron to stop photons coming from outside the detector. The water and wood comprise a thick shield which slows down fast neutrons and captures them. The wood covers the top and bottom of the detector and is 28 cm thick. The borated water tanks, which are 35 cm thick, cover the cylindrical external walls of the detector.
4.7 The anti-radon facility
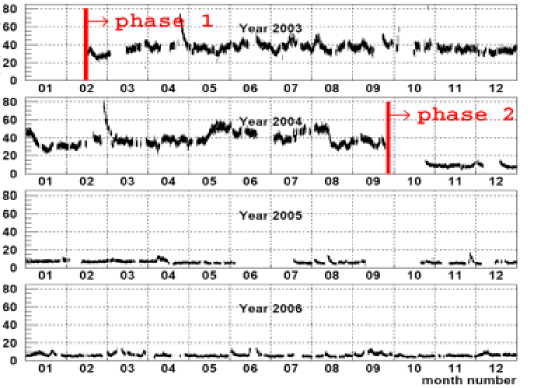
After running the detector for approximately one year, it was discovered that the radon level inside the detector was too high (with a total activity of around 0.7 Bq) and adversely affecting the experiment’s sensitivity. This was caused by radon diffusion through the glued joints between sectors. In order to reduce the radon contamination inside the detector an anti-radon facility was installed in September 2004. It consists of an airtight tent and a radon trapping facility.
The detector is fully enclosed in an airtight tent that is made of two layers of polyethylene. It allows only radon-free air to pass through from the radon-trapping facility into the detector and isolates it from laboratory air. The radon trapping system uses activated charcoal that has been treated with oxygen to open up numerous pores inside the material. When air passes through the charcoal, radon is trapped in these pores. The trapping time is greater than the radon decay time. Therefore radon decays before reaching the tent.
As a result of this system, the radon activity inside the detector has been reduced by a factor of six. Figure 4.8 shows the level of radon inside NEMO 3 before and after the installation of the anti-radon system.
4.8 Calibration of the calorimeters
In order to convert the charge output of the PMTs to energy, a calibration procedure is performed. In NEMO 3 there are dedicated calibration runs which take place once per month and last 24 hours. During this time radioactive sources with well known energy spectra are introduced near the double beta decay sources. As NEMO 3 is mainly focused on electron energy measurements, the selected radioactive sources emit electrons. The 207Bi source decays by a conversion process to two electrons [59] (see Section 6.1.1) with energies of 482 keV and 976 keV, and is suitable for energy calibration up to 1.5 MeV. In order to calibrate the energy up to 3 MeV and higher, 90Y, which is a pure beta emitter with transition energy of 2.283 MeV, is used.
The timing responses of the PMTs are not identical. The time calibration is performed to make the timing response uniform for all the PMTs in the calorimeter. Currently, electrons and photons from 207Bi sources are used for the time calibration. The particle with the higher energy decays with a delay of 133 s. This time is subtracted from the arrival time of the delayed signal. The time difference between the prompt and delayed signals is then used to make the time response uniform.
Daily studies of the stability of the PMTs (in time and energy measurements) are performed using a laser survey system. The purpose of this system is to check the absolute energy and time calibration. It also measures the PMT response linearity between 0 and 12 MeV. Laser light with a known intensity is sent to the PMTs of the calorimeter via optical fibres. Six reference PMTs are connected to scintillators with embedded 207Bi sources and also to the laser survey system via optical fibres. They are used to check the stability of the laser light intensity which is received by the PMTs in the calorimeter. The laser energy calibration is not applied to the data used in this thesis, as the laser data analysis was not ready for use with the analysis presented. The effect of not using this correction has been studied and is included as systematic uncertainty (Sections 7.3).
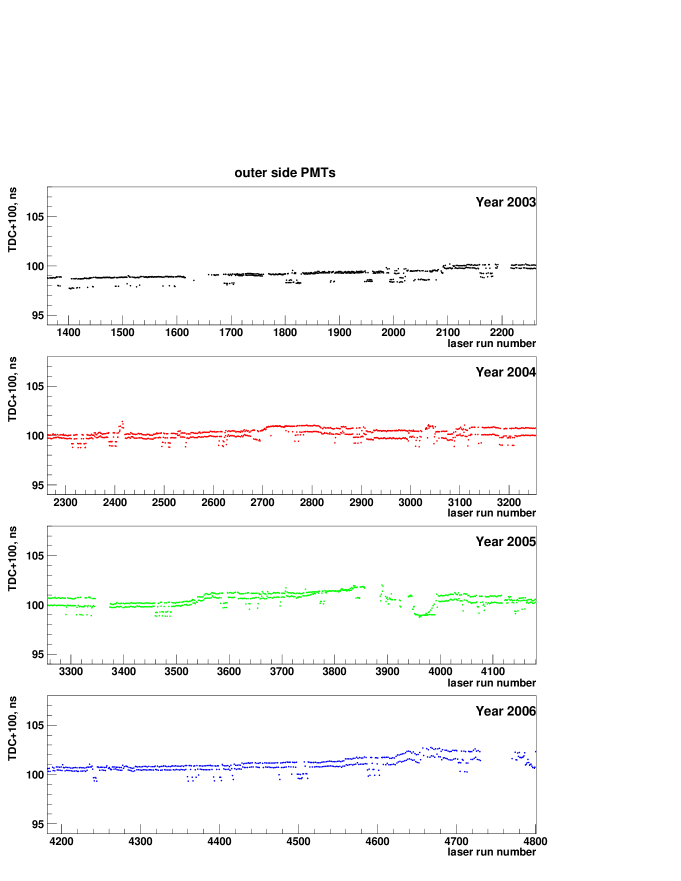
The laser time correction
During the analysis of NEMO 3 data in September 2006, it was discovered that the timing measurements of the PMTs were not correct. The time measured by the TDC counter of a given PMT was expected to remain constant for different laser runs; however, a discontinuity was observed in the distribution of the TDC time (Figure 4.9). This effect was seen in the PMTs of all the 20 sectors. To solve the timing problem a correction was introduced known as laser time correction (LTC) [60]. The measured TDC for each PMT is compared to the reference run as follows:
| (4.1) |
where is the time measured by the PMT in the laser run , and is the reference laser run. In this run the maximum number of PMTs were active and they were known to be relatively stable and the timing measurements performed by the TDCs were known to be correct. The value of LTC is added to the TDC values of the PMTs and calculated in each laser run to correct the deviation in timing.
Chapter 5 Analysis technique
This chapter describes techniques used to prepare data for analysis, including the reconstruction of raw data and Monte Carlo (MC) simulation. The 150Nd foil geometry is defined in Section 5.5. Section 5.6 describes the time of flight (TOF) selection that is used in all analysis channels. The statistical methods used to compare simulated events to data and set limits on several processes are described in Section 5.7 and Section 5.8, respectively.
5.1 Reconstruction of particle tracks
The raw hits in the tracker that are written to data storage tapes are processed by reconstruction software. According to the tracker anode and cathode time values, the triggered drift cell hits are classified as “in time hits”, “delayed hits” or as cells fired by neighbouring cells (“re-fired cells” and “noisy cells”). “In time hits” are usually due to the electrons or positrons and “delayed hits” are caused by particles. Hits are only reconstructed as tracks if they are “in time hits” or “delayed hits”. For “in time hits” the anode time values must not be more than a maximum value (currently s found from Geiger calibrations). For “delayed hits”, the time measured by the anode is up to 710 s. The anode drift time and the cathode times provide the transverse and longitudinal position of a hit in a drift cell, respectively.
Tracks are reconstructed if there are “in time hits” in at least three of the nine drift cell layers, with at least two of the hits occurring in neighbouring layers. The pattern recognition is carried out using a cellular automation algorithm [62]. This algorithm defines segments as the lines which connect two hits in neighbouring layers. In order to take into account all inefficiencies, the segments may connect two hits which are not in neighbouring layers if there is no hit in between. The angle between the two segments with a common hit can not be more than degrees. To connect two cells with a segment there are four possibilities, as each cell has two edges, right and left. The ambiguity is resolved by finding the longest and smoothest pattern of combined segments.
Once the pattern is found, an iterative fit is performed assuming the track follows a helix (due to the magnetic field). The curvature of the track indicates if the particle is an electron or positron. The reconstructed track is extrapolated back to the source foil and projected onto an associated scintillator surface. The coordinates where the track crosses the foil and the scintillator are calculated. Assuming that the tracks originate from the foil, the former gives the vertex of the event. For “delayed hits”, the time which is measured by TDCα is used to reconstruct the track in the plane.
The vertex resolution
The resolution of the reconstructed vertex of the two electrons in the transverse plane depends on their energy. By using two electrons from 207Bi source foils (Section 4.8), the vertex resolution is found to be mm at 0.5 MeV and mm at 1 MeV in the ) plane. The longitudinal vertex resolution depends on both energy and position of the electrons in the direction. For 1 MeV electrons, the resolution is mm if the vertex is in the top or bottom of the detector and mm if it is in the centre. For 0.5 MeV these values change to mm and mm, respectively [63].
5.2 Particle identification
Particle identification is possible by combining the information provided by the tracker and the calorimeter. NEMO 3 is able to identify electrons, positrons, photons and alpha particles.
Due to the magnetic field charged particle trajectories are curved. In NEMO 3 the curvature sign of a trajectory is found with respect to the surface of the source foil. Thus, an electron (positron) originating from the foil is identified as a track of negative (positive) curvature, which is associated with only one scintillator hit. A photon () is identified as a scintillator hit which is not associated with a track. As the energy losses between the scintillator blocks are not known, events are rejected if the photons or electrons are detected by two scintillators. The rate of fake scintillator hits is negligible.
An alpha () particle can be identified only if it is accompanied by at least one electron track. Alpha particles are mainly produced by 214Po decay which is in the radon (222Rn) decay chain. They are defined by drift cell hits delayed by more than 70 s. As the range of -particles from 214Bi decay in the helium gas of the tracking chamber is 25–40 cm [61], the distance between the reconstructed vertex of the electron and the delayed drift cell(s) corresponding to an -particle is required to be cm in the vertical direction and cm in the plane.
5.3 Event simulation in NEMO 3
Monte Carlo (MC) programs are used as event generators that simulate initial particles from isotope decays. The generated events are passed through simulations of the detector response so that the output can be compared to data. Resolution and detector acceptance effects are taken into consideration in the simulation. MC simulations are necessary for analysing experimental data. The MC events are used to measure detector acceptances and to compare the generated physics signal with that seen in the detector. Selection criteria can be optimised by studying the signal to background ratio for specific processes.
The NEMO 3 simulation program [64] uses GENBB as the generator. GENBB simulates the initial kinematics of the particles for two-neutrino double beta decay, different theories of neutrinoless double beta decay and all the possible radioactive backgrounds to the double beta decay processes. GENBB also provides the possibility to generate the kinematics of Compton scattering of photons from sources outside the detector (external photons) and Mller scattering of external electrons.
The particles generated with GENBB (photons, electrons, positrons and alphas) pass through the various regions of the detector. The description of the geometry of the detector and the simulation of the detector response is developed in the framework of the GEANT 3 package [65]. The interactions of the particles with the source foils, tracking wires, the scintillators and other material in the sectors are taken into account in the simulation.
5.3.1 The reconstruction of the simulated events
The analysis in this work involves estimating the composition of data samples based on MC simulations of the various processes. The simulated events were reconstructed in the same way as the experimental data. The functionality of the calorimeter and the tracker components in each run period is slightly different. This gives different detection efficiency for each run (for example having noisy PMTs disconnected from the detector decreases the efficiency). For the reconstructed MC simulation to have real detector conditions, the simulated events are assigned to the real data run periods. The number of events assigned to each run depends on the duration of the run. The detector conditions during the particular run are then applied to the simulated events associated to that run.
5.4 The data set
The analysis is performed on data taken between February 2003 and December 2006. This corresponds to runs 1869 to 5468. Each run represents a period of time in which data acquisition was performed. The length of the runs is typically hours. Data are removed from the analysis if any of the following conditions are met:
-
•
There was a major problem with the electronics of the detector during the run.
-
•
The run has been taken less than 24 hours after a general electronics shut down, as the PMTs of the calorimeter need time to stabilise.
-
•
They are taken less than 24 hours after 207Bi calibration runs. During such calibrations PMTs are known to have a high counting rate and require time to stabilise [66].
-
•
No laser run has been performed on the day that data were taken. The laser runs are vital as they give information about the behaviour of the PMTs, and also give the value of LTC (see Section 4.8).
-
•
No appropriate energy or time calibration of the PMTs is available.
After removing these data, the effective data taking time is calculated to be days. The data are divided into two sets: Phase 1 and Phase 2. Phase 1 is the data taken before installation of the anti-radon facility in September 2004 and Phase 2 is the data taken after the installation. The Phase 1 and Phase 2 data are combined throughout this thesis unless stated otherwise.
5.5 Definition of the 150Nd source foil boundaries
To define the foil position in the transverse plane, the polar angle, , is replaced by a sector number. The sector number is related to the polar angle by:
| (5.1) |
In the construction design of 150Nd, this value is between and . However, by studying the distribution of event vertex positions, it is observed that data are shifted with respect to the defined MC geometry. Figure 5.1a shows the distribution of the vertex position for two electron events coming from the foil (higher sector number). The discrepancy between data points and MC simulation can be observed on the right side of the 150Nd foil. From these plots no conclusion can be drawn for the left side of the foil, since two-electron events from 100Mo overlap with events from 150Nd. To check if the same effect is also observable on the left side, the electron-photon decay channel was analysed. In this channel the event rate for 100Mo is lower than 150Nd as this isotope has less contamination than 150Nd. Figure 5.1b shows the distribution of the vertex position for one electron and one photon events coming from the foil (full details of the electron-photon selection are given in Section 6.1.1). The discrepancy between simulation and data is observed on both left and right sides of the 150Nd foil. In order to correct this discrepancy, the 150Nd sector number was shifted by 0.01 of a sector number to lower values, in the simulation. The effect of this shift is shown in Figures 5.2a and 5.2b. The values of the data and MC comparison improve significantly. Therefore the 150Nd position was redefined to be between sector number 5.73 and 5.86. The active height of the 150Nd foil is 234 cm, thus the boundaries of 150Nd in the coordinate are defined to be cm.
a)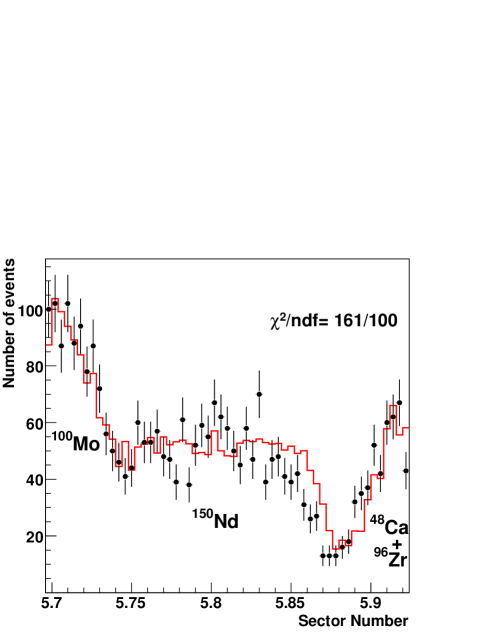
b)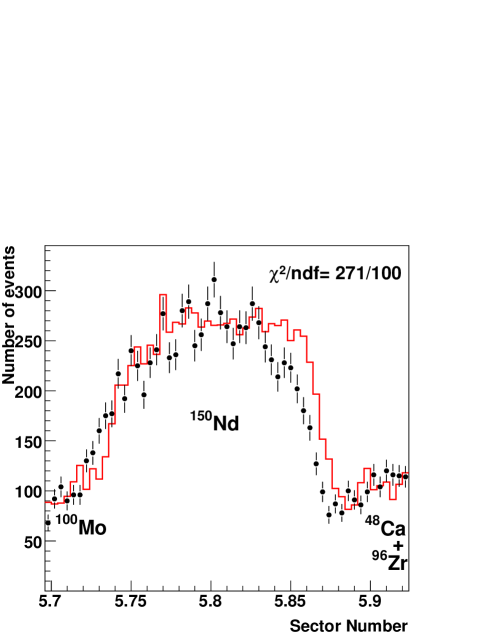
a)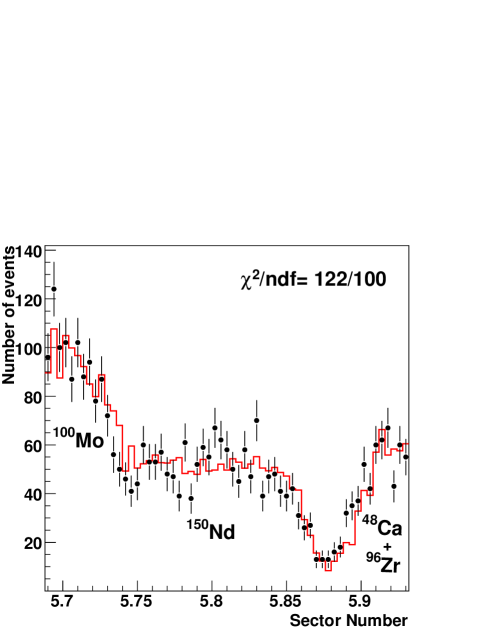
b)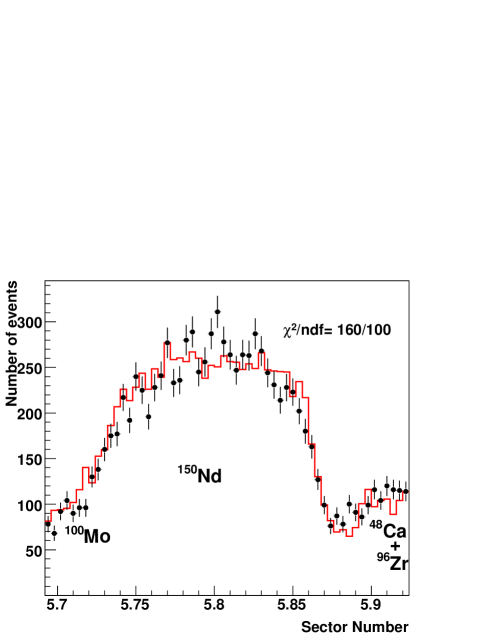
5.6 Time of flight selection criteria
It is possible that a particle from a source outside the foil deposits energy in one scintillator block, enters the tracking volume, interacts with the source foil, scatters off it and is then detected by another scintillator. These types of events, which are known as external events, can mimic two electron events originating from the foil (internal events). In order to reduce the number of these background events, a time of flight analysis is performed [67]. In this analysis, the time differences between the two calorimeter hits are calculated for two hypotheses. In the first hypothesis the two calorimeter hits and tracks are caused by two electrons from the foil (internal hypothesis). The second hypothesis assumes that the hits are from external sources (external hypothesis). The time differences calculated for both scenarios are then compared with the measured time difference of the calorimeter hits.
For each hypothesis, is defined as:
| (5.2) |
where is the measured time difference between the two scintillator hits; is the calculated time difference for the internal and external hypothesis; and and are the uncertainty on the measured and calculated time differences, respectively. The value of is related to the length of the particle trajectories, and , and the energies measured by the calorimeter, and . In the case of the internal (external) hypothesis for two-electron events, is defined as:
| (5.3) | |||
| (5.4) |
where the relativistic factor, , is related to the energy measured by each calorimeter block () and the electron rest mass ():
| (5.5) |
The theoretical uncertainty, , is found from differentiation:
| (5.6) |
where , is the uncertainty on the energy measurement and is the uncertainty on the track length.
The scenario for internal and external electron-photon events is similar except photons do not leave tracks in the tracker. To measure the length of the photon path, the distance between the scintillator hit and the intersection point of the electron track with the foil (the electron-photon vertex) is found. The length of the photon path, , and the time calculated for the photon to traverse this length, , are found by:
| (5.7) |
where , and are the coordinates of the vertex position of the events from the detector centre, and , and are the coordinates of the scintillator hit by the photon. As it is not known where in the scintillator the photon hits, these coordinates correspond to the centre of the face. The uncertainty on is related to the maximum dimensions of the scintillator face and the energy measured by the scintillator.
a)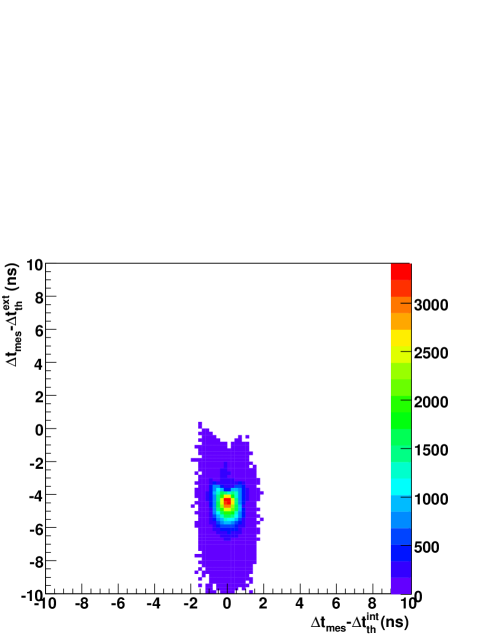
b)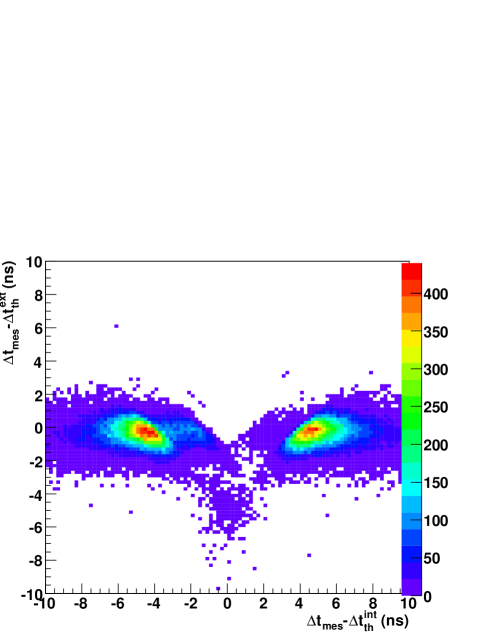
a)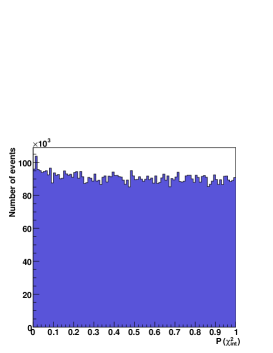
b)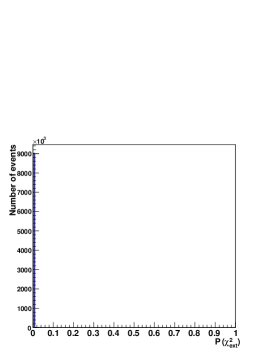
c)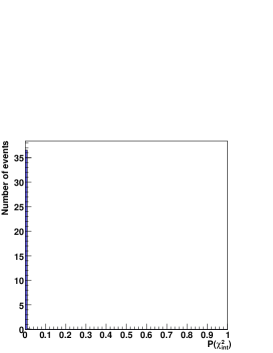
d)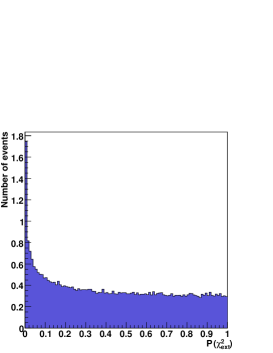
For an internal event, is expected to be zero ns with some uncertainty due to the time resolution, whereas has a value of the order - ns. The opposite applies for external events. Figures 5.3a and 5.3b show versus for internal two electron events (simulated decay of 150Nd) and external two electron events (simulated 214Bi contamination in the PMTs), respectively.
For both hypotheses, the probabilities, and , are calculated. The ) is defined as:
| (5.8) |
where . Figure 5.4 shows the and for simulated internal two electron events ( decay of 150Nd) and simulated crossing electrons events (214Bi contaminant of the PMTs). Figure 5.5 shows and for simulated internal electron-photon events (214Bi contaminant in 150Nd foil) and external electron-photon events (214Bi contaminant of the PMTs).
By using these MC distributions, data selections are optimised in order to select events originating from the foil or from the detector components [68]. The criteria for the internal events are
| (5.9) |
and for the external events are
| (5.10) |
a)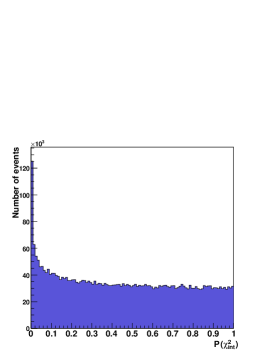
b)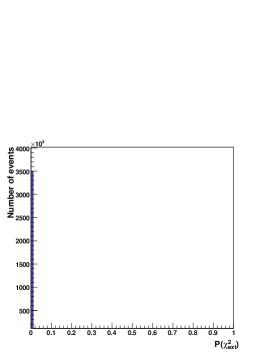
c)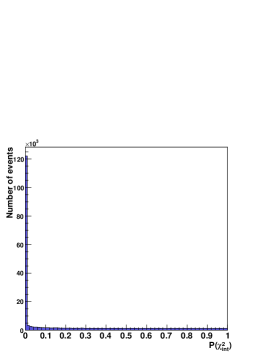
d)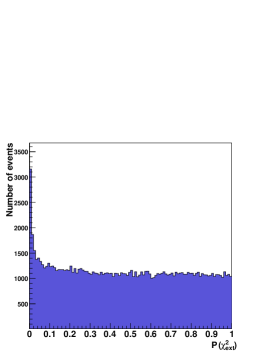
5.7 Fitting Monte Carlo samples to data
Chapters 6 and 7 are dedicated to the measurement of the radioactive background activities and half-life by comparing MC simulations to data. In the situation where only one MC component is not known, it is sufficient to do a simple fit based on the total number of data and simulated events. In this method the simulated events are normalised to the same number of events as total data events.
However, in the situation where more than one MC components should be estimated, a binned maximum likelihood fit [69] is used. In this technique, to fit number of MC sources to data, the shapes of the distributions are taken into account. The predicted (normalised) number of MC events in bin is given by
| (5.11) |
where is the total number of events in the data sample, is the total number in the MC sample for source , is the proportion of source in data, and is the expected number of MC simulated events from source in bin (which includes the unknown uncertainty in the bin).
The probabilities of observing a particular number of data events, , and a particular number of simulated events, , follow Poisson statistics:
| (5.12) | |||
| (5.13) |
The total logarithm of likelihoods is then defined by:
| (5.14) |
The proportion of each MC source, , is estimated by maximising Equation 5.14 using computing packages [70, 71].
5.8 Limit setting
The search for new physics in a double beta decay experiment involves dealing with small numbers of expected signal events (in the case of ) and much larger number of background events than expected signal events (in the case of with the emission of Majoron(s)). The exclusion of a signal at a particular confidence level (CL) can be significantly improved relative to a simple counting experiment by using the binned distribution of data, signal and background. In this way each bin is treated as an independent search channel.
A typical new physics search analysis is described by a final variable which is designed to distinguish between two possible hypotheses: the production and detection of the new physics along with the background (S+B hypothesis), or the presence of only the background (B-only hypothesis). The consistency between data and the signal and background models in this final variable is used to set a limit on the maximum number of signal events consistent with the data. The likelihood ratio test statistics [72, 73] is an optimal choice for searches with small statistics [74],
| (5.15) |
where and are the Poisson likelihood for the S+B and B-only hypotheses.
The limits in this thesis are calculated by using a likelihood-fitter [75] developed at the D experiment using a log-likelihood ratio (LLR) test statistic. A description of this method is given in [76]. The LLR is defined as [72]:
| (5.16) |
where is the the bin in the distribution used, is the number of expected signal events in that bin, is number of expected background events and is the number of data events observed in bin . The expected LLR distributions for both hypotheses are generated by performing a large number of toy Monte Carlo pseudo-experiments. In pseudo-experiments, the pseudo-data are the coherent sum of signal and background or background processes and thus their value in each bin is obtained by drawing a random number from a Poisson distribution where is the probability for obtaining events, given an expectation of events. The expectation of a number of events in each bin for each pseudo-experiment is varied according to the systematic uncertainties. The systematic uncertainties are introduced into signal and background expectations, , via Gaussian distributions,
| (5.17) |
where is a random number taken from a Gaussian distribution with a mean of zero and width of one and is the fractional uncertainty on the rate of the . The same random Gaussian number is used for correlated uncertainties. The LLR distributions for S+B and B-only hypotheses, built up from the pseudo-experiments can be compared with the observed value of LLR in the data (LLRobs or ). The LLRobs are found by substituting in Equation 5.16 with the number of observed data events (). The confidence level in S+B hypothesis is given by
| (5.18) |
where is the probability for the S+B hypothesis to produce an outcome which is less signal-like than that observed in the data and is defined by integrating the expected LLR distribution for S+B hypothesis. Similarly, the calculation of the confidence limit for the background only hypothesis is given by the probability for the B hypothesis to produce an outcome which is less signal-like than that observed in the data and is found by integrating the expected LLR distribution for B-only hypothesis,
| (5.19) |
Downward fluctuations of the background lead to inconsistencies between expected background and observed data and create inaccurate exclusion limits using [74]. To deal with this problem, is divided by and the value of the signal confidence level () is defined as [72]:
| (5.20) |
Figures 5.6a and 5.6b show two examples of LLR distributions. The data originating from 150Nd foil are used to create these distributions. In both figures the background model consists of plus all other radioactive background (See Chapter 7). In Figures 5.6a, the signal is and in Figure 5.6b, it is with the emission of a Majoron particle.
In order to calculate the observed limit on the signal rate, this rate is given a new value and the expected LLR distributions are re-generated from another series of pseudo-experiments and the observed LLR is recalculated. This leads to a new value of . This process is repeated through a range of signal rates until reaches the desired confidence level, which in this thesis, by convention, is () or 90% confidence level.
a)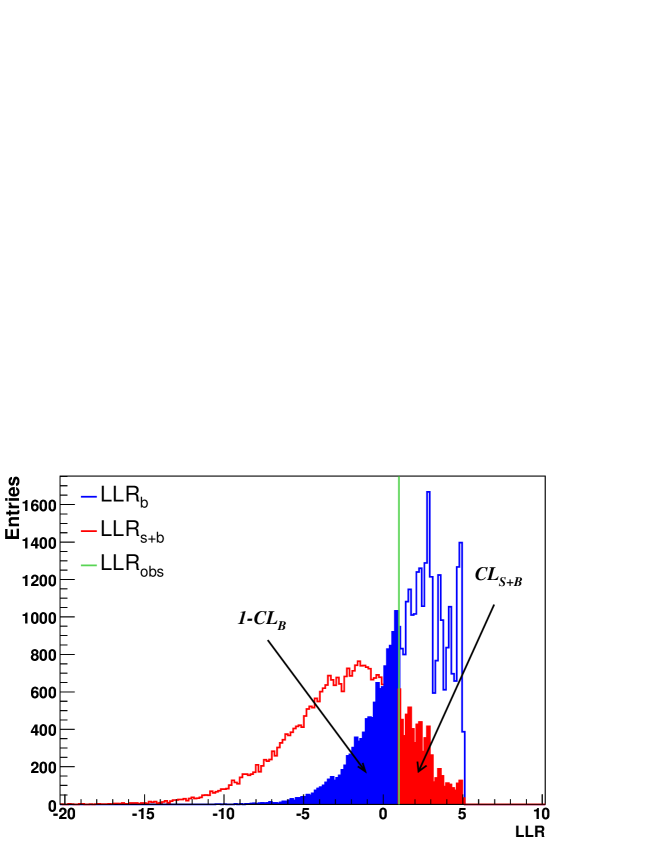
b)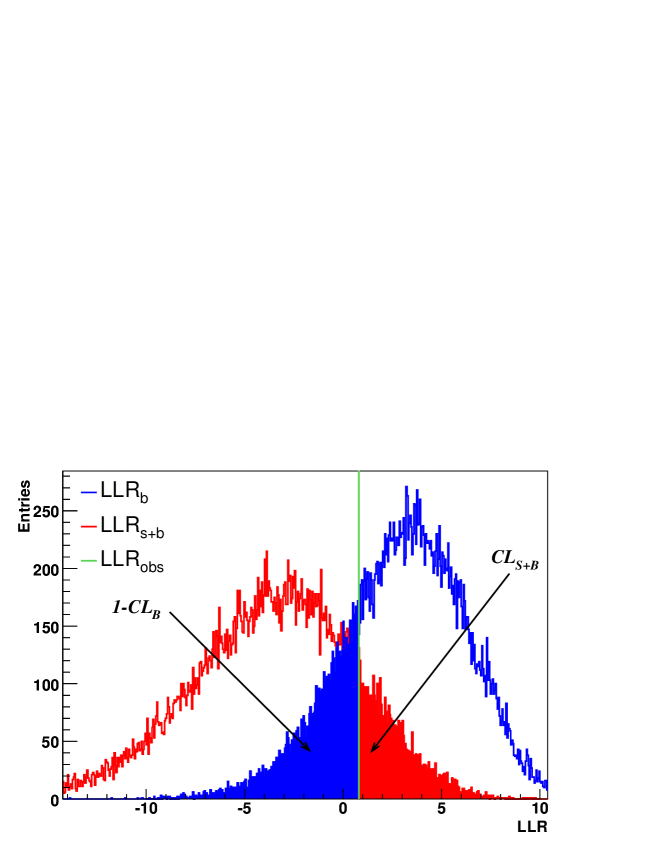
5.8.1 Definition of observed and expected limit
There are two distinct limits, the median expected and observed limit. The values of observed LLR () and median expected LLR () are found by setting and in Equation 5.16, respectively. The value of relative to indicates whether data appears to be more background-like or not. The expected limit on the signal rate gives the experiment sensitivity without any bias from actual observation. Thus, different experiments searching for a particular process can be compared using the expected limit results.
5.8.2 The profile likelihood ratio
Systematic uncertainties are often estimated rather than measured and frequently correspond to an upper bound on the true value. These systematic uncertainties widen the expected LLR distributions and decrease the analysis sensitivity for setting limits. This effect of systematics can be reduced by comparing the predicted shape of the final variable to that observed in data, and finding the best fit for systematic uncertainties to data observation [77]:
| (5.21) |
where is the systematically varied prediction in bin for the two hypotheses:
| (5.22) |
In the case of the S+B hypothesis , and in the case of the B-only hypothesis . The fitted value for systematics is indicated as . The optimal choice of the test statistic in this case is the profile likelihood ratio [75, 78]. This test statistic is the ratio of the minimised for each of the two hypothesis. The LLR is defined as:
| (5.23) |
To find the LLR distributions for the S+B and B-only hypotheses, in Equation 5.21 is replaced with the MC pseudo-data, and to find and , is replaced with the number of observed data and expected background events. The term in Equation 5.21 results in narrower LLR distributions than the ones resulting from Equation 5.16 and therefore increases the analysis sensitivity for setting limits. The Equations 5.18 to 5.20 are used to set limits on the number of observed and expected events at by varying the signal rate as before.
5.8.3 Floating the background normalisation
The function used in the fit model in Equation 5.21 includes a term () that adds a Gaussian constraint on each systematic uncertainty . If the normalisation on the background is not fully known, it can be “floated” by removing the Gaussian constraint. This allows a free normalization of the background in the fit.
Chapter 6 Estimation of the radioactive background
This chapter describes the measurement of the radioactive backgrounds to double beta decay of 150Nd in NEMO 3. The dominant decay channels of each background are discussed. The backgrounds to are divided into background and radioactive backgrounds that can mimic double beta decay. The former is discussed in Chapter 7. The latter, which are also backgrounds to , are divided into two categories: internal and external. The internal backgrounds are due to radioactive contamination inside the NEMO 3 source foils, whereas the external background is defined as events created by the radioactivity located in the detector’s components and the material surrounding the detector. Most contamination comes from the two main natural decay chains of uranium (238U) and thorium (232Th). These decay chains are shown in Figure 6.1. The detector components and the source foils are also contaminated with potassium-40 (40K), which is a naturally occurring radionuclide.
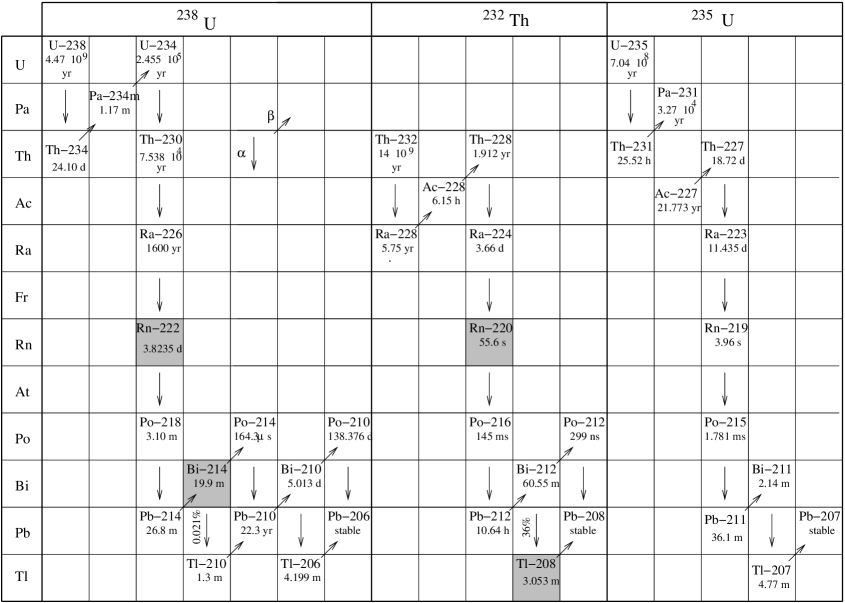
6.1 The internal background of the 150Nd foil
The internal contaminants can mimic double beta decay of 150Nd in four ways:
-
•
A decay accompanied by an electron from an electron conversion process. The latter happens when a photon from an excited daughter nucleus interacts with an electron in one of the inner electron shells, causing the electron to be ejected from the atom.
-
•
Mller scattering of a -decay electron in the foil which leads to emission of two electrons.
-
•
A -decay accompanied by a photon. In this case a second electron is produced via a Compton scattering.
-
•
Two-electron conversion processes due to the de-excitation of the daughter nuclei of 207Bi, 152Eu and 154Eu contaminants in the 150Nd foil.
Figure 6.2 shows the schematic of each of these four processes that can give two electrons with sufficient energy from a single vertex.
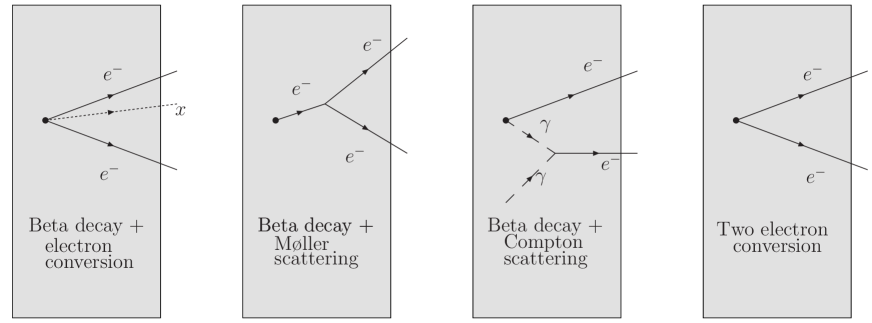
The internal contaminants vary in the different source foils of NEMO 3. The level of contamination was obtained (after the isotope purification) from measurements using a low-background high purity germanium (HPGe) detector [50]. This HPGe detector was able to detect photons from de-excitation of the daughter isotopes. The energy and the intensity of the photons indicated the contaminant and its abundance in the foil.
The HPGe radioactivity measurements for the Nd2O3 source foil are shown in Table 6.1. The half-life () and the nuclear transition energy () are also included for each element.
| 238U chain | 232Th chain | 235U chain | 40K | 152Eu | 207Bi | ||||
| 214Pb 214Bi | 234Th | 228Ac | 208Tl | 212Pb | |||||
| 26.8 min 19.9 min | 24.10 d | 6.15 h | 3.05 min | 10.64 h | – | 1.25109 y | 13.54 y | 32.9 y | |
| (MeV) | 1.02 3.27 | 0.27 | 2.13 | 4.99 | 0.57 | – | 1.31 | 1.82 | – |
| Activity (mBq/kg) | |||||||||
All of these contaminants are emitters, except 207Bi. The 214Bi and 208Tl with high value are the main radioactive background to of 150Nd. The other elements given in Table 6.1 can mimic events, except 234Th and 212Pb whose value is not high enough to mimic . However, 234Th decays to 234mPa which has a half-life of min and undergoes a decay with value of MeV and is thus a background to . The same statement is true for 212Bi which is a daughter isotope of 212Pb and has value of MeV and half-life of min.
The HPGe measurements show that the 150Nd foil is contaminated with 207Bi and 152Eu atoms. Both of these isotopes are artificial as they are not found in nature. Thus it is likely that the equipment used for 150Nd enrichment was polluted with small amounts of this isotope. Europium-152 is created from natural europium and is usually produced together with 154Eu (natural europium is a mixture of 151Eu and 153Eu) [79, 80]. This means, in addition to 152Eu atoms, there should be some 154Eu contamination, which the HPGe detector was not able to measure. Europium-154 has very similar decay schemes and half-life as 152Eu. ( MeV and =8.6 y). Both isotopes can undergo either decay (branching ratio of ) or an electron capture ().
The HPGe detector measurements are not definitive and are performed for a small sample of 150Nd and before installing the foil inside the NEMO 3 detector. In order to have a correct estimation of each internal radioactive background, precise measurements of the activities with NEMO 3 data need to be performed.
Background contaminants often decay in multiple channels (and not only the two-electron channel). It is vital to measure the background activities in channels which are independent of the signal. The activity of each background is determined using the decay channel with the highest branching ratio. The activity (A) of each contaminant (in Becquerel) is defined by the number of decays per second,
| (6.1) |
where is the number of data events found for the decay channel, is the number of background events to a specific contaminant, is the total data taking period in seconds and is the efficiency of the event selection criteria, which is found by the ratio of simulated events that pass the selections to the total number of generated events.
6.1.1 Electron-photon channel
The isotopes 207Bi, 152Eu and 154Eu decay predominantly to an electron and a photon. 207Bi can undergo electron capture and decay to the excited state of 207Pb. In this case the photon is produced by the de-excitation of the excited 207Pb and the electron is produced by the internal conversion process [59]. Figure 6.3 shows a decay scheme of 207Bi, in which only the most intense transitions are shown. This decay scheme shows that the electron and photon energy peaks are at 0.57 MeV and 1.06 MeV. In the NEMO 3 experiment, due to energy loss in the foil, the energies of these peaks are slightly shifted.
152Eu can either undergo a decay () or electron capture () to produce several excited states of 152Gd or 152Sm. These daughter isotopes de-excite to the ground states resulting in the production of photons of various energies [81]. Similarly, 154Eu undergoes decay to produce 154Gd [79] .
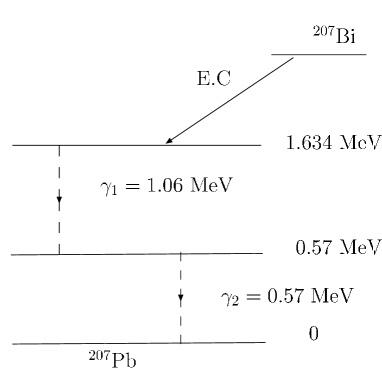
208Tl decays predominantly into one electron and two photons; however, it is possible that only one of the photons is detected and thus the activity of this isotope can be checked using the electron-photon channel. Further details of this isotope’s decay scheme are given in Section 6.1.2.
To select electron-photon () events originating from the foil the following event selection criteria are applied:
-
•
Only one electron track associated to a scintillator hit with deposited energy greater than 0.2 MeV.
-
•
The vertex of the event, which is found by extrapolating the electron track to the foil, is reconstructed inside the 150Nd foil (defined in Section 5.5).
-
•
The track has at least one hit in one of the first two layers of drift cells.
-
•
Only one scintillator block is found which is not associated with a track, with energy greater than 0.2 MeV.
-
•
The internal TOF hypothesis is greater than , and the external TOF hypothesis is less than .
-
•
The energy sum of all other scintillator deposits is less than 0.15 MeV. This requirement rejects events with more than one photon.
-
•
The TOF calculation is less precise for particles with short trajectories. Thus the events with photon and electron trajectory lengths less than 50 cm are removed. The photons and electrons with trajectory length less than 50 cm are detected by the scintillators situated on top and bottom of the detector. Figures 6.4a and 6.4b show the electron track length and photon trajectory length before applying this requirement, respectively. Photons can have longer trajectory lengths than electrons because they can cross boundaries of sector 5 and be detected by the scintillators in the neighbouring sectors.
a)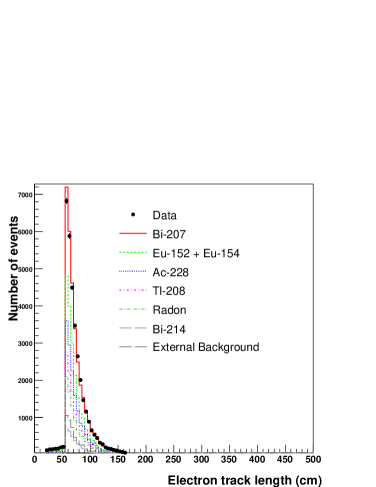
b)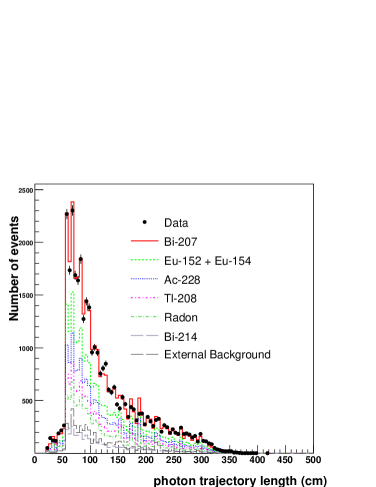
Figure 6.5 shows the reconstructed and components of the vertex in the 150Nd foil for the events that pass the event selection criteria. Several hot-spots are seen in this figure. The two main hot-spots are in the regions:
| (6.2) |
Figures 6.6a and 6.6b show the electron and photon energies inside the hot-spot region. The normalisations of the 207Bi energy distributions are found by fitting simulated 207Bi events to data after background subtraction. The 207Bi activity is found to be ten times higher in these hot-spots and therefore this leads to the conclusion that these hot-spot areas are contaminated with 207Bi and they are therefore removed from the subsequent analysis.
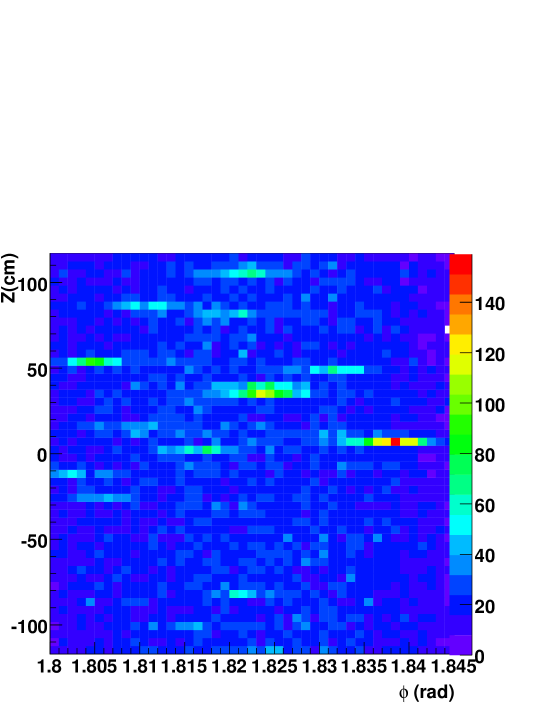
a)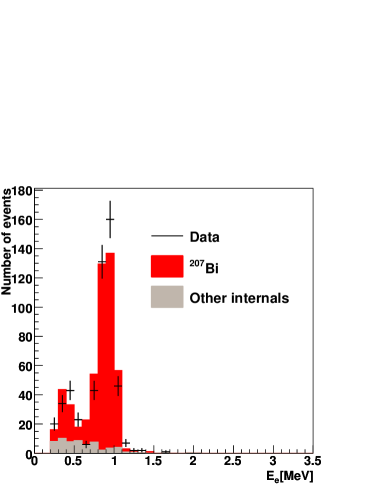
b)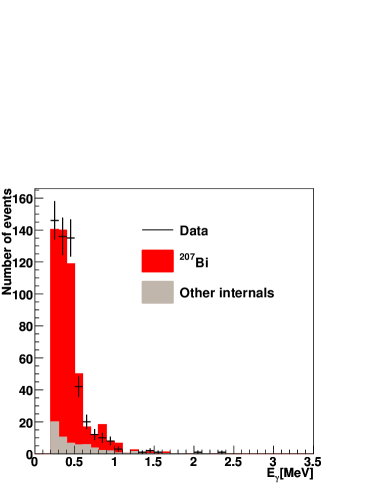
Figure 6.7 shows the cosine of the angle between the electron and the photon. A single electron from a decay can be scattered by a scintillator block and create a photon which is detected by the neighbouring scintillator. Thus events are rejected if the cosine of the angle between the photon and the electron is more than 0.9.
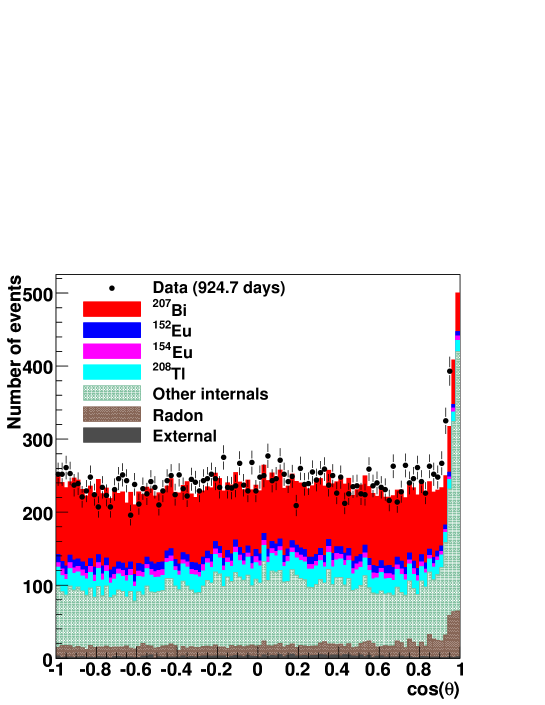
An event originating from the 150Nd foil is displayed in Figure 6.8. The intermediate circle illustrates the source foil and the blue hits illustrate the electron track. The scintillator hits are shown in red.
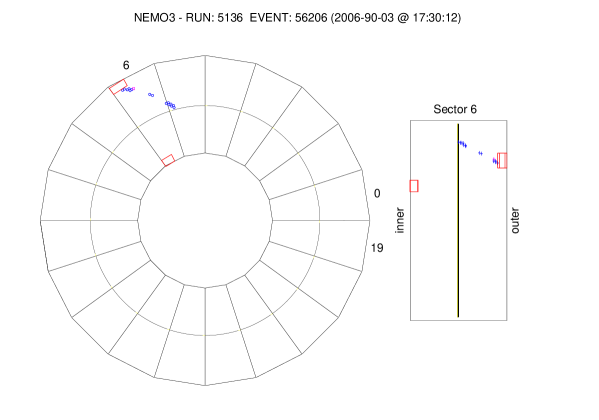
208Tl activity measurement
The activity of 208Tl is found in the energy region in which it dominates over all other background. Figure 6.9 shows the photon energy for simulated 208Tl (normalised to an arbitrary number) and the sum of all other internal contaminants. This plot demonstrates that in order to measure the activity of 208Tl in the electron and photon channel, the energy of the photon is required to be more than 2.0 MeV to increase signal over background. As the normalisation factors of other internal backgrounds at this stage of the analysis are not known this cut is applied in order to reduce internal background events from other contaminants.
After applying the photon energy requirement, the only background to 208Tl which remains in the data sample is the radon from the tracker (described in Section 6.2.1). The average activity of this background, which was measured by studying the electron-alpha channel [58], is mBq. Figures 6.10a and 6.10b show the photon and the electron energies for data and the simulated events with photon energy more than 2 MeV. In these figures, the distributions for simulated 208Tl and for data minus radon background are normalised to the same number of events. The event selection efficiency for 208Tl MC is %. The number of data events that pass the event selection criteria is of which events are estimated to be radon background. This gives a 208Tl activity of
| (6.3) |
Since the 150Nd source foil has a mass 50.7 gr, this value corresponds to
| (6.4) |
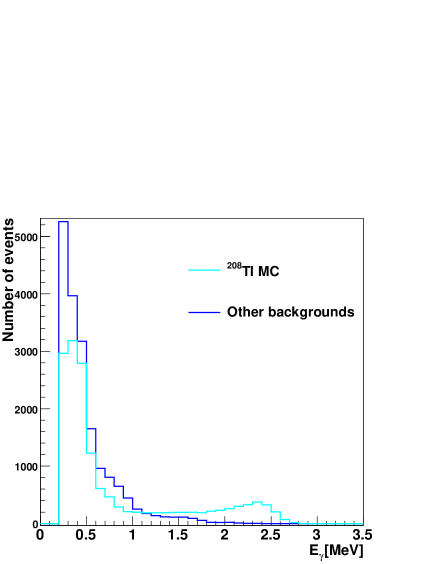
a)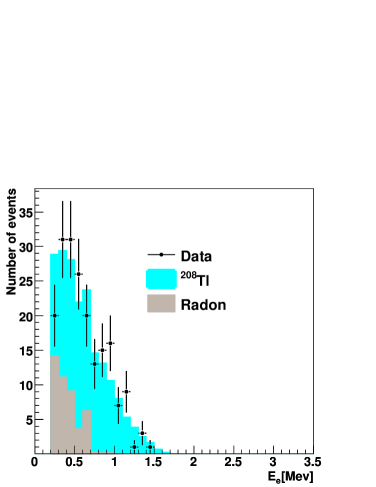
b)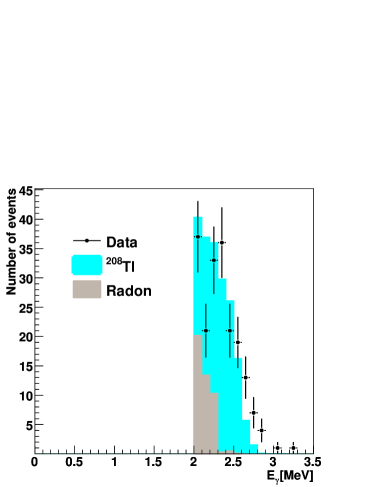
The isotopes 208Tl, 212Bi and 228Ac are all in the decay chain of 232Th. 212Bi can emit an particle and decay to 208Tl with a branching ratio of 36% [82]. Thus the activities of 228Ac and 212Bi are 36% of the 208Tl activity. The systematic uncertainty on this measurement and the final results of 208Tl activity will be given in Section 6.1.2.
207Bi activity measurement
To find the 207Bi activity, the following energy selections are applied:
| (6.5) | |||
| (6.6) |
In these energy regions, 207Bi dominates over all other background. Figures 6.11a and 6.11b show the electron and photon energies in these energy regions. The simulated 207Bi is normalised to data minus the total number of other background events. These backgrounds to 207Bi are normalised to the activities found by studying different energy regions (208Tl) or other decay channels (Sections 6.1.3 and 6.2). The number of candidate events is . The number of estimated background events is (stat). The efficiency is equal to %. Thus the activity of 207Bi is estimated to be
| (6.7) | |||
| (6.8) |
a)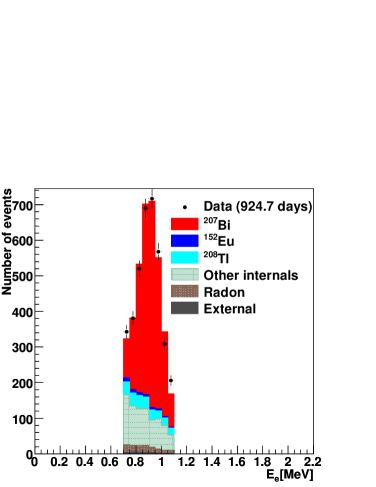
b)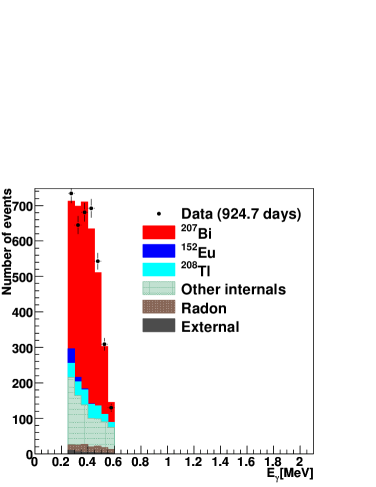
a)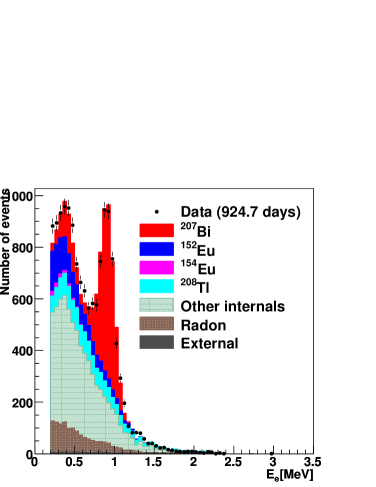
b)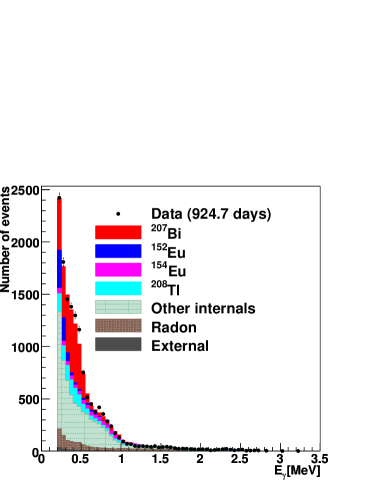
c)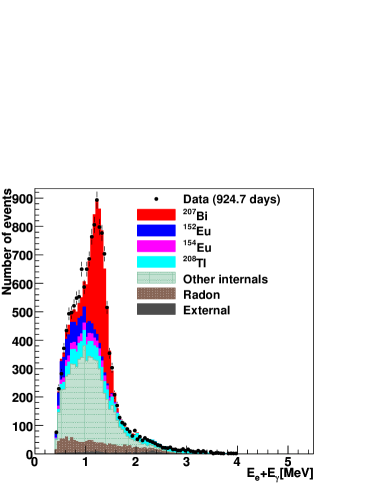
152Eu and 154Eu activity measurements
The activities of 152Eu and 154Eu are found by fitting their simulated photon energy spectrum to data minus all other background events simultaneously. A binned maximum likelihood fit as described in Section 5.7 is applied. The fit is applied to the full range of the photon energy distribution. The total number of data events is . The 207Bi and 208Tl activities are normalised to the activities given in Equations 6.3 and 6.8. The total number of background events is (stat). By applying the fit, the number of events from 152Eu and 154Eu are found to be (stat) and (stat) and the efficiencies for selecting events from these isotopes’ decays are (% and %, respectively. The errors on the number of 152Eu and 154Eu events are determined by the fit. The activities of 152Eu and 154Eu are:
| (6.9) | |||
| (6.10) | |||
| (6.11) |
Figure 6.12 shows the energy of the electron, photon and the sum of the energies of these two particles. The simulated 208Tl, 207Bi, 152Eu and 154Eu are normalised to the activities found in this section. Other background’s energy distributions are normalised to activities found from other decay channels. These plots demonstrate that background MC fits data well in the internal channel.
6.1.2 Electron plus two photon channel
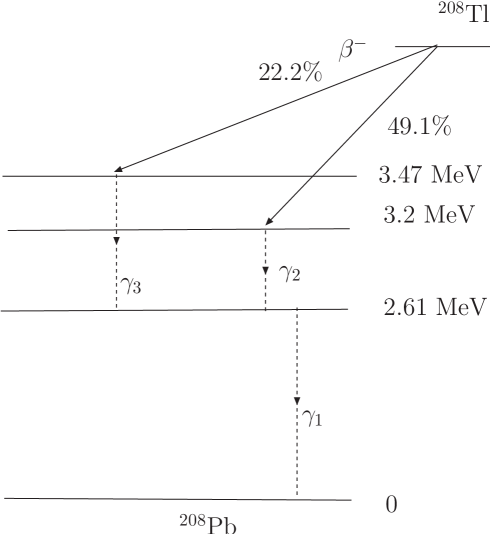
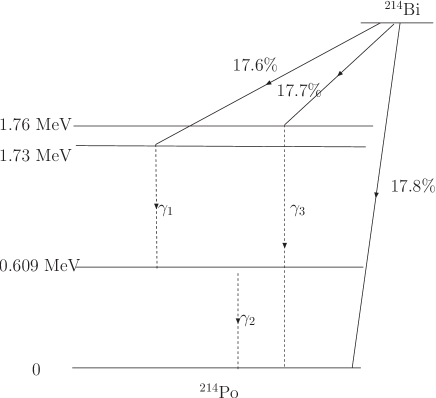
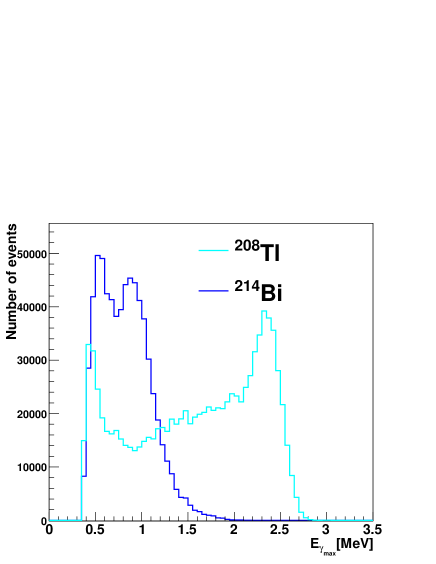
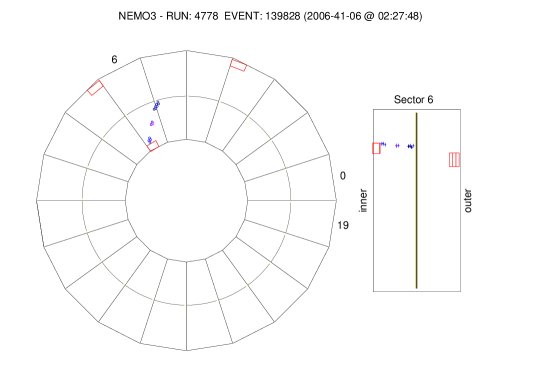
a)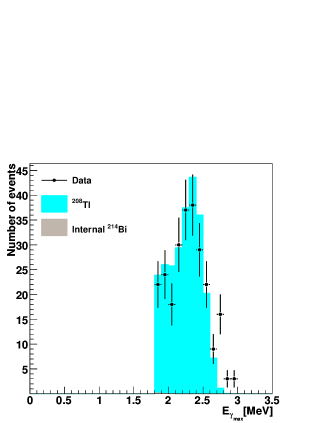
b)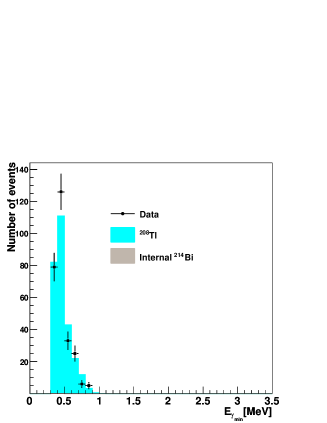
c)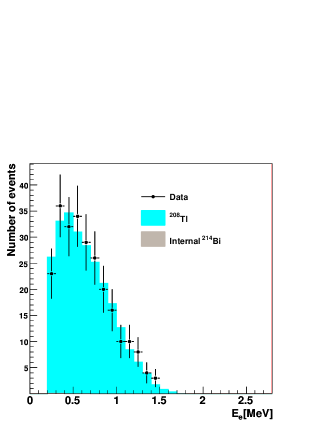
d)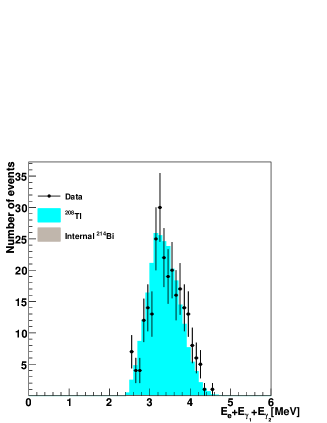
a)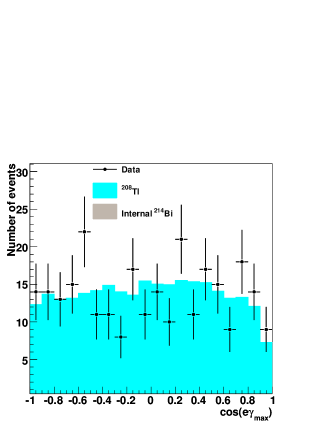
b)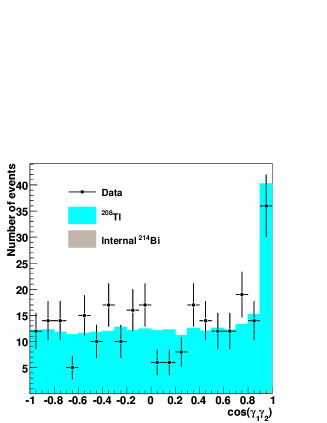
The isotope 208Tl can undergo a decay to an excited state of 207Pb which de-excites to the ground state via two-photon emission. The first photon has an energy of 2.6 MeV and is accompanied by a second photon with an energy of 0.58 MeV or 0.86 MeV. Figure 6.13 shows the decay scheme of 208Tl. The main internal background to 208Tl in this channel is 214Bi which can undergo a decay and form an excited state of 208Po which de-excites either by emission of two photons with energies of 0.61 MeV and 1.12 MeV or a photon with energy 1.76 MeV (a decay scheme is shown in Figure 6.14).
To select one electron plus two photons originating from the foil, the following event selection criteria are applied:
-
•
Only one electron track associated to a scintillator hit with deposited energy greater than 0.2 MeV.
-
•
The vertex of the event, which is found by extrapolating the electron track to the foil, is reconstructed inside the 150Nd foil (defined in Section 5.5).
-
•
The track has a hit in one of the first two layers of the tracker.
-
•
Two scintillator hits are found with the deposited energies greater than 1.8 MeV for the higher energy photon and greater than 0.35 MeV for the lower energy photon. These energy requirements which are based on the decay scheme of 208Tl are effective to reject internal 214Bi background. Figure 6.15 compares the distribution of the higher energy photons for the simulated 214Bi and 208Tl.
-
•
The internal TOF hypothesis for each pair is more than , and the external TOF hypothesis is less than .
-
•
The energy sum of all other photon clusters is less than 0.15 MeV.
-
•
The length of the electron and photon trajectories is more than 50 cm.
Figure 6.16 shows a typical internal event display. Figure 6.17 shows the energy distributions of the photons and the electron for events that pass the event selection criteria. The energy sum of all the decay particles is also shown. Figure 6.18 shows the cosine of the angle between particles. The simulated 208Tl is normalised to the same number of events as data minus 214Bi background. These plots show that the background MC describes data well in this channel. The expected number of 214Bi events is (stat). This value is found by normalising the simulated 214Bi events to the activity of mBq, which was measured by studying events originating from the foil [58]. The number of data events is found to be . The 208Tl event selection efficiency for this channel is . The activity of 208Tl is thus found to be:
| (6.12) | |||
| (6.13) |
Measurement of the background uncertainties by comparing the e and results
To estimate the systematic uncertainty on the measurement of the 208Tl activity, results from the and channels are compared. The mean value of the two activities given in Equations 6.3 and 6.12 is obtained. The systematic uncertainty is found by calculating the deviation of each activity from the mean of the two extracted activities. The final 208Tl activity is thus measured to be:
| (6.14) | |||
| (6.15) |
By normalising 208Tl background to this value and refitting, the 207Bi, 152Eu and 154Eu activities are remeasured to be:
| (6.16) | |||||
| (6.17) | |||||
| (6.18) |
As with 208Tl, the uncertainties on the 207Bi, 154Eu and 152Eu activities are defined by the difference from the mean values. Thus the final activity results for these isotopes are
| (6.19) | |||||
| (6.20) | |||||
| (6.21) | |||||
The reconstruction of an additional photon in the channel gives the systematic uncertainty on the photon detection efficiency. Other systematic uncertainties, including the uncertainties on the electron detection efficiency (section 7.3), are negligible for the purpose of these results.
6.1.3 Single-electron decay channel
The isotopes 234mPa and 40K predominantly undergo decay. Thus the activities of these internal contaminants are measured by studying the single-electron () channel. The following requirements are applied to select events:
-
•
Only one electron is found in the event with energy greater than 0.5 MeV. This energy requirement eliminates a large amount of low energy events which are not relevant for this analysis.
-
•
The electron track must originate from the 150Nd foil.
-
•
The length of the track is greater than 50 cm.
-
•
The track has at least a hit in one of the first two layers of the tracker.
Figure 6.19 shows the reconstructed component versus the component for single-electron events. A hot-spot is observed in the region:
| (6.22) |
which is highly contaminated with 234mPa (Figure 6.20) and has been subsequently removed from the analysis. Figure 6.21 shows a decay event display.
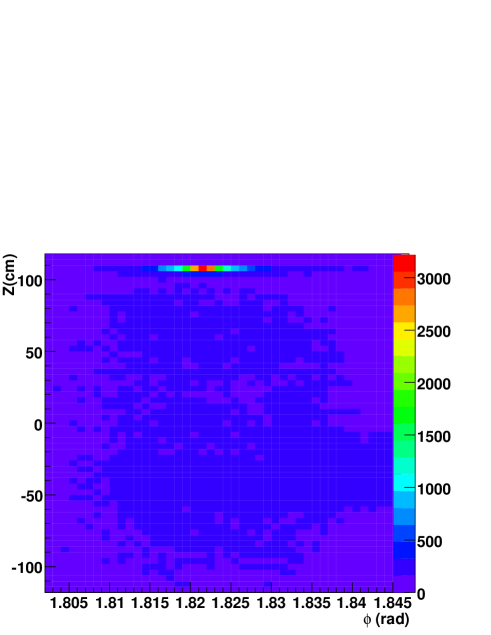
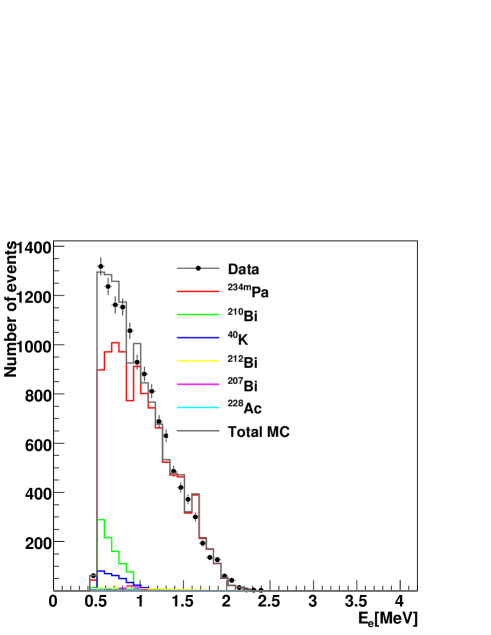
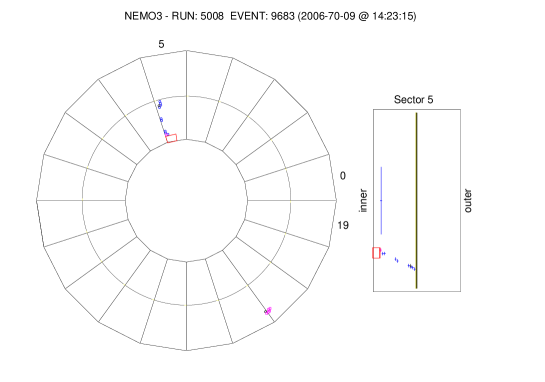
a)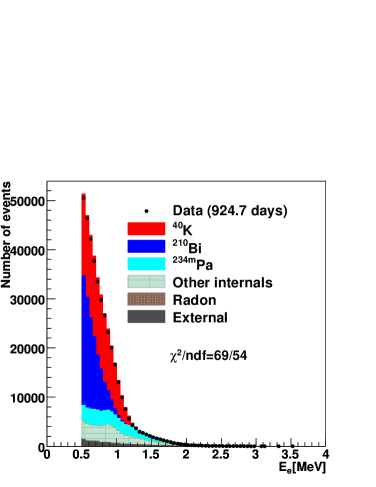
b)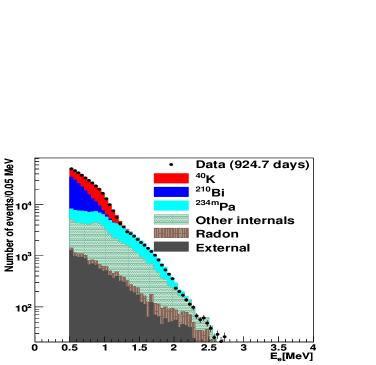
210Bi from the radon decay chain can settle on the tracker wires and undergo a decay which can mimic events originating from the foil. The average activity of 210Bi on the surface of the wires is mBq [58] (more information about this background is given in Section 6.2.1). Other internal backgrounds are normalised by the activities found in Section 6.1.1. The activities of 40K and 234mPa are found by fitting the data simultaneously with the MC contributions of these two contaminants.
Figure 6.22 shows the energy distribution of the single-electron events that pass the event selections. This figure demonstrates that the background MC describes data well in this channel. The activities given from Equation 6.15 to Equation 6.18 are used to normalise internal backgrounds to the channel. As before, the radon activity is normalised to average value of mBq (the external background components and their activities are given in Section 6.2).
| Contaminant | , | Efficiency | ||
|---|---|---|---|---|
| 40K | ||||
| 234mPa |
Table 6.2 shows the number of data events (), number of background events remaining in the data found by MC simulations (), number of events originating from 40K and 234mPa found from the fit ( and ) and the event selection efficiency. From this table, the activities of 40K and 234mPa are found to be:
| (6.23) | |||
| (6.24) | |||
| (6.25) | |||
| (6.26) |
The systematic uncertainties on 40K and 234mPa activities are found by varying the energy selections between MeV and MeV and refitting 234Pa and 40K MC distributions to data minus other backgrounds after each energy selection. The systematic uncertainties are found to be for 40K and for 234mPa.
6.2 The external background
The external background in the NEMO 3 experiment is caused by electrons and photons generated outside the source foil. These particles can interact with the foil and mimic two electron tracks. An external photon’s interaction with the foil can produce an electron-positron pair, which can be misidentified as two electrons. A photon can also undergo Compton scattering and produce an electron and another photon. The second electron can be produced by either Mller scattering of the electron or Compton scattering of the second photon. Figure 6.23 shows these three main ways that an external photon can mimic two -electron events originating from the foil.
The second source of external background are crossing electrons which are produced by Compton scattering of the external photons within the detector components. These electrons can be scattered by the foil and thus detected by two different scintillators. As described in Section 5.6, these events can be reduced by the TOF requirements.
The external background is divided into two main categories based on the origin of the events: the radon background inside the tracker and the background originating from outside the tracker (i.e. the calorimetry, the shielding and the air surrounding the detector).
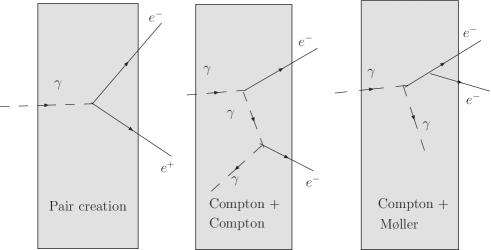
6.2.1 The radon background
Radon (222Rn) is out-gassed into the air from the surrounding rocks and can enter the detector either through leaks between the sectors, or through gas piping joins. Bismuth-214 (214Bi) is one of the descendants of 222Rn which can settle on the surface of the tracker’s wires. The 214Bi undergoes a decay to 214Po. The latter has a half-life of 161 s and decays to 212Pb via emission of an particle. Thus the activity of 214Bi on the wires was measured by studying electron-alpha () events [58].
Another source of background which is part of the radon decay chain originating from the surface of the wires is 210Bi. This isotope is a emitter with value of 1.1 MeV. Therefore few 210Bi events can mimic decay. However, since it contributes to the internal single-electron decay channel, it is important to estimate its activity. The activity of 210Bi was measured by studying single-electron events originating from the surface of the wires [58]. Table 6.3 gives the activity of the 214Bi and 210Bi originating from the first layer of the drift cells situated in sector 5.
| Contaminant | Activity (mBq) | |||
|---|---|---|---|---|
| inner foil side | outer foil side | |||
| Phase 1 | Phase 2 | Phase 1 | Phase 2 | |
| 214Bi | ||||
| 210Bi | ||||
The other main source of external background is the natural radioactivity of the detector components. The PMTs represent an important source of background. The HPGe measurements [50] show that the glass of the PMTs are contaminated with 214Bi, 40K, 208Tl and 228Ac. A study of the external and crossing electron events [58] reveals that the iron shield and iron in the sector walls are also contaminated with these isotopes. It is also important to include 60Co and 234mPa to the external background model [58] in order to reproduce the crossing electron data. The magnetic shield of the PMTs and the wall of the sectors are contaminated with these isotopes. In addition, before the installation of the anti-radon facility, a fraction of external 214Bi and 208Tl background originated from the air surrounding the detector. Table 6.4 summarises the external background sources and the values measured in [58].
| External background | Activity (Bq) | |||||
| 214Bi | 228Ac | 208Tl | 40K | 60Co | ||
| Glass of the PMTs | 324 | 72 | 27 | 1078 | – | |
| Plastic scintillators | – | – | – | 21.5 | – | |
| Magnetic shield of the PMTs | – | – | – | – | 14.6 | |
| Sector iron walls | 9.1 | 8.5 | 3.1 | 100 | 6.1 | |
| Internal tower | – | – | – | – | 18.4 | |
| Iron shield | 7359 | 1345 | 484 | – | – | |
| Air between the detector | P1: | 566.5 | – | 11.5 | – | – |
| and the iron shield | P2: | 0 | – | 0 | – | – |
6.3 Validation of the external background model
The results presented in Section 6.2 have been obtained by studying foil crossing events throughout the detector. In order to validate the external background model for the 150Nd foil, only particles interacting with this foil are selected. Two decay channels are used to check the external background model: the crossing electron channel and the external channel. In both channels the simulated external backgrounds are normalised to the activities given in Table 6.4. The distribution of the sum of external background is then compared with data.
The one crossing electron events create two tracks in the tracking chamber and two scintillator hits in the calorimeter. The external TOF hypothesis for these events must be more than and the internal TOF hypothesis must be less than . Figures 6.24 shows the energy of the crossing electron after scattering by the foil and detection by the second scintillator, the sum of the energies deposited in the two scintillators and the cosine of the angle between the two electron tracks. Phase 1 and Phase 2 data are shown separately. The total number of background events estimated by MC simulations is (stat) for Phase 1 and (stat) for Phase 2. The number of data events are and . The difference between the number of expected background events and data events gives uncertainty on external background in this channel.
a)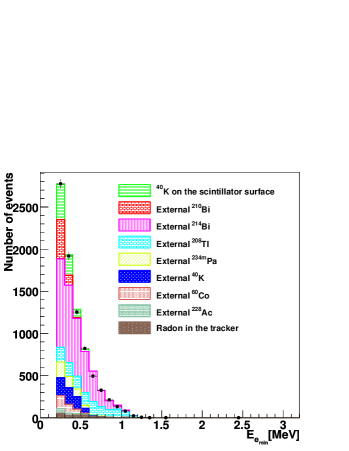
b)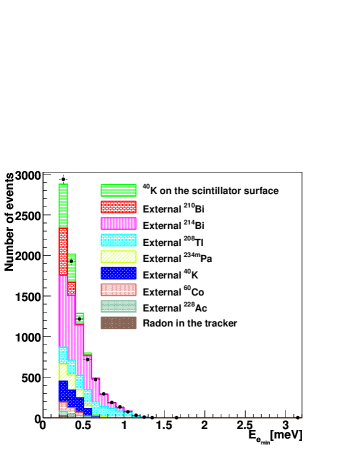
c)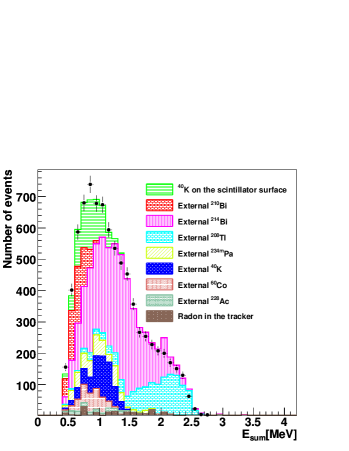
d)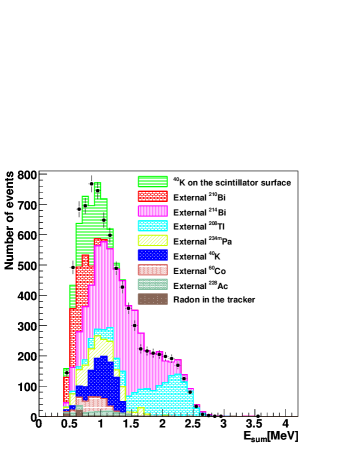
e)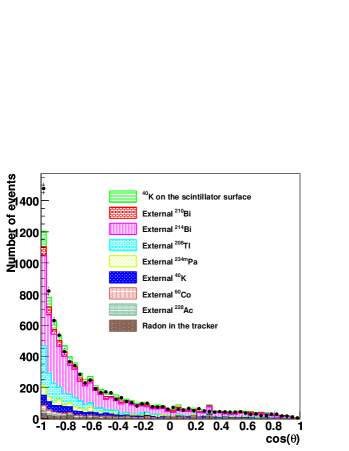
f)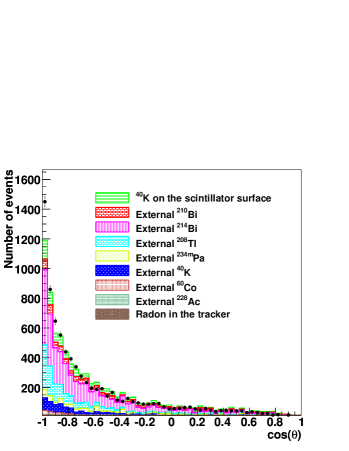
a)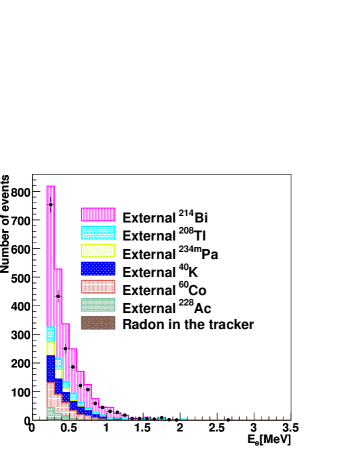
b)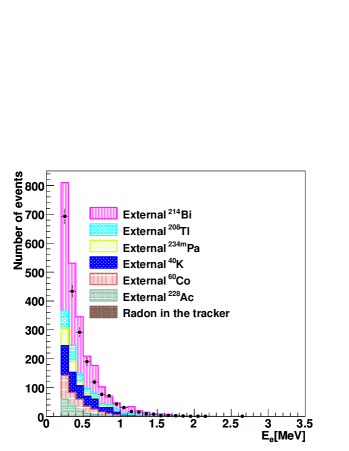
c)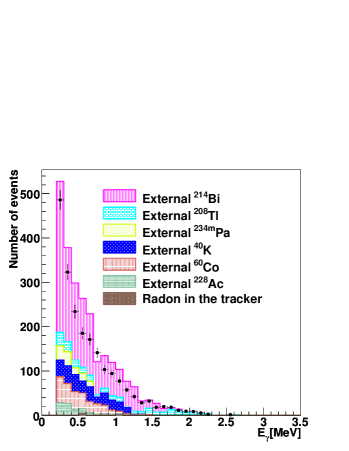
d)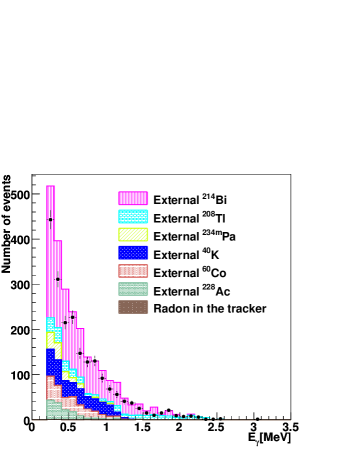
e)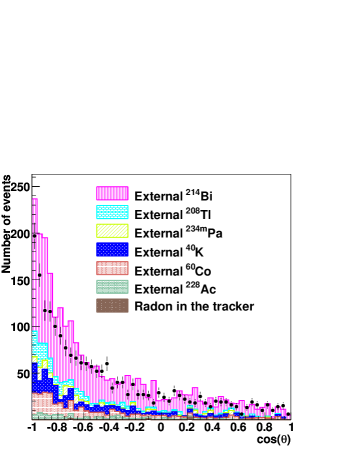
f)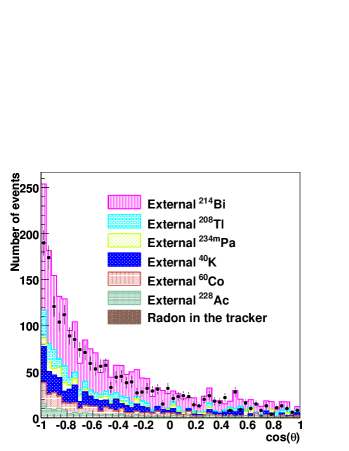
To select external events, the same selections are applied as described in Section 6.1.1 except that the external TOF hypothesis for an event has to be greater than and the internal TOF hypothesis has to be less than . Figure 6.25 shows the electron energy, photon energy and cosine of the angle between the electron and the photon for Phase 1 and Phase 2 data. The number of external events predicted by simulation are (stat) and (stat), respectively. The number of data events are and . The difference between the number of expected background events and data events gives uncertainty on the external background in this channel.
6.4 Summary and discussion
The , , and [58] channels were studied in order to measure the internal background activities with NEMO 3 data. Table 6.5 summarises the internal backgrounds, the channels studied and the activities measured.
| Internal background | Channel | Activity/mass (mBq/kg) |
|---|---|---|
| 208Tl | and | |
| 212Bi | from 208Tl activity | |
| 228Ac | from 208Tl activity | |
| 207Bi | ||
| 152Eu | ||
| 154Eu | ||
| 234mPa | ||
| 40K | ||
| 214Bi | [58] |
The activities of 207Bi and 40K measured using NEMO 3 data are inconsistent with the HPGe detector result. The 207Bi activity is found to be times more than HPGe measurement. As is observed in Figure 6.5, the foil has regions with higher contamination of 207Bi than others and it is possible that HPGe measured a sample of 150Nd foil with lower contamination [83]. The activity of 40K is four times higher than the HPGe measurement. The HPGe detector is a photon detector, whereas 40K predominantly decays to an electron. The difference can therefore be due to the HPGe detector’s inability to detect electrons.
In this thesis a uncertainty on the external background model is used from the validation of the external background model with the channel. As the number of events from external background sources that mimic double beta decay is expected to be low, due to the small surface area of 150Nd foil (see Table 7.4), this uncertainty will not contribute significantly to the uncertainty on the measurement of decay half-life.
Chapter 7 Two-neutrino double beta decay of 150Nd
This chapter describes the measurement of the half-life of 150Nd. The analysis is performed on data described in Section 5.4. The signature inside the NEMO 3 detector for of 150Nd is two electrons emanating from this foil. The event selection criteria for two-electron events are given in Section 7.1 followed by the presentation of the half-life result in Section 7.3.
7.1 Half-life definition
The number of expected events, derived from the radioactive decay law and the event selection efficiency, , of the considered channel, can be expressed as
| (7.1) |
where is the number of atoms in a sample. For the 150Nd sample in NEMO 3 with a mass of g, is equal to . The time is the data taking time, and is the half-life of the studied decay mode. Because of the large value of for decay compared to , Equation 7.1 can be rewritten as
| (7.2) |
where is the number of expected events found from data and is the total number of background events remaining in the data after applying the event selection criteria.
7.2 Two-electron event selection
a)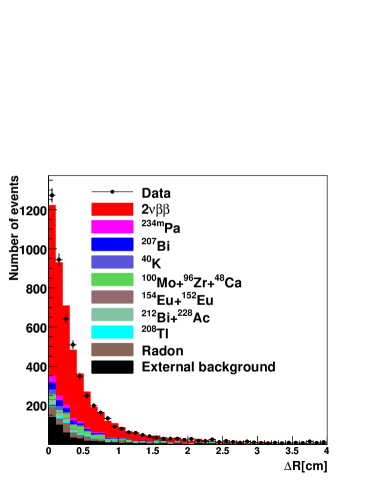
b)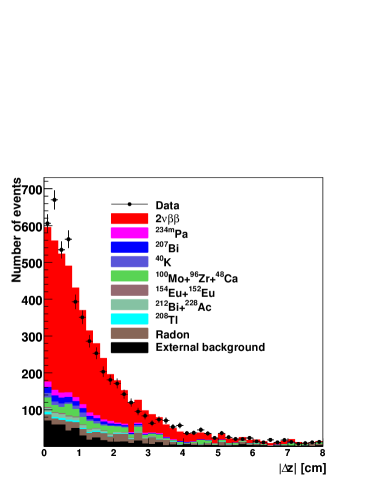
a)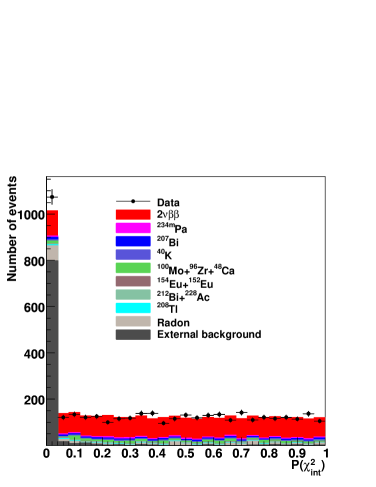
b)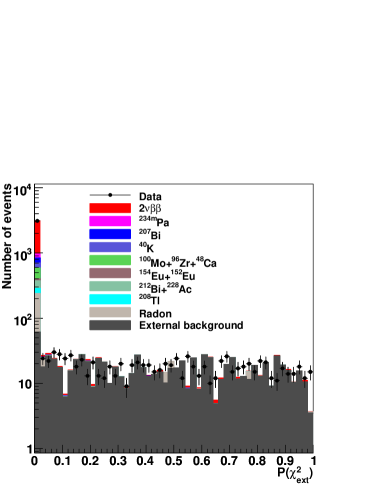
The following selections are applied to the data in order to reduce background to double beta decay:
-
•
Two negatively charged particles are required. The tracks must be associated with two scintillator hits.
-
•
Both tracks are required to originate from the 150Nd foil.
- •
-
•
The energy of each electron is required to be greater than 0.2 MeV.
-
•
Both electrons originate from a common vertex and have:
-
–
cm,
-
–
cm,
where and are the distances between the two tracks’ intersection points with the foil in the horizontal plane, , and in the coordinate. Figures 7.1a and Figures 7.1b show the distribution of these variables before applying the vertex cuts and after applying all other cuts described above.
-
–
-
•
In order to reduce the external background, the internal TOF hypothesis for two-electron events is required to be greater than , and the external TOF hypothesis to be less than . Figure 7.2 shows the distributions of the internal and external TOF hypotheses before applying the TOF hypothesis requirement and after applying all other selections described above. In these figures the number of external background events is normalised to the number of data events for and .
-
•
The track length for each electron is greater than cm. This cut value is lower than the one applied to channels involving one electron track only, as the TOF measurement for two track events is more precise [50]. Figure 7.3 shows the track length distribution for one of the electrons before applying the track length requirement and after applying all other selections. It is observed that signal over background ratio is small for electrons with track length less than 30 cm and that the rate of events with track length 30 cm is not well simulated by the MC.
-
•
The tracks pass through one of the first two layers of the tracker.
Table 7.2 gives the number of data events remaining after each event selection criteria is applied and Table 7.2 gives the fraction of MC events remaining after each cut. This shows the effect of cuts on the signal and the internal and external backgrounds with major contributions in the signal region.
In order to illustrate the effect of each cut on external backgrounds and radon in the tracker, the number of remaining simulated events after each cut is shown for 214Bi in the glass of the PMTs and in the tracker. Figure 7.4 shows the display of a selected two-electron event originating from the 150Nd foil. The electron tracks and scintillator hits are shown.
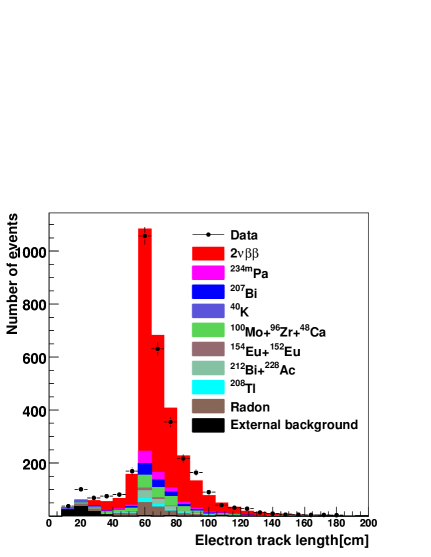
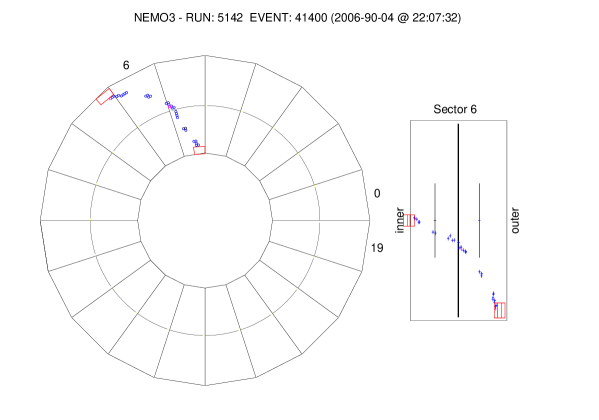
| Cut | Cut | Number of events () |
|---|---|---|
| (1) | two tracks | |
| (2) | tracks associated with scintillators | |
| (3) | particles have negative charge | |
| (4) | tracks originated from 150Nd foil | |
| (5) | Not originated from hot-spot regions | |
| (6) | Energy of each electron MeV | |
| (7) | cm and cm | |
| (8) | and | |
| (9) | Length of each track cm | |
| (10) | Tracks pass through one of the first two layers |
| Cut | 234mPa | 40K | 208Tl | 228Ac | 207Bi | 214Bi tracker | 214Bi PMT | |
|---|---|---|---|---|---|---|---|---|
| (1) | ||||||||
| (2) | ||||||||
| (3) | ||||||||
| (4) | ||||||||
| (5) | ||||||||
| (6) | ||||||||
| (7) | ||||||||
| (8) | ||||||||
| (9) | ||||||||
| (10) |
7.3 Double beta decay half-life
After applying all two-electron event selections, 2789 events remain. The number of Monte Carlo events are normalised to the activities found in Chapter 6 to estimate background remaining in the data sample. Due to the resolution of the tracking detector, events from neighbouring foils (100Mo, 48Ca and 96Zr) can be reconstructed as originating from the 150Nd foil. The 48Ca foil is heavily contaminated with 90Y which itself is a source of background to [84]. The activities of these isotopes are given in Table 7.3. The total number of background events from neighbouring foils is estimated to be from MC simulations, where the systematic uncertainty is determined by the uncertainty on the half-life of these isotopes.
Table 7.3 summarises the internal background originating from 150Nd and neighbouring foils. The number of total internal background events is found to be . The uncertainty on the number of background events is due to the statistical errors and the systematic uncertainties on the activity measurements. The systematic uncertainties on 208Tl, 228Ac and 212Bi activities are fully correlated. The same is true for 214Pb and 214Bi. Table 7.4 summarises the external background that mimic events. The total number of external background events is estimated to be . The uncertainty includes statistical uncertainties and a systematic uncertainty on the external background model. By adding up the number of internal and external background events, the total number of background events is found to be .
| Contaminant | (mBq) | Selection efficiency | |
| 234mPa | |||
| 40K | |||
| 208Tl | |||
| 228Ac | |||
| 212Bi | |||
| 207Bi | |||
| 214Bi | [58] | ||
| 214Pb | [58] | ||
| 152Eu | |||
| 154Eu | |||
| 48Ca | [84] | ||
| 90Y | [84] | ||
| 96Zr | [85] | ||
| 100Mo | [86] | ||
| Sum |
| Background | |
|---|---|
| Total external 214Bi | (stat) |
| Total external 60Co | (stat) |
| 214Bi/214Pb in the tracker | (stat) |
| 210Bi in the tracker | (stat) |
| Sum |
a)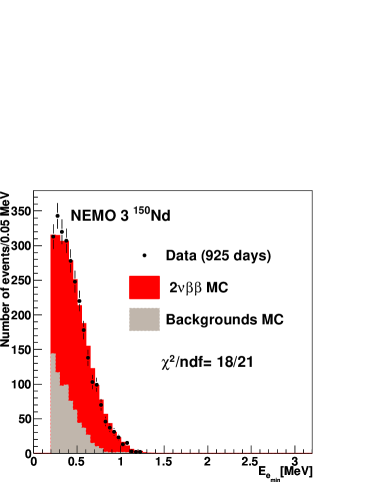
b)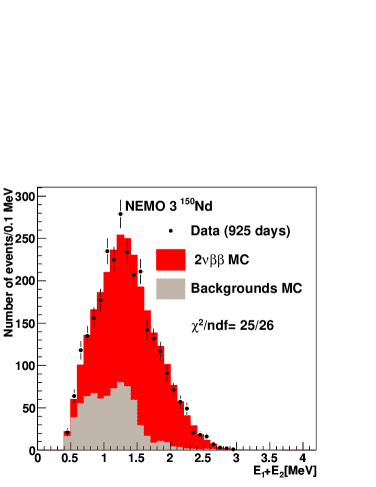
c)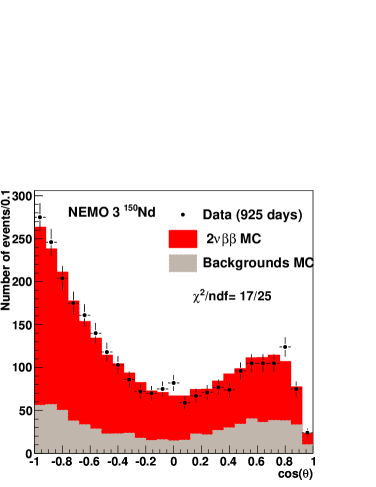
The energy distribution of electrons with the lower energy, the energy sum of the two electrons and the opening angle between them are shown in Figure 7.5. The normalisation of the signal is found by scaling the simulated MC events to the same number of data events minus the radioactive background events. The data are in good agreement with the sum of the background and the signal distribution. The efficiency of the event selection is . After background subtraction the half-life of the decay is measured to be:
| (7.3) |
Systematic uncertainties
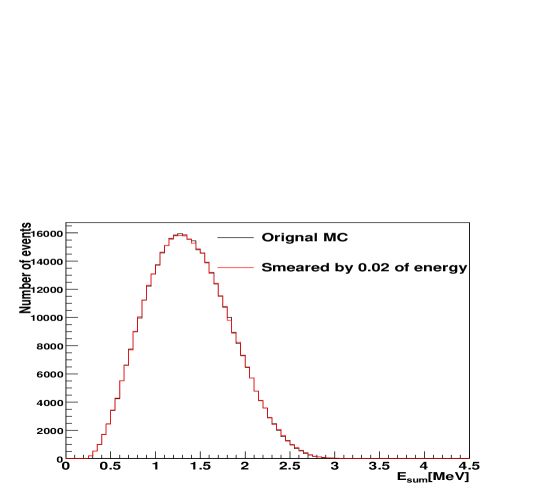
The breakdown of the systematic uncertainties on the half-life is as follows:
-
•
The systematic uncertainty on the background estimate, obtained as the quadratic sum of the uncertainties on the estimates for the internal and external background, is 4%, which translates into an uncertainty on the half-life of .
-
•
An uncertainty of is added due to the uncertainty on the position of the 150Nd foil in the detector. This is estimated by comparing the half-life results before and after changing the position of the 150Nd foil (Section 5.5).
-
•
The TOF cut is changed from to in order to estimate the uncertainty on this cut. This yields uncertainty on the half-life results.
-
•
There is a uncertainty on the efficiency calculation due to the inaccuracy of the GEANT simulation and tracking program. This was found by measuring the activity of the calibration sources [54].
-
•
There is uncertainty in the energy calibration coefficient [54] since the laser energy calibration was not used. The uncertainty on the shape of the energy sum distribution is studied by smearing the individual electron energies for simulated events by . In this case the smeared energy is defined as
(7.4) where is the energy of the electron and is a random number taken from a Gaussian distribution with a mean of zero and width of one. This yields a systematic uncertainty of on the half-life. Figure 7.6 shows the distribution of energy sum of the two electrons for simulated events before and after smearing the electron energies by .
7.4 Comparison with previous results
The decay of 150Nd was first observed in 1993 by a TPC experiment constructed by the Irvine group in California [87]. The discovery was confirmed by the ITEP Moscow experiment later that year [88]. Both of these groups developed their experiments in order to measure the half-life of this process. The TPC experiment in ITEP Moscow used 51.5 g of and presented a half-life of y [89] in 1995. This half-life result had a large statistical uncertainty due to the short running time of the experiment (53 days).
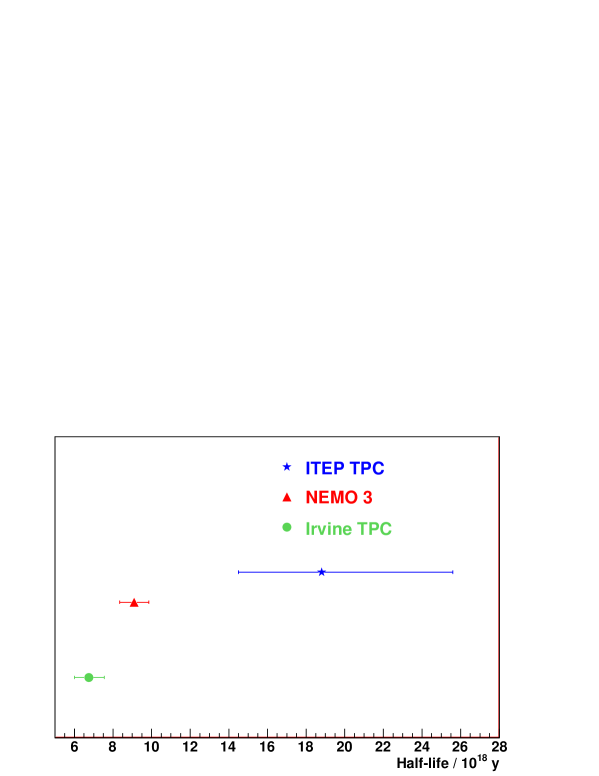
The Irvine group’s TPC experiment was situated in an underground valve house in a canyon wall at the Hoover Dam in the USA [90]. The TPC was a rectangular polycarbonate box with internal dimension of . The double beta decay source was in the centre and served as the central drift-field cathode. Anode and cathode wires were set perpendicular to each other and located near the walls of the TPC. A 1200 G magnetic field was applied perpendicular to the source plane. The helix of the particles provided the measurement of the momentum and thus the energy. A Nd2 source with a mass g enriched to 91% of 150Nd was used. After running the experiment for effective days, double beta decay events were observed. The efficiency of the detector for detecting two-electron events was , resulting in a measured half-life of y [90]. Figure 7.7 compares the half-life result presented in this thesis with the results of the ITEP Moscow and Irvine TPC experiments. This measurement is slightly more than two standard deviations higher than the Irvine group results and two standard deviations lower than the ITEP Moscow result.
Chapter 8 Limits on different modes of neutrinoless double beta decay
This Chapter presents searches for beyond the Standard Model double beta decay processes as described in Sections 2.5.3 to 2.5.4. It starts by introducing the signature for and signals in the NEMO 3 detector and continues with setting limits on the half-life of each individual mode using the method described in Section 5.8. Limits are also set on neutrinoless double beta decay of 150Nd to excited states of 150Sm.
8.1 Signal event selection
The same two-electron event selections as described in Section 7.1 are applied to simulated events from:
-
•
decay to the ground state of 150Sm via the mass mechanism ( ).
-
•
decay to the ground state of 150Sm via right-handed currents ( RC).
-
•
decay with emission of Majoron(s).
-
•
decay to the excited state ( RC). The mass mechanism of this decay is highly suppressed due to the nuclear angular momentum and only the right-handed current is enhanced [91].
-
•
decay to the excited state (). The right-handed current of this decay is highly suppressed due to the nuclear angular momentum and only the mass mechanism is enhanced [92].
The first three decays have the same event topology as . The event topologies of the last two decays are two electrons with emission of a photon ( RC) or two photons (). In this thesis it has not been attempted to reconstruct the additional photon(s).
Table 8.1 present the event selection efficiency for each of these modes.
| Majorons | ||||||||
| () | RC | RC | () | n=1 | n=2 | n=3 | n=7 | |
| efficiency (%) | ||||||||
To set limits on the half-life of these modes, the whole energy sum distributions of the two electrons are investigated and no energy cuts are applied. Figure 8.1 shows the energy sum () distribution of different simulated modes, normalised to arbitrary numbers. In these figures the data and the sum of the backgrounds are also shown.
a)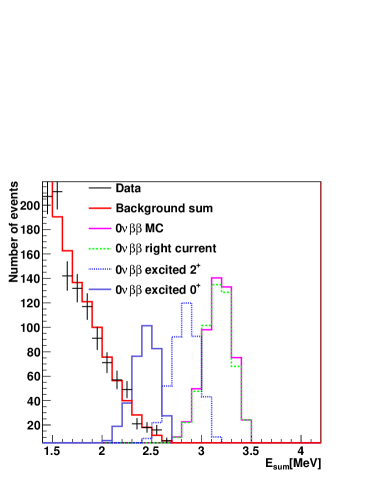
b)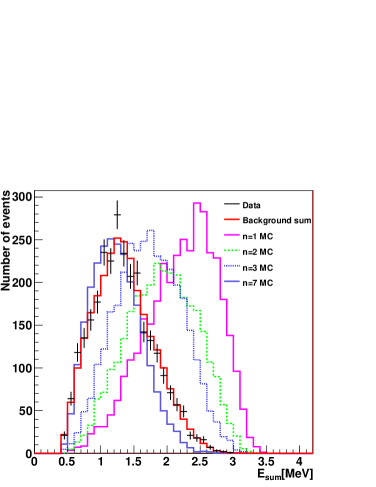
8.2 Systematic considerations
In all the above cases, there are energy regions where the background overlaps with the signal. This is especially true for the Majoron modes three and seven which have the largest overlapping energy regions with the background. The background’s normalisation factor (half-life) in Section 7.3 was found by fitting it to data minus radioactive background, assuming that there was no new physics in data. Thus, in order to have an unbiased signal search, the statistical uncertainty on the normalisation, which is found by fitting background to data minus radioactive background MC, was “floated” (see Section 5.8.3). This makes the background normalisation factor a free parameter.
The uncertainty on the energy measurement affects the shape of the energy sum distribution of the signal and is different in each bin. Figure 8.2 shows the energy sum of the two electrons for different simulated neutrinoless double beta decay modes before and after smearing the energy of each electron by 2% (Section 7.3). To find the shape uncertainty on the energy, the ratio (S-N)/N is plotted, where S is the smeared MC distribution and N is the nominal (unsmeared) MC distribution. These ratios for different modes are shown in Figure 8.3. The histograms show some statistical fluctuations. By fitting the histograms to different functions the statistical fluctuations can be reduced. Multi-Gaussian fits are performed for modes and second order polynomial fits are performed for with emission of Majoron(s). Figure 8.4 shows the resulting histograms after the fit. The inverted histograms (shown in red) are also constructed in order to estimate the negative uncertainty. Figure 8.5 shows the shape uncertainty on the background.
a)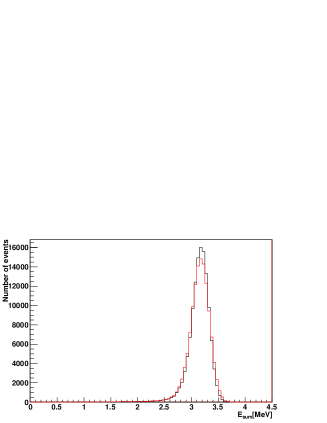
b)
c)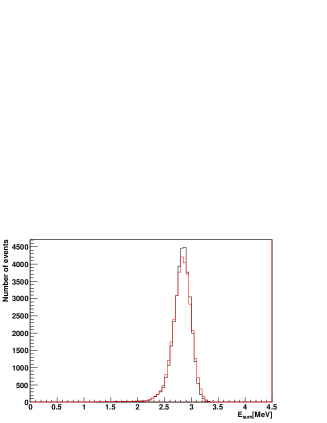
d)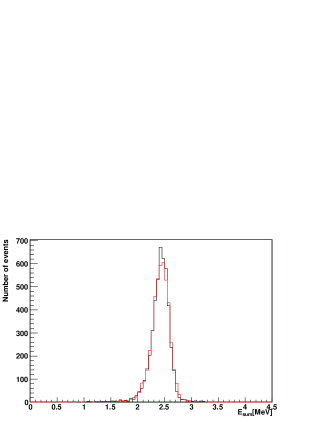
e)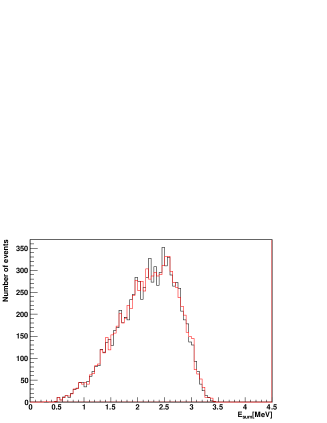
f)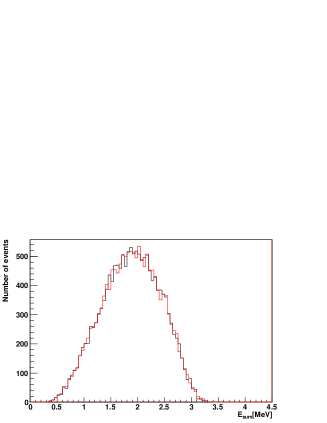
g)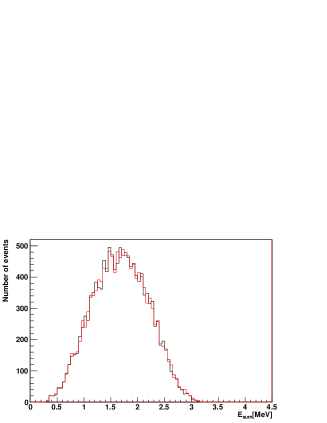
h)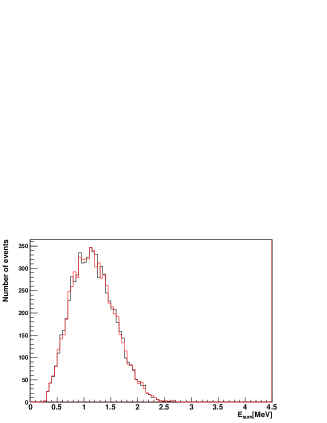
a)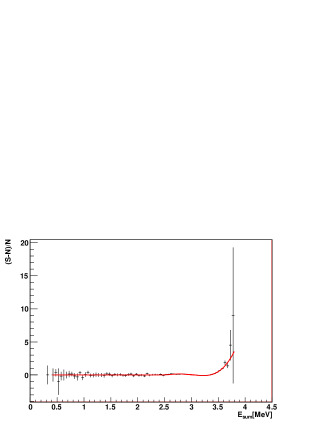
b)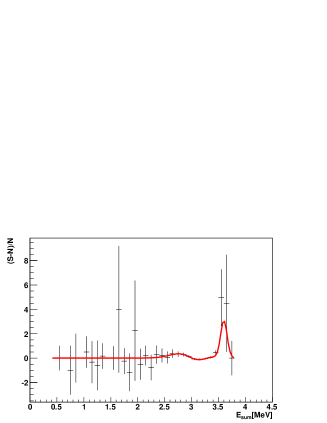
c)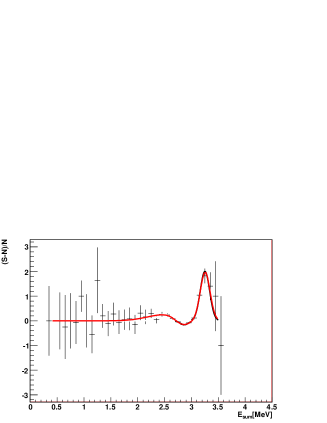
d)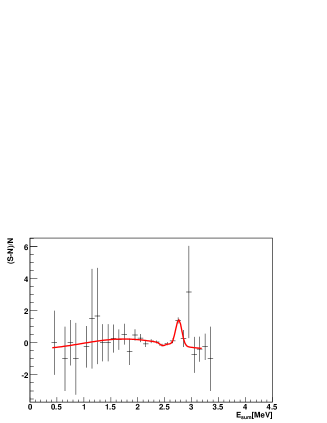
e)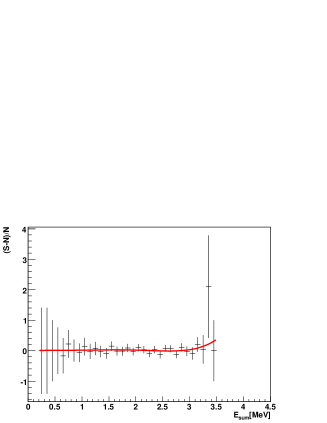
f)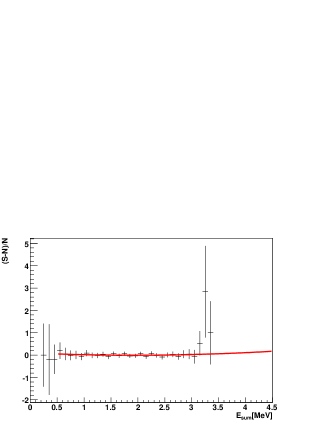
g)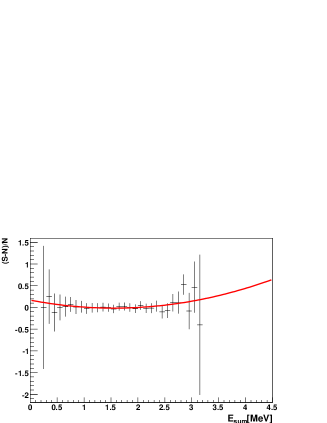
h)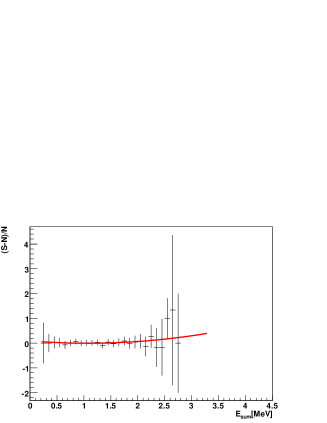
a)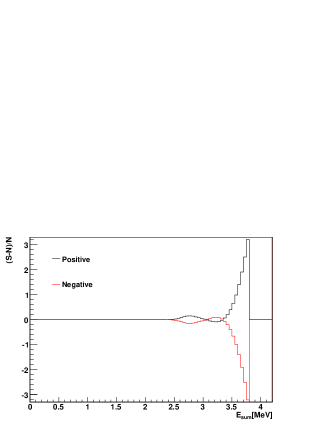
b)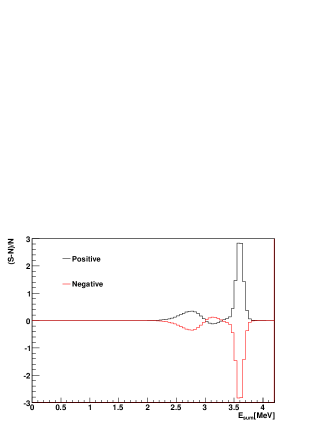
c)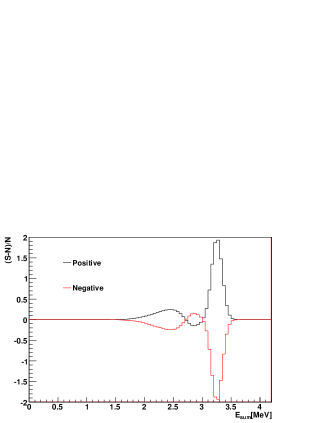
d)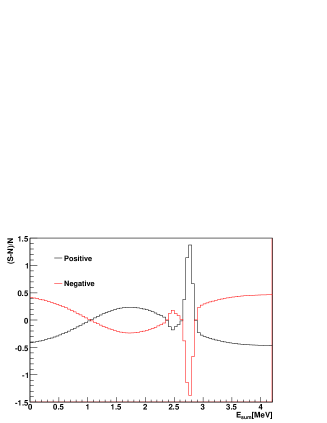
e)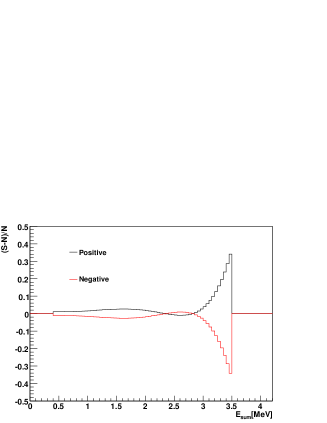
f)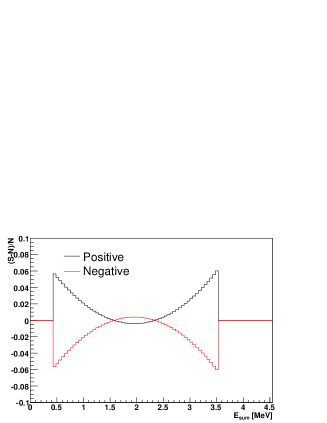
g)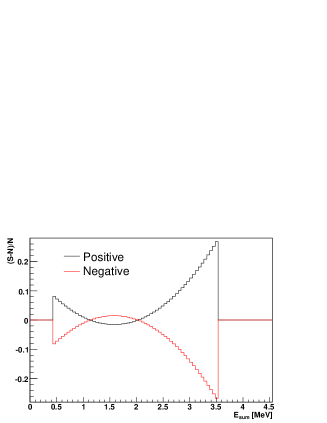
h)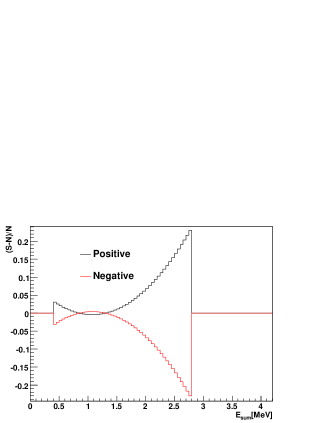
a)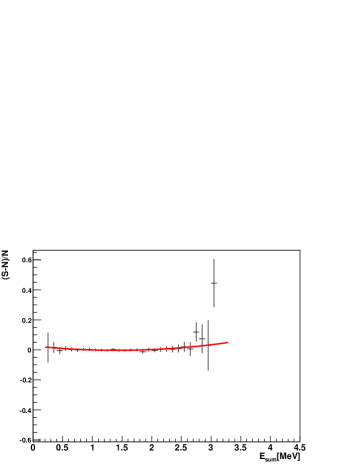
b)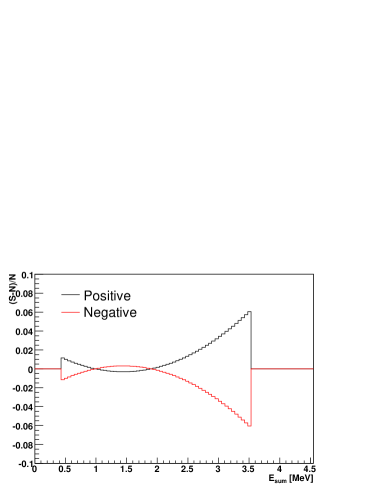
The uncertainties that are considered for setting limits on decays and decays with the emission of Majoron(s) are presented in Table 8.2. The shape systematic uncertainties on signal and background and the efficiency systematic uncertainties on signal and radioactive background are assumed to be fully correlated. The shape systematic was found to contribute to the limit results with less than .
| Uncertainty type | signal | background | other backgrounds |
|---|---|---|---|
| Efficiency | 5% | – | 5% |
| Activities | – | – | 4.0% |
| half-life | – | 2.7% (Float) | – |
| Energy measurement | Shape | Shape | – |
8.3 Limit Results
8.3.1 mass mechanism
In order to search for , the distributions of the signal, and radioactive backgrounds are used as inputs to the limit calculation. The search is performed using the profile likelihood ratio test statistic described in Section 5.8.2 (Equation 5.23). Table 8.3 gives the observed log likelihood ratio (LLRobs), the median expected log likelihood ratio (LLRmed) and the log likelihood ratio for the background with one and two standard deviations (LLRmed and LLRmed). The results in this table show that LLR is in agreement with LLRmed within about one standard deviation and therefore there is no sign of a signal. The value is 0.14 and therefore also consistent with a background only observation. To set limit on the observed and median expected number of events at 90% CL, the MC is re-scaled until ().
| LLRobs | LLRmed | LLRmed | LLRmed | LLRmed | LLRmed |
|---|---|---|---|---|---|
| 4.6 | 5.4 | 4.4 | 2.0 | -0.4 | -3.6 |
The observed upper limit on the number of events from the mass mechanism is found to be at 90% CL. With the detector efficiency of and using Equation 7.2, the lower bound on the half-life is found to be:
| (8.1) |
This is consistent with the median expected limit at 90% CL of
| (8.2) |
This limit on the half-life is converted into a limit on the effective Majorana neutrino mass, , using an NME of [93] and of y-1 [39]. The experimental lower limit on the half-life of 150Nd translates into an effective neutrino mass limit of
| (8.3) |
The uncertainty on the limit is due to the uncertainty in NME calculations. Taking into account the nuclear deformation will modify this conclusion. The suppression of the NME for 150Nd is estimated to be a factor [94]. This increases the upper limit to
| (8.4) |
Figures 8.6 shows the distribution for 2.5 MeV. The radioactive backgrounds, shown in grey, consist of 208Tl events and 214Bi events. Other backgrounds are found to be negligible in this energy region. A distribution with half-life of y, corresponding to events expected for the observed 90% CL, is shown in blue.
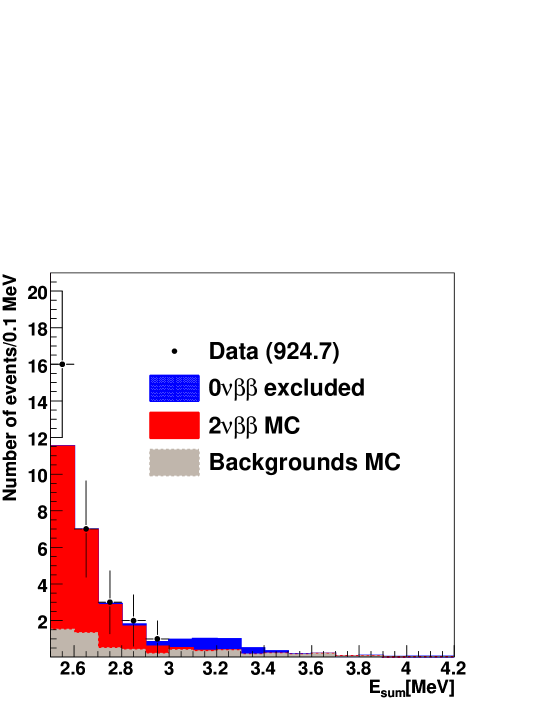
8.3.2 Other modes
Table 8.4 gives the number of events corresponding to the median expected and observed limits and the corresponding lower bounds on the half-life of different neutrinoless double beta decay processes. All limits are set at 90% CL.
| Majorons | ||||||||
|---|---|---|---|---|---|---|---|---|
| () | RC | n=1 | n=2 | n=3 | n=7 | |||
| med. exp. number of events | ||||||||
| observed number of events | ||||||||
| med. exp. y | ||||||||
| observed y | ||||||||
Figures 8.7 and 8.8 show the distribution of different neutrinoless double beta decay. Each signal is normalised to the same number of events as the corresponding exclusion limit. As the background was left unconstrained, a different background normalisation is found for each exclusion signal limit.
a)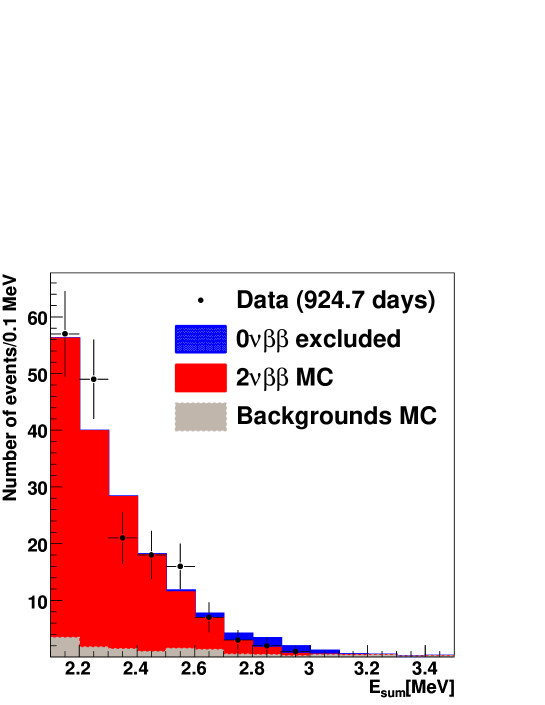
b)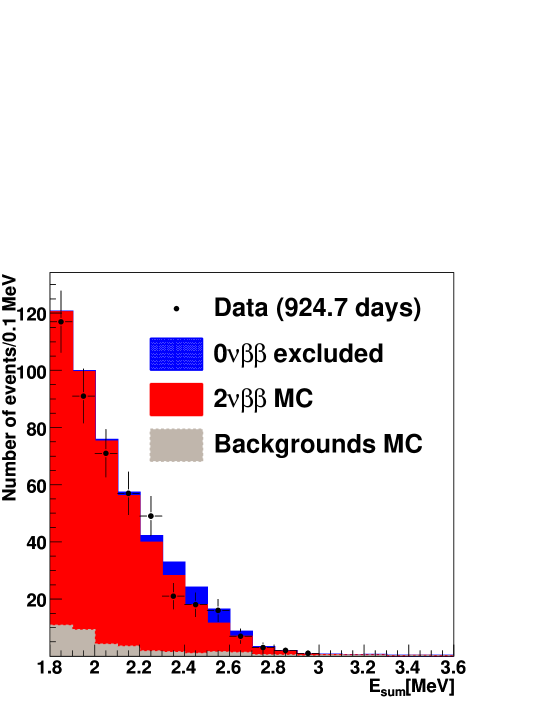
The lower limit on the half-life of the Majoron mode one leads to the upper limit on the Majoron coupling with the neutrino to be:
| (8.5) |
To calculate this limit, the same NME as for the mass mechanism and the phase space factor, [39] is used. Considering 150Nd deformation changes the limit to:
| (8.6) |
The upper limit on the coupling of neutrino with right-handed currents and Majoron mode two and three are not presented in this thesis as the NME calculations of these modes are out of date [95].
a)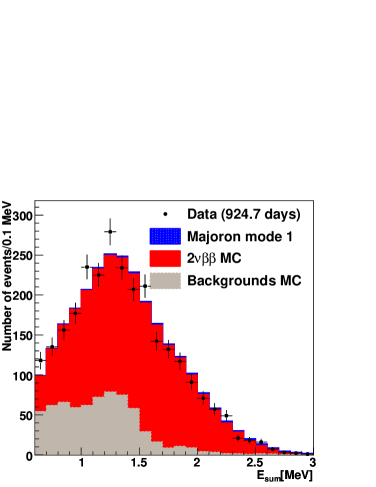
b)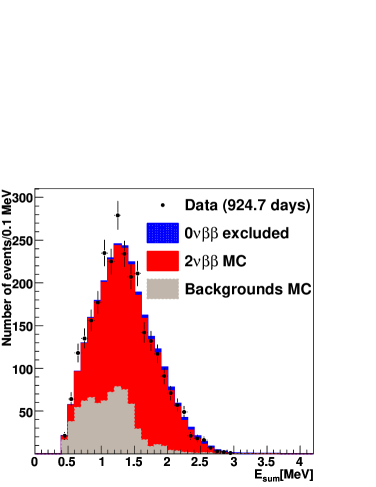
c)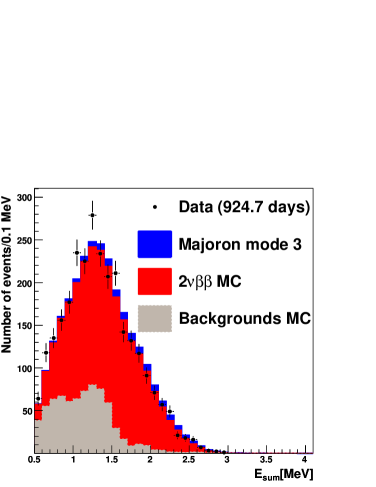
d)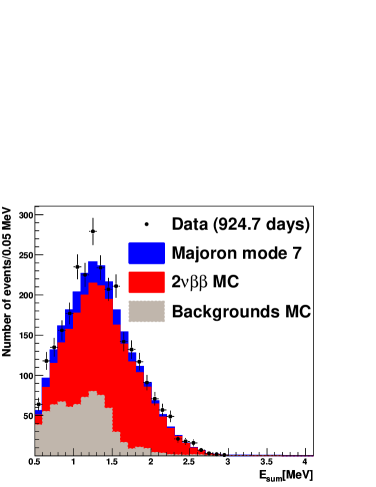
8.4 Summary and discussion
The observed limit on the half-life of neutrinoless double beta decay of 150Nd was found to be
This half-life limit has improved the previous limit on this isotope by a factor of ten.
The best previous limit results were measured by the Institute for Nuclear Research of the USSR in 1986 [96] for g of enriched 150Nd. The experiment had a simple set-up using a central foil surrounded by four scintillation counters providing calorimetry and event reconstruction. This experiment gave a lower bound on the half-life of, . Despite this significant improvement on the half-life limit, the upper bound on effective neutrino mass has a large uncertainty due to the uncertainties on the NME calculations compared to other isotopes. Therefore, further progress in the calculation of the NME for decay of 150Nd is required to improve the limit found from this isotope. The NME of other neutrinoless double beta decay modes are also required to be recalculated with improved calculating tools. This is especially true for right-handed current searches.
The lower limit on the half-life of the Majoron mode one decay of 150Nd was measured to be
which has improved the previous limit significantly () [90]). The corresponding limit on the Majoron-neutrino coupling is
This limit is comparable with limits found with 100Mo () and 82Se () [55]. This result is obtained although only g of 150Nd is used, in comparison with kg of 100Mo and kg 82Se. This is due to the dependence of on .
Chapter 9 Conclusion
In this thesis a precise measurement of the half-life of 150Nd and searches for different modes of neutrinoless double beta decay using NEMO 3 data have been presented. These involve measurements of the activities of backgrounds originating from the internal sources and validation of the external background model. The results given in this thesis have been submitted for publication [97].
The internal background activities are measured by studying , and channels. Hot-spot regions due to 207Bi and 234mPa contamination are observed in the and channels, respectively. These regions are subsequently removed from the analysis. The 207Bi and 40K activities found in this thesis have invalidated the HPGe results for these isotopes. The 234mPa, 207Bi, 40K, 228Ac isotopes are found to be the major internal background sources to and their activities are measured with uncertainties less than . The 208Tl isotope is the major background to and its activity is measured with an uncertainty of .
The number of two-electron background events originating from the neighbouring double beta decay sources and their contaminants are found to be of the total background events. The external background model used in NEMO 3 was validated by selecting external particles that are interacting with 150Nd foil. A uncertainty on the model is used from the validation with the external channel. The total external background contribution to is found to be of the total background events. After applying the two-electron event selection and subtracting the background events, the half-life of is measured to be:
The dominant systematic uncertainties are due to the uncertainties on the tracking efficiency (), 150Nd foil position () and number of radioactive background events ().
A search is performed for different modes by studying the energy sum distributions of the two electrons in the final state. Limits on signals are set using the profile-likelihood ratio technique and by floating the background. This limit setting technique has been used for the first time in the NEMO experiment. The lower limits on the neutrinoless double beta decay half-lives of 150Nd for the mass mechanism () and the Majoron mode one decay () are,
Both results significantly improve the previous limits on neutrinoless double beta decay half-lives of this isotope and lead to the upper limits on the effective neutrino mass and Majoron-neutrino coupling of
The NME calculation of must be improved in order to reduce the uncertainty on these limits. Limits are also set for the first time on half-lives of right-handed currents, excited state decays and several other models leading to emissions of Majoron(s).
References
- [1] Y. Shitov. SuperNEMO: A next generation project to search for neutrinoless double beta decay. arXiv:nucl-ex/0807.3078, 2008.
- [2] M. Chen. The SNO liquid scintillator project. Nucl. Phys. B, (Proc. Supp.), S154:65, 2005.
- [3] W. Pauli. Letter reproduced in translation, Physics Today, 1978.
- [4] P. Higgs. Spontaneous symmetry breakdown without massless bosons. Phys. Rev., 145:1156, 1996.
- [5] C. Amsler et al. Review of particle physics. Phys. Lett., B667:1, 2008.
- [6] Y. Fukuda et al. [Super-Kamiokande Collaboration]. Evidence for oscillation of atmospheric neutrinos. Phys. Rev. Lett., 81:1562, 1998.
- [7] Q. Ahmad et al. [SNO Collaboration]. Direct evidence for neutrino flavor transformation from neutral-current interactions in the Sudbury neutrino observatory. Phys. Rev. Lett., 89:011301, 2002.
- [8] B. Kayser. Neutrino mass, mixing and flavour change. arXiv:hep-ph/0211134v1, 2002.
- [9] R. Mohapatra and G. Senjanović. Neutrino masses and mixings in gauge models with spontaneous parity violation. Phys. Rev., D23:165, 1981.
- [10] Z. Maki, M. Nakagawa and S. Sakata. Remarks on the unified model of elementary particles. Prog. Theor. Phys., 28:870, 1962.
- [11] B. Pontecorvo. Original oscillations. Zh. Eksp. Teor. Fiz., 53:1717, 1967.
- [12] F. Feruglio, A. Strumia and F. Vissani. Neutrino oscillations signals in and experiments. Nucl. Phys., B637:345, 2002.
- [13] S. Abe et al. [KamLand Collaboration]. Precision measurement of neutrino oscillation parameters with KamLand. Phys. Rev. Lett, 100:221803, 2008.
- [14] P. Adamson et al. [MINOS Collaboration]. Measurement of neutrino oscillations with the MINOS detector in the NuMI beam. Phys. Rev. Lett, 101:131802, 2008.
- [15] C. Kraus et al. Final results from Phase II of the Mainz neutrino mass search in tritium decay. Eur. Phys. J., C40:447, 2005.
- [16] V. Lobashev. The search for the neutrino mass by direct method in the tritium -decay and perspectives of study it in the project KATRIN. Nucl. Phys., A719:153, 2003.
- [17] S. Hannestad. Neutrino mass bounds from cosmology. arXiv:hep-ph/0412181, 2004.
- [18] M. Goeppert-Mayer. Double beta-disintegration. Phys. Rev., 48:512, 1935.
- [19] K. Zuber. Neutrino Physics. Institute of Physics, 2004.
- [20] W. Furry. On transition probabilities in double beta-disintegration. Phys. Rev., 56:1184, 1939.
- [21] M. Doi, T. Kotani, and E. Takasugi. Double beta decay and Majorana neutrino. Prog. Theor. Phys. Supp., 83:1, 1985.
- [22] J. Schechter and J. Valle. Neutrinoless double beta decay in SU(2)SU(1) theories. Phys. Rev., D25:774, 1982.
- [23] R. Mohapatra and P. Pal. Massive neutrinos in Physics and Astrophysics. World Scientific, 2003.
- [24] C. Caso et al. Particle data group. Eur. Phys. J., C3, 1998.
- [25] M. Hirsch et al. On the observability of Majoron emitting double beta decays. arXiv:hep-ph/9511227, 1995.
- [26] C. Burgess and J. Cline. New class of Majoron-emitting double beta decays. Phys. Rev., D49:5925, 1994.
- [27] P. Bamert, C. Burges and R. Mohapatra. Multi-Majoron modes for neutrinoless double beta decay. Nucl. Phys., B449:25, 1995.
- [28] C. Carone. Double beta decay with vector Majorons. Phys. Lett., B308:85, 1993.
- [29] R. Mohapatra, A. Pérez-Lorenzana and C. A de S. Pires. Neutrino mass, bulk Majoron and neutrinoless double beta decay. Phys. Lett., B491:143, 2000.
- [30] W. Haxton and G. Stephenson. Double beta decay. Prog. Part. and Nucl. Phys., 12:409, 1984.
- [31] A. Huffman. Nuclear matrix elements in the double beta decay 130Te Xe. Phys. Rev., C2:742, 1970.
- [32] P. Vogel and M. Zirnbauer. Suppression of the two-neutrino double-beta decay by nuclear-structure effects. Phys. Rev. Lett., 57:3148, 1986.
- [33] J. Hirsch et al. Gamow-Teller strength functions and two-neutrino double beta decay. Nucl. Phys., A516:304, 1990.
- [34] P. Sarriguren. Gamow-Teller strength distributions in 76Ge and 76Se from deformed quasi-particle random-phase approximation. Phys. Rev., C67(4):044313, 2003.
- [35] V. A. Rodin et al. Assessment of uncertainties in QRPA -decay nuclear matrix elements. Nucl. Phys., A766:107, 2006.
- [36] F. Avignone, S. Elliot and J. Engel. Double beta decay, Majorana neutrinos, and neutrino mass. arXiv:nucl-ex/0708.1033v2, 2007.
- [37] A. Barabash et al. Double beta decay of 150Nd to the first excited state of 150Sm. JETP, 79:10, 2004.
- [38] K. Chaturvedi et al. Nuclear deformation and neutrinoless double beta decay of 94,96Zr, 98,100Mo, 104Ru, 110Pd, 128,130Te and 150Nd nuclei in mass mechanism. arXiv: nucl-th/0805.4073, 2008.
- [39] F. Šimkovic et al. Additional nucleon current contributions to neutrinoless double beta decay. Phys. Rev., C60:055502, 1999.
- [40] H. V. Klapdor-Kleingrothaus et al. First evidence for neutrinoless double beta decay and world status of double beta decay experiments. Nucl. Phys. B. (Proc. Supp.), S143:229, 2005.
- [41] H. Harney. Reply to the comment on ”Evidence for neutrinoless double beta decay”. Mod. Phys. Lett, A16:2409, 2001.
- [42] C. Aalseth et al. The IGEX experiment revisited: a response to the critique of Klapdor-Kleingrothaus, Dietz and Krivosheina. Phys. Rev., D70, 2004.
- [43] S. Schönert et al. Status of the Germanium Detector Array (GERDA) for the search of neutrinoless betabeta decays. Phys. Atom. Nucl., 69:2101, 2006.
- [44] C. Arnanoldi et al. A new limit on the neutrinoless double beta decay of 130Te. Phys. Rev. Lett., 95:142501, 2005.
- [45] C. Arnaboldi et al. The front-end readout for CUORICINO, and array of macro-bolometers and MIBETA. Nucl. Instr. Meth, A520:578, 2004.
- [46] K. Zuber. Double beta decay searches using CdTe. Phys. Lett, B519:1, 2001.
- [47] K. Zuber (on behalf of the SNO+ Collaboration). Nd double beta decay search with SNO+. Workshop on calculation of double beta decay matrix elements, 2007.
- [48] C. Aalseth et al. An advanced enriched xenon double beta decay observatory. Nucl. Phys. B, (Proc. Supp.), S138:224, 2005.
- [49] B. Flatt et al. A linear RFQ ion trap for the enriched xenon observatory. Nucl. Instr. Meth., A578:399, 2007.
- [50] R. Arnold et al. [NEMO Collaboration]. Technical design and performance of the NEMO 3 detector. Nucl. Instr. Meth., A536, 2005.
- [51] M. Nomachi et al. MOON (Mo Observatory of Neutrinos) for double beta decay. Nucl. Phys., B138:221, 2005.
- [52] N. Ishihara et al. The DCBA experiment for neutrinoless double beta decay. J. Phys.: Conf. Ser., 136:042050, 2008.
- [53] R. Arnold et al. [NEMO Collaboration]. First results of the search of neutrinoless double beta decay with the NEMO 3 detector. Phys. Rev. Lett., 95:182302, 2005.
- [54] R. Arnold et al. [NEMO Collaboration]. Measurement of double beta decay of Mo-100 to excited states in the NEMO 3 experiment. Nucl. Phys., A781:209, 2007.
- [55] R. Arnold et al.[NEMO Collaboration]. Limits on different Majoron decay modes of Mo-100 and Se-82 for neutrinoless double beta decays in the NEMO-3 experiment. Nucl. Phys., A765:483, 2006.
- [56] G. Knoll. Radiation detection and measurement. New York, USA: John Wiley, 754 p, 1989.
- [57] F. Sauli. Fundamental understanding of aging processes: review of the workshop results. Nucl. Instr. Meth., A515:358, 2003.
- [58] V. Kovelenko and V. Tretyak. Measurement of the background in the NEMO 3 experiment. NEMO 3 internal note, 2008.
- [59] D. Alburger and A. Sunyar. Decay of Bi-207. Phys. Rev., 99:695, 1959.
- [60] V. Kovalenko. Laser time corrections (LTCs) for NEMO 3 data. NEMO 3 internal note, 2006.
- [61] V. Kovalenko, private communications.
- [62] I. Kisel et al. [NEMO Collaboration]. Cellular automaton and elastic net for event reconstruction in the NEMO 2 experiment. Nucl. Instr. and Meth, A387, 1997.
- [63] A. Etienvre. Méthode d’analyse pour la recherche de la double désinteégration beta sans émission de neutrinos dans l’expérience NEMO 3. Etude du bruit de fond et premiers résultats. PhD thesis, LAL, Orsay, 2003.
- [64] R. Arnold and V. Tretyak. The NEMO 3 simulation program: Current status. NEMO internal note IRes-1, 2007.
- [65] M. Goossens. GEANT: Detector description and simulation tool, long writeup W5013; March 1994. CERN program library, 1993.
- [66] C. Marquet, private communications.
- [67] R. Arnold et al. [NEMO Collaboration]. Performance of a prototype tracking detector for double beta decay measurements. Nucl. Instr. Meth., A354, (1995) 338.
- [68] C. Augier, private communications.
- [69] R. Barlow and C. Beeston. Fitting using finite Monte Carlo samples. Comp. Phys. Comm., 77(219-228), 1993.
- [70] F. James and M. Roos. MINUIT-Function minimisation and error analysis. CERN program library, 1988.
- [71] http://root.cern.ch/root/html/TFractionFitter.html.
- [72] T. Junk. Confidence level computation for combining searches with small statistics. Nucl. Instr. Meth., A434:435, 1999.
- [73] A. Read. Presentation of search result: the CLs technique. J. Phys., G28, 2002.
- [74] A. Read. Modified frequentist analysis of search results (The Method). In 1st Workshop on Confidence Limits, 2000.
- [75] W. Fisher. Systematics and limit calculations. FERMILAB-TM-2386-E, 2006.
- [76] M. Owen. Search for Higgs bosons decaying into tau pairs in collisions at DØ. PhD thesis, Physics and Astronomy, University of Manchester, 2008.
- [77] W. Fisher. COLLIE: A confidence level limit evaluator. D0 internal note:005818, 2008.
- [78] T. Junk. Sensitivity, exclusion, and discovery with small signal, large backgrounds, and large systematic uncertainties. CDF/DOC/STATISTICS/PUBLIC/8128.
- [79] R. Slattery et al. Long-Lived radioactivity of Eu-152 and Eu-154. Phys. Rev., 96:465, 1954.
- [80] T. Eugene et al. Low-energy capture gamma rays of Eu-152 and Eu-154. Phys. Rev., 115:1287, 1959.
- [81] D. Alburger et al. Positron spectra of Eu-152 and Eu-152m. Phys. Rev., 112(6):1998–2003, 1958.
- [82] E. Browne. Nuclear data sheets for A=212. Nucl. Data Sheets, 104:427, 2005.
- [83] C. Augier and V. Tretyak, private communications.
- [84] S. King. Measurement of the double beta decay half-Life of 100Mo to the excited state, and 48Ca to the ground state in the NEMO 3 Experiment. PhD thesis, UCL, 2009.
- [85] M. Kauer. Double beta decay study of 96Zr. NEMO 3 internal note, 2009.
- [86] R. Arnold et al. [NEMO Collaboration]. First results of the search for neutrinoless double-beta decay with the NEMO 3 detector. Phys. Rev. Lett., 95(18):182302, 2005.
- [87] S. Elliott et al. Observed double beta decay spectra from 82Se, 100Mo and 150Nd. Nucl. Phys. (Proc. Supp.), 31:68, 1993.
- [88] V. Artemiev et al. Observation of decay of 150Nd in an experiment with the Time Projection Chamber. Pis’ma Zh. Eksp. Teor. Fiz., 58:256, 1993.
- [89] V. Artemiev et al. Half-life measurement of 150Nd decay in Time Projection Chamber experiment. Phys. Lett., B345:564, 1995.
- [90] A. De Silva et al. Double beta decays of 100Mo and 150Nd. Phys. Rev., C56:2451, 1997.
- [91] A. Bobyk and W. Kaminski. Two-neutrino double beta decay transition to a excited state. Nucl. Part. Phys., 21:229, 1995.
- [92] F. Šimkovic. Neutrinoless double beta decay to excited states mediated by light Majorana neutrinos. Czech. J. Phys., 52:607, 2002.
- [93] V. Rodin et al. Erratum to Assessment of uncertainties in QRPA -decay nuclear matrix elements. Nucl, Phys. A, 793:213, 2007.
- [94] J. Hirsch et al. Neutrinoless double beta decay in heavy deformed nuclei. Nucl. Phys., A582:124, 1995.
- [95] F. Šimkovic, private communications.
- [96] A. Klimenkov et al. Low background scintillation installation for double beta decay experiments. Nucl. Instr. Meth., B17:445, 1986.
- [97] J. Argyriades et al. [NEMO Collaboration]. Measurement of the double beta decay half-life of Nd-150 and search for neutrinoless decay modes with the NEMO-3 detector. arXiv:hep-ex/0810.0248 (submitted to Phys. Rev. Lett), 2008.