THE RELATION IN LOW SURFACE BRIGHTNESS
GALAXIES: INCLUDING THE LIGHT CONCENTRATION
A.Caon, A.Pizzella, AND F.Bertola
Department of Astronomy, University of Padova, Vicolo
dell’Osservatorio 3, I-35122, Padova, Italy
Poster presented at the international meeting “Galaxy Properties across Cosmic Ages” held in Rome, Accademia dei Lincei, April 28-29, 2009.
Abstract
It has been found that there is a strong correlation
between the circular velocity and the central stellar velocity
dispersion of galaxies. In this respect, low surface
brightness galaxies (LSB) follow a different relation when compared to
Elliptical and high surface brightness (HSB) galaxies. The intrinsic
scatter of the is partially due to the different
concentration of the light distribution. In this work we measure the
concentration parameter for a sample of 17 LSB finding that
the parameter does not account for the different behavior in
the for this class of objects.
Introduction
It has been recently found that the circular velocity measured
in the flat region of the rotation curve and the stellar central
velocity dispersion are related
(Ferrarese, 2002). It has successively found that Low
Surface Brightness (LSB) galaxies follow a different relation compared with HSB (High Surface Brightness) and E
(Elliptical) galaxies (Pizzella et al., 2005). It has been suggested
(Courteau et al., 2007) that the light concentration of the luminous
component, measured by the parameter, may account for this
difference. Aim of this work is to measure the for a sample
of LSB galaxies and see if their behaviour in the plane is different with respect to HSB
galaxies.
Data reduction
We selected a sample of 17 LSBs whose circular velocity and
central velocity dispersion of the stellar component are
known (Pizzella et al., 2008, Cardullo Laurea Thesis
2006). For all the sample galaxies we have broad band
imaging. For each galaxy we derived the radial surface brightness
profile. We first derived, by means of the IRAF task ellipse,
the photometric center, position angle and ellipticity of the
isophotes. For each pixel of the image we computed its deprojected
distance to the center of the galaxy (that is the distance of the
pixel to the center on the plane of the disk). We derived the mean
surface brightness profile and the uncertainties. In
this process we automatically masked out the pixel affected by stars.
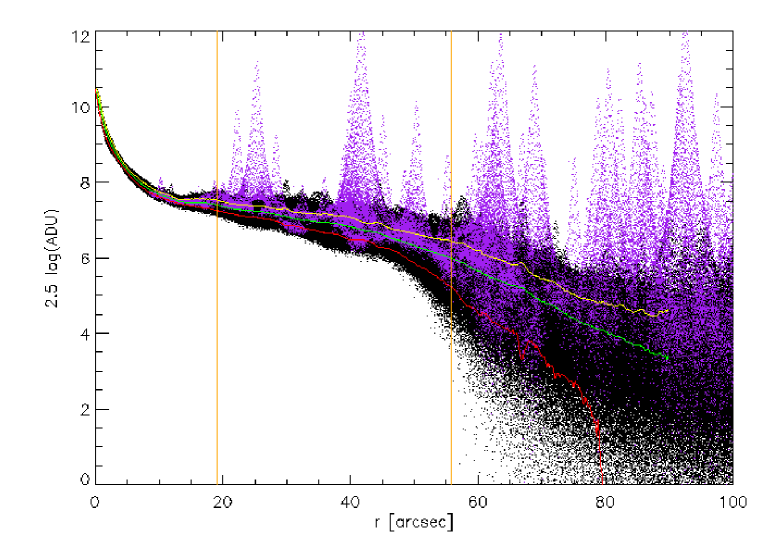
In Fig. 1 you can see the radial surface
brightness profile for ESO 514-10. We then extrapolated with a
straight line the outer surface brightness profile, computed the total
luminosity and, finally, the radii enclosing the 80% and 20% of the
total galaxy light. A Monte Carlo simulation that allows some
variation in the center, position angle and ellipticity of the
isophotes has been used in order to derive the uncertainties in the
parameter.
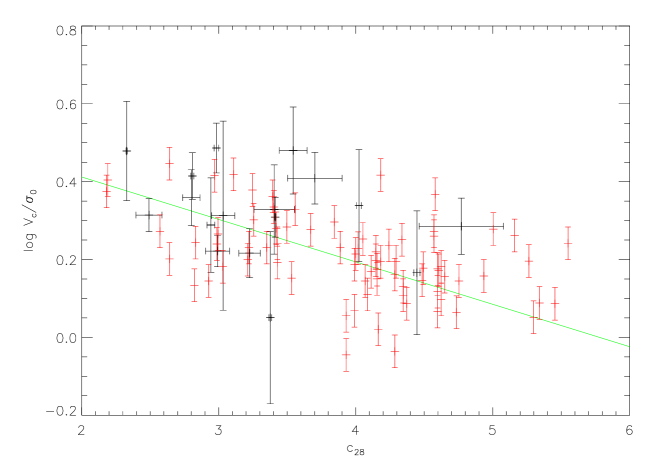
We compared our data points with the data points and the empirical fit
| (1) |
found by Courteau et al. (2007) (Fig. 2). The two
distributions seem to follow a similar relation, although the limited
number of points does not allow us to derive an independent linear regression for LSB alone.
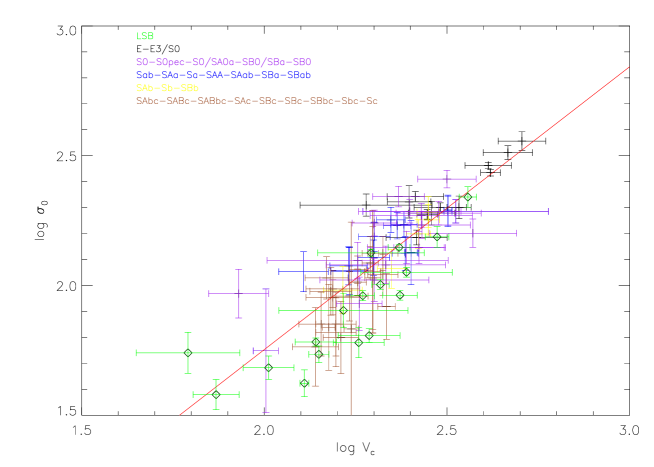
Pizzella et al. (2005) found that in the plane LSB galaxies mostly lies below the relation defined
by the HSB and E galaxies. This is shown in Fig. 3
where different morphological types of galaxies are shown. To better
compare HSB and LSB galaxies, we perform a linear regression of HSB
data points. We used the linear regression described by
Akritas & Bershady (1996). The result of the linear fit is
also shown in Fig. 3.
Results
Now that we have measured the parameter for LSB galaxies we
used the empirical relation found by Courteau et al. (2007) and shown in
Fig. 2 to derive their from
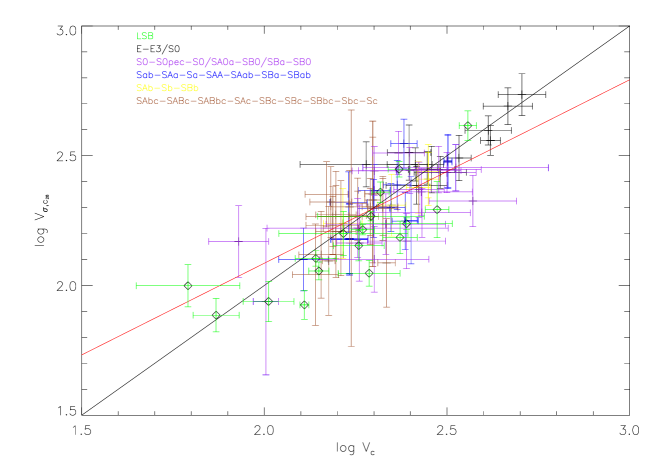
and . In Fig. 4 we plot our new LSB
points together with the points derived by Courteau et al. (2007) for
HSB galaxies. Applying a linear regression we found
| (2) |
LSB galaxies still seems follow a different relation, having, for a given a smaller value of .
Let us remind that our aim is to test whether LSB and HSB share the
same relation. The best way of doing
it is to analyze the distribution of the scatter of the HSB and LSB
measurements with respect to the linear regression defined by the HSB
sample. For each data point we computed the scatter as done by
Pizzella et al. (2005), that is computing the difference between the
observed value and the linear regression and normalizing it by means
of its observational uncertainties. The scatter distribution of HSB
and LSB is then compared by means of a KS test. We performed this
analysis both on the and relations in order to undestand how the two
relations compare. The plot of the residuals is shown in
Fig.5.
The result of the KS test is that LSB and HSB have two distinct
distributions both considering the relation
(and this is basically the result obtained by Pizzella et al. (2005)
with a similar data set) and considering the relation.


Conclusions
The KS test indicates that the distribution of HSB and LSB are
different at a % and % confidence level in the and plane respectively. Our
conclusion is therefore that, concerning LSB galaxies, the parameter
does not account for the different behaviour in the
relation. Since is related to the SMBH mass and is
related to the dark matter halo mass, this result may indicate that
either LSB galaxies follow a different
relation with respect to HSB galaxies, or alternatively, that LSB
galaxies have SMBH of smaller mass compared with HSB galaxies.
References
- Akritas & Bershady (1996) Akritas, M. G. & Bershady, M. A. 1996, ApJ, 470, 706
- Courteau et al. (2007) Courteau, S., McDonald, M., Widrow, L. M., & Holtzman, J. 2007, ApJ, 655, L21
- Ferrarese (2002) Ferrarese, L. 2002, ApJ, 578, 90
- Pizzella et al. (2005) Pizzella, A., Corsini, E. M., Dalla Bontà, E., et al. 2005, ApJ, 631, 785
- Pizzella et al. (2008) Pizzella, A., Corsini, E. M., Sarzi, M., et al. 2008, MNRAS, 387, 1099