Rotation and Outflow motions in the very low-mass Class 0 protostellar system HH 211 at subarcsecond resolution
Abstract
HH 211 is a nearby young protostellar system with a highly collimated jet. We have mapped it in 352 GHz continuum, SiO (), and HCO+ () emission at up to resolution with the Submillimeter Array (SMA). The continuum source is now resolved into two sources, SMM1 and SMM2, with a separation of 84 AU. SMM1 is seen at the center of the jet, probably tracing a (inner) dusty disk around the protostar driving the jet. SMM2 is seen to the southwest of SMM1 and may trace an envelope-disk around a small binary companion. A flattened envelope-disk is seen in HCO+ around SMM1 with a radius of 80 AU perpendicular to the jet axis. Its velocity structure is consistent with a rotation motion and can be fitted with a Keplerian law that yields a mass of 5015 (a mass of a brown dwarf) for the protostar. Thus, the protostar could be the lowest mass source known to have a collimated jet and a rotating flattened envelope-disk. A small-scale ( 200 AU) low-speed ( 2 km s-1) outflow is seen in HCO+ around the jet axis extending from the envelope-disk. It seems to rotate in the same direction as the envelope-disk and may carry away part of the angular momentum from the envelope-disk. The jet is seen in SiO close to 100 AU from SMM1. It is seen with a “C-shaped” bending. It has a transverse width of 40 AU and a velocity of 17060 km s-1. A possible velocity gradient is seen consistently across its innermost pair of knots, with 0.5 km s-1 at 10 AU, consistent with the sense of rotation of the envelope-disk. If this gradient is an upper limit of the true rotational gradient of the jet, then the jet carries away a very small amount of angular momentum of 5 AU km s-1 and thus must be launched from the very inner edge of the disk near the corotation radius.
1 Introduction
Stars are formed inside molecular cloud cores by means of gravitational collapse. The details of the process, however, are complicated by the presence of magnetic fields and angular momentum. In particular, excess angular momentum will have to be removed in order for stars to form. Part of it may be carried away by the jets that are believed to be launched from accretion disks around protostars. Measurements of angular momentum have been reported for the jets in various evolutionary phases from Class 0 (Lee et al., 2008) to Class I (Chrysostomou et al., 2008), and to T-Tauri phase (Coffey et al., 2007). Most of these measurements, however, are based on shock emission (e.g., SiO, H2, and [OI]) and could be uncertain. Without resolving the shock structures and kinematics, the measurements can be significantly affected by internal (bow) shock interactions (Codella et al., 2007; Lee et al., 2008). In addition to the jets, low-speed molecular outflows have also been seen along the jet axis. Some of them seem to be rotating and may also carry away part of the angular momentum (Lee et al., 2007a; Launhardt et al., 2008).
This paper is a follow-up to our previous study of the HH 211 protostellar system (Hirano et al. 2006; Palau et al. 2006; Lee et al 2007b, hereafter Paper I) at unprecedented resolution up to . This system is located in the IC 348 complex of Perseus, with an average distance of 280 pc (Enoch et al., 2006; Lada et al., 2006). The central source is a young, low-mass, and low-luminosity ( , corrected for the new distance) Class 0 protostar with 31 K (Froebrich et al., 2003). It is seen with a highly collimated knotty jet in H2 (McCaughrean et al., 1994), CO (Gueth & Guilloteau, 1999), and SiO (Hirano et al., 2006; Palau et al., 2006; Paper I, ), driving a collimated outflow (McCaughrean et al., 1994; Gueth & Guilloteau, 1999). It is also seen with a rotating envelope in ammonia (Wiseman, 2001). Lying close to the plane of the sky ( 10∘, Paper I, ), this jet is one of the best candidates to search for jet rotation. Previously, a velocity gradient was seen in SiO across the jet axis toward the brightest knots of the jet at low spatial and velocity resolutions and thought to be from jet rotation (Paper I, ). However, since the sense of rotation of the ammonia envelope is now found to be opposite to that stated in Paper I (J. Wiseman 2009, private communication; H. Arce 2009, private communication), the velocity gradient found in Paper I is unlikely to be from jet rotation. Here, we search for a velocity gradient that is consistent with the sense of rotation of the ammonia envelope, with better resolved shock structures and kinematics at 4 times better angular and 3 times better velocity resolutions. We also search in 850 m continuum and HCO+ for a compact accretion disk argued to have formed around the protostar (Paper I, ). We also study in HCO+ a low-speed outflow that may carry away part of the excess angular momentum from the envelope-disk.
2 Observations
Observations toward the HH 211 protostellar system were carried out with the SMA on 2008 Jan 23 in the extended configuration and on 2008 August 18 in the very extended configuration. SiO (), CO (), SO (), and HCO+ () lines were observed simultaneously with 850 m continuum using the 345 GHz band receivers. In this paper, we only present the results in continuum, HCO+, and SiO. The results in CO and SO will be presented in a future publication. The receivers have two sidebands, lower and upper, covering the frequency range from 345.5 to 347.5 and from 355.5 to 357.5 GHz, respectively. Combining the line-free portions of the two sidebands results in a total continuum bandwidth of 3.7 GHz centered at 352 GHz (or 850 m) for the continuum. The baselines have projected lengths ranging from 35 to 500 m. The primary beam has a size of and one pointing was used to map the central region of this system. The correlator was setup to have a velocity resolution of 0.175 km s-1 for the SiO and HCO+ lines.
The visibility data were calibrated with the MIR package, with quasar 3C454.3 as a passband calibrator, and quasars 3C84 and J0336+323 as gain calibrators. The dwarf planet Ceres and the star-forming region MWC 349 were used as flux calibrators in the extended and very extended configurations, respectively. The flux uncertainty is estimated to be 15%. The calibrated visibility data were imaged with the MIRIAD package. The dirty maps that were produced from the calibrated visibility data were CLEANed using the Steer clean method, producing the CLEAN component maps. The final maps were obtained by restoring the CLEAN component maps with a synthesized (Gaussian) beam fitted to the main lobe of the dirty beam. With natural weighting, the synthesized beam has a size of at a position angle (P.A.) of 70∘. The rms noise level is 0.09 Jy beam-1 in the HCO+ channel maps with a velocity resolution of 0.175 km s-1, 0.08 mJy beam-1 in SiO channel maps with a velocity resolution of 0.35 km s-1, and 1.4 mJy beam-1 in the continuum map. Super-uniform weightings are also used to achieve higher angular resolutions of up to . The absolute position accuracy is estimated to be .
3 Results
In the following, the systemic velocity in the HH 211 system is assumed to be km s-1 LSR, as derived from the optically thin line of H13CO+ (Gueth & Guilloteau, 1999).
3.1 352 GHz Continuum Emission
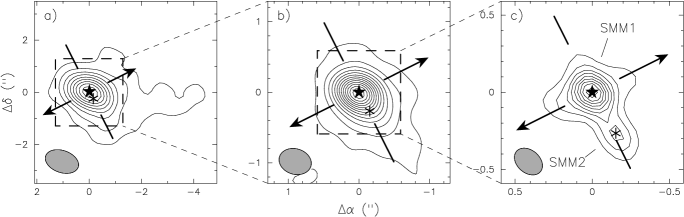
Previously, continuum emission was mapped around the source at 342 GHz at resolution, showing a dense flattened envelope in the equatorial plane perpendicular to the jet axis and some (swept-up) envelope material around the western outflow lobe (Fig. 1a and Paper I, ). The flattened envelope is asymmetric, extending more to the southwest than to the northeast. Continuum emission is detected here at 352 GHz at the higher resolution of (Fig. 1b), tracing mainly the inner part of the flattened envelope, as the extended envelope emission is resolved out. It has a total (integrated) flux density of 0.22 Jy, a half of that seen in Figure 1a, which is 0.44 Jy (Paper I, ). Note that the inner part of the flattened envelope that extends to the southwest is shifted slightly to the west from the equatorial plane.
A compact continuum source, SMM1, is seen at the center of the jet with a peak position , , as we zoom into the center at the highest available resolution of (Fig. 1c). It is seen with faint emission extending (84 AU) to the northeast and southwest along the equatorial plane that traces the innermost part of the flattened envelope or disk. It is also seen with faint emission extending with a similar distance to the northwest and southeast along the jet axis that may trace the jet beam itself near the launching point. Its peak position is well coincident with that found at 43.3 GHz (or mm) at a similar resolution (Avila et al., 2001) and is thus considered as the position of the embedded protostar driving the HH 211 jet. It is spatially unresolved and thus has a deconvolved size smaller than a half of the beam size, or (28 AU) along the equatorial plane, as found at 43.3 GHz (Avila et al., 2001). It has a flux density of 80 mJy (integrated over a radius of ) and thus may have a true brightness temperature 80 K. The spectral index with can be estimated with this flux and the flux at 43.3 GHz that was measured for the similar region at a similar resolution. With the flux of 2.70.6 mJy at 43.3 GHz (Avila et al., 2001), the spectral index is found to be 1.6, smaller than that for an optically thick thermal emission, for which . It could be because significant fraction of the flux at 43.3 GHz is from free-free emission of an ionized gas or jet as in HH 111 (Rodríguez et al., 2008). If that is the case, SMM1 could trace a warm optically thick (accretion) disk around the embedded protostar, as suggested in Paper I . It seems to have a dust temperature 80 K, as implied from the true brightness temperature. Assuming that SMM1 has a dust temperature of 80 K and its emission is optically thin, it has a (gas and dust) mass of only 1.1 or 13 , where is the dust opacity index ranging from 0 to 1. Here, a mass opacity cm2 g-1 (Beckwith et al., 1990) is assumed for the dust. The mass can be lower, e.g., by 40% if the dust temperature is higher by 50%. In addition, since the emission is likely to be optically thick, the mass here is only a lower limit.
A secondary continuum source, SMM2, is seen with a peak position , in the equatorial plane at (or 84 AU ) to the southwest of SMM1, with S/N 6. It has a flux density of 25 mJy and a deconvolved size of (28 AU), leading to a true brightness temperature and thus a dust temperature 25 K. Assuming that the emission is optically thin with a dust temperature of 25 K, it has a mass of 1.5 or , with ranging from 0 to 1. Again, the mass can be lower, e.g., by 40% if the dust temperature is higher by 50%.
3.2 HCO+ emission
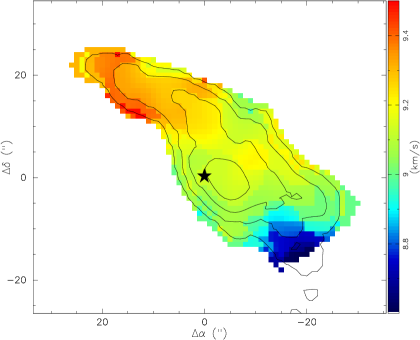
A flattened condensation is seen in HCO+ near SMM1 with a size of , slightly elongated along the equatorial plane (Fig. 2a). It peaks at to the southwest of SMM1 and is shifted slightly to the northwest from the equatorial plane. Its redshifted emission is in the northeast of its blueshifted emission (Fig. 2b), as seen in the large-scale rotating ammonia envelope (Fig. 3, Wiseman et al. in prep)111The sense of rotation of the ammonia envelope (J. Wiseman 2006, private communication) reported in Paper I was incorrect. Upon reexamining the ammonia data, Wiseman (2009, private communication) reported a blueshifted NH3 gas in the southwest of the envelope, and a redshifted NH3 gas in the northeast of the envelope, which is opposite to that reported in Paper I . , and thus it may trace a small-scale rotating envelope-disk around SMM1. The center of rotation seems shifted slightly away from SMM1 to the southwest in the direction of SMM2, judging from the peak positions of the redshifted and blueshifted emission (Fig. 2b). Since the blueshifted emission is brighter than the redshifted emission, the emission peak in the integrated map is shifted further to the southwest (Fig. 2a). Emission is also seen extending ( 200 AU) to the southeast and northwest around the jet axis, perpendicular to the flattened condensation. This extended structure seems to rotate in the same direction as the flattened condensation, with the blueshifted emission in the southwest and the redshifted emission in the northeast (Fig. 2b). The redshifted emission is much weaker than the blueshifted emission and even disappears in the northwest, probably because this region is deeply embedded in a cold envelope that is expected to be collapsing, so that most of the redshifted emission is self-absorbed (Evans, 1999).
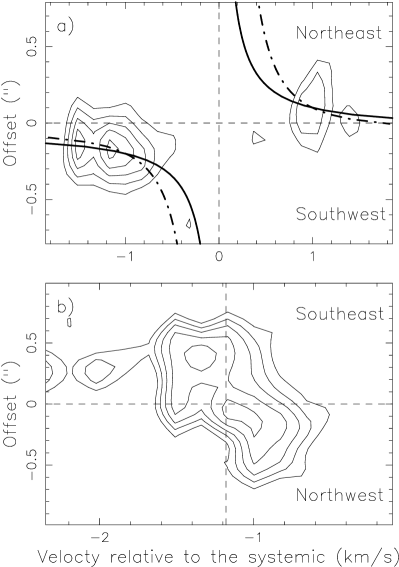
The position-velocity (PV) diagram cut across the flattened condensation along the equatorial plane shows that the redshifted emission indeed is to the northeast and the blueshifted emission is to the southwest of SMM1 with the velocity increasing toward SMM1 (Fig. 4a), as expected for a rotating envelope-disk around SMM1. This envelope-disk is clearly seen in the redshifted emission at 1 km s-1 w.r.t. the systemic (Fig. 2c), where it is not confused with the structure extended along the jet axis. Judging from the peak positions in the PV diagram at the highest velocities at 1.5 km s-1 w.r.t. the systemic, the center of rotation indeed seems shifted slightly to the southwest of SMM1, as suggested in Figure 2b. Assuming that the shift of the center is , the velocity structure can be roughly fitted with a Keplerian rotation with a central mass of (i.e., 50 Jupiter mass). This mass is consistent with that derived from an evolution model by Froebrich et al. (2003), which was found to be 0.06 . Therefore, the condensation may trace a rotationally supported disk. This disk seems to be truncated around SMM2 with a radius of 80 AU (Figs. 2a & 4a). The compact continuum source SMM1 may trace the inner part of this disk. Note that, since the velocity can be fitted as well by a rotation law with , this condensation could also trace the inner part of a non-rotationally supported flattened envelope (see, e.g., Allen, Li, & Shu, 2003). We can not determine which rotation law can better fit our observations.
The structure extended to the southeast and northwest along the jet axis perpendicular to the flattened condensation may have an outflow motion along the jet axis, in addition to the rotation motion around the jet axis. The blueshifted part of this structure is bright and thus can be used to check this possibility, with a PV diagram cut parallel to the jet axis (as indicated in Fig. 2b). This blueshifted part has a base in the flattened condensation at in the southwest of SMM1, which has a rotation velocity of 1.2 km s-1 (see Fig. 2a). Its emission is shifted by this rotation velocity at the base (Fig. 4b), as expected if it is rotating around the jet axis like the flattened condensation, as suggested in Figure 2b. In addition, w.r.t. that at the base, its emission is mainly slightly blueshifted (by 0.2 km s-1) in the southeast and redshifted (by 0.2 km s-1) in the northwest, indicating that it also has an outflow motion along the jet axis, with the approaching side in the southeast and the receding side in the northwest, as seen for the jet (Fig. 5). The projected outflow velocity, with a mean value of 0.2 km s-1, is small compared to the rotation velocity because the outflow is almost in the plane of the sky.
3.3 SiO Jet
3.3.1 Morphology
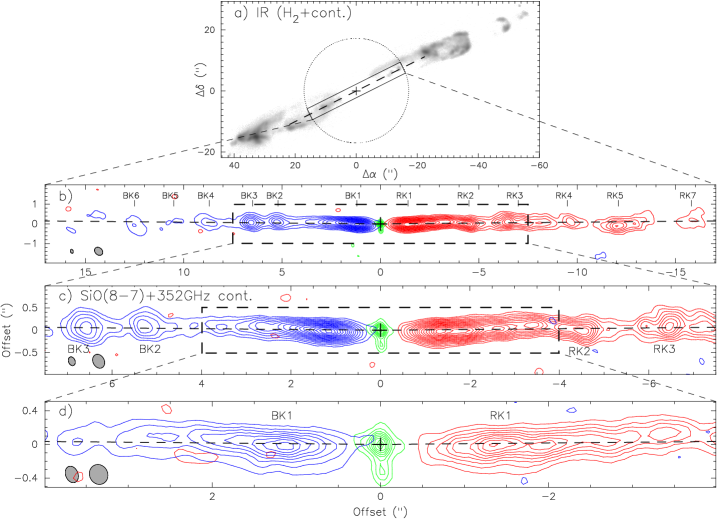
As seen in Paper I , the SiO jet consists of a chain of paired knots on either side of the source and it has a mean jet axis at P.A. of 116.1∘∘ and 297.1∘∘, respectively, for the eastern and western components (Fig. 5). At high resolution, the innermost pair of knots, BK1 and RK1, are now seen as two linear curvy structures on either side of the source, connecting to the continuum emission (Fig. 5d). Knot BK1 extends to (84 AU) to the source with a faint emission overlapping with the continuum emission extended to the east (Fig. 5d). Knot RK1 extends to (140 AU) to the source and points to the continuum emission extended to the west. These two knots are very narrow with a deconvolved size (i.e., transverse width) of ( 40 AU) and seem to consist of 4 smaller sub-knots as indicated by the emission peaks. They are curved in the same direction, first slightly to the south, then to the north, and then to the south (Fig. 5d). This is the so-called “C-shaped bending” and it could be due to an orbital motion of the source in a binary system (Fendt & Zinnecker, 1998). Note that the jet may also be slightly precessing, since the continuum emission extended along the jet axis is not exactly aligned with the jet axis. That the two knots, BK1 and RK1, do not bend exactly at the same distance further supports this possibility. However, the dominant effect must be the “C-shaped bending”, as the jet has an axial symmetry (bending), not a point symmetry (precession).
Knots BK2, BK3, RK3, and likely also RK2, which are located further away from the source, are now seen as head-tail structures (Fig. 5c). The head structures are due to the sideways ejection of the internal shocks and grow bigger further away. The trailing tails may trace the (weakly shocked) material in the jet beam. Knots BK4 to BK6 and RK4 to RK7 trace the internal (bow) shocks further downstream (Fig. 5b).
3.3.2 Proper motion
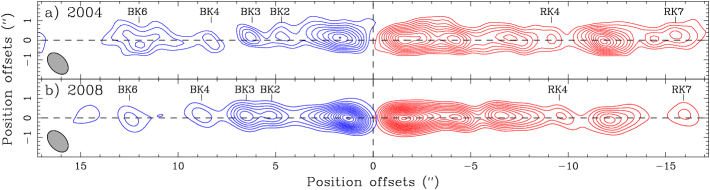
Proper motion of the SiO jet can be estimated by comparing the peak positions of the knots here with those seen at 3.6 yrs earlier in Paper I . We first convolved our maps here to the resolution of those obtained earlier and then aligned the maps with the continuum peaks (Fig. 6). In addition, we only measure for those knots that actually consist of one single (sub-)knot. They are knots BK2, BK3, BK4, BK6, RK4, and RK7. The proper motion is estimated to be per year, resulting in a transverse velocity of 60 km s-1 for the jet.
3.3.3 Kinematics along the jet axis
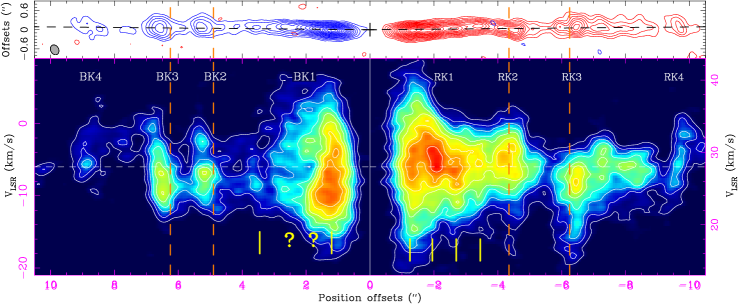
A PV diagram of the SiO emission cut along the jet axis is used to study the kinematics of the jet (Fig. 7). The jet has a mean radial velocity of 6 and 28 km s-1 LSR (or and 18.8 km s-1 w.r.t. the systemic) for the eastern and western components, respectively. These mean radial velocities, combined with the transverse velocity of the jet, result in an inclination of 5∘2∘ and 6∘2∘ to the plane of the sky for the eastern and western components, respectively, and a jet velocity of 17060 km s-1.
In knot RK1, four tiny sub-knots with a separation of (210 AU) are seen with a range of velocities. Although it is not that clear, similar number of sub-knots may form in knot BK1 as well. The velocity range is the broadest at the first sub-knot with a FWZM of 30 km s-1 (Fig. 8), and it decreases with the distance from the source. As mentioned, knots BK2, BK3, RK3, and likely also RK2 all show a head-tail structure in morphology (see Fig. 5c). The mean velocity of their tails is higher than that of their heads (Fig. 7), suggesting that the jet material in the tails will eventually go into the heads. The heads of knots BK2 and BK3 are better resolved longitudinally, and their velocity is seen decreasing with the distance toward the downstream, suggesting that they are formed as the fast jet material catches up with the slow jet material. This is expected if they are the internal shocks produced by a semi-periodical variation in the jet velocity, like the knots in the IRAS 04166+2706 jet (Santiago-Garcia et al., 2008). On the other hand, knot RK4, which is further away, shows a velocity increasing with the distance toward the downstream. This change of velocity gradient at a larger distance is also expected because of thermal expansion of the internal shock along the jet axis (see Fig. 8 in Lee & Sahai, 2004).
3.3.4 Jet rotation
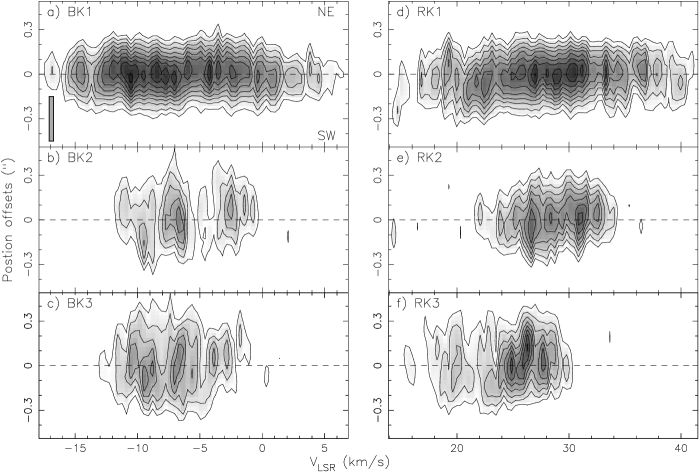
We present in Figure 9 the PV diagrams cut across the jet axis centered at the peaks of knots BK1, BK2, BK3, RK1, RK2, and RK3, in order to follow up our previous study of jet rotation at higher spatial and velocity resolutions. In Paper I , the beam was in size and elongated with a high inclination ( 45∘) to the jet axis. The velocity resolution was binned to 1.0 km s-1 per channel. Here the beam is 3-4 times smaller with a size of and less elongated with a smaller inclination ( 30∘) to the jet axis. The velocity resolution is 3 times better, binned to 0.35 km s-1 per channel.
As expected, the transverse width of the knots increases from BK1 to BK3 and from RK1 to RK3, due to sideways ejection of the internal shocks (Fig. 9). Unlike that seen in Paper I , no clear velocity gradient is seen across these knots. Previously, the knots were not resolved and the apparent gradient could result from a velocity gradient originally along the jet axis, as discussed in Paper I . Similar apparent gradient is also seen in the PV diagrams derived from our channel maps degraded to the low spatial and velocity resolutions of Paper I . The apparent gradient seen in Paper I was uncertain and here we show that it was misleading.
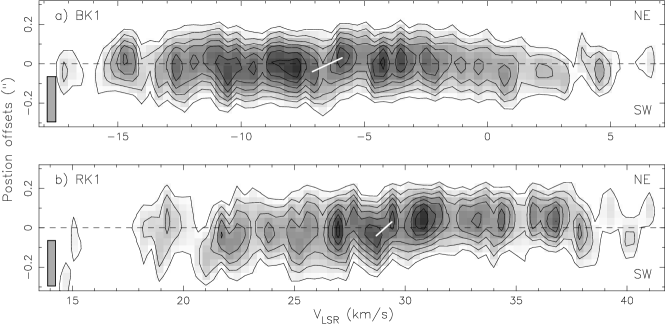
In order to further search for jet rotation, we zoom into the innermost pair of knots, BK1 and RK1, at the highest available resolution of (Fig. 10). Here we focus only on the innermost pair of knots because the knots further downstream are more affected by the sideways ejection and jet precession (see Fig. 9). The PV structures are now better resolved and can be separated into two components, one blueshifted and one redshifted, with respect to -6.5 km/s for knot BK1 and 29.1 km/s for knot RK1 (Fig. 10). These two velocities are close to the mean velocities of the jet and can be considered as the velocity centroids of the two knots. For knot RK1, it is clear that the redshifted component is mainly in the northeast and the blueshifted component is mainly in the southwest, similar to that seen in the HCO+ envelope-disk. For knot BK1, the two components also show these position offsets at low velocity shifts, even though they extend to opposite sides at high-velocity shifts. The velocity structures are complicated and could be due to sideways ejection or jet rotation or both. Since sideways ejection is mainly perpendicular to the jet axis, the velocity shifts due to sideways ejection are expected to be insignificant at the jet edges (i.e., boundaries). Thus, jet rotation is better measured with the velocity shifts at the two jet edges around the velocity centroid, which can be given by the two peaks at (7.1km s-1, ) and (5.9 km s-1, ) for knot BK1, and (28.7 km s-1, ) and (29.4 km s-1, ) for knot RK1 (Fig. 10). The velocity gradients defined by these peaks could be real since the emission at the two velocities that define the gradients are indeed slightly on the opposite sides of the jet axis (Fig. 11). The mean velocity gradient, with a velocity of 0.5 km s-1 at 10 AU (), if arising from jet rotation, would result in a mean angular momentum of 5 AU km s-1. Since a small-scale jet precession could introduce velocity shifts that mimic jet rotation (Cerqueira et al., 2006) and the position shifts between the two peaks that define the gradients are less than one third of the synthesized beam, this mean velocity gradient could only be considered as an upper limit of the true gradient due to jet rotation.
3.4 Temperature and Density
With lower transition lines of SiO, the kinetic temperature of the SiO emission has been estimated to be 300-500 K for the innermost pair of knots (Hirano et al., 2006). As mentioned, these knots are spatially unresolved in the direction perpendicular to the jet axis with a deconvolved size . Since their brightness temperature has a peak of 100 K at resolution (Fig. 8), their true brightness temperature could have a peak close to their kinetic temperature. Therefore, the SiO emission could be optically thick as in the case of HH 212 (Cabrit et al., 2007; Lee et al., 2007a). Assuming that the SiO emission has a kinetic temperature of 500 K and is optically thin, and that the SiO abundance relative to molecular hydrogen is (Nisini et al., 2002; Hirano et al., 2006), the density toward these knots is 10 cm-3. Note that for the optically thick case, the density is expected to be close to the critical density of SiO J=8-7 transition, which is 108 cm-3.
4 Discussion
4.1 SMM1: A protostar with a mass of a brown dwarf?
Since SMM1 is seen with a HCO+ condensation that can be explained with a Keplerian disk, the protostar at the peak of SMM1 may indeed currently have a mass of only 50 , which is a mass of a brown dwarf. The disk accretion rate can be estimated assuming that the bolometric luminosity is mainly from the accretion. With , a stellar mass of 50 , and a stellar radius of (Stahler, 1988; Machida et al., 2008), the accretion rate yr-1. If the accretion rate was the same in the past, this protostar has an accretion age of only yrs. If this protostar continues to accrete mass at this rate from the envelope (Fig. 1a) that has a mass of 50 (Paper I, ), it will start burning hydrogen in yrs.
This protostar, if indeed with such a low mass at such a young age, could be the lowest mass, youngest source known to have a rotating disk, a high-speed collimated jet, and a collimated outflow. Among the youngest low luminosity objects known to date very few are clearly in the Class 0 stage and driving (high-speed) collimated outflows, with possibly IRAM 04191 (André et al., 1999; Lee et al., 2005) and IRAS 04166+2706 (Tafalla et al., 2004; Santiago-Garcia et al., 2008) being the most remarkable cases. However, neither IRAM 04191 nor IRAS 04166+2706 have been reported to have a rotating structure at the disk scale ( 100 AU). Other brown dwarf candidates associated with disks (inferred from the spectral energy distribution) and driving outflows are all in more evolved evolutionary stages (Class I/II/III) (White & Hillenbrand, 2004; Bouy et al., 2008; Phan-Bao et al., 2008). Thus, the HH 211 system, revealing a substellar object (at the moment) with a rotating envelope-disk in the Class 0 phase and driving a spectacular outflow suggests that brown dwarfs and low mass stars form in a similar way, and that whether they will become low-mass stars or brown dwarfs depends on the amount of material that can be accreted still in the envelope.
4.2 SMM2: A binary companion with a planetary mass?
The nature of the continuum source SMM2 is uncertain. It may trace an asymmetry in the inner envelope around SMM1. It may also trace a dusty envelope-disk around another embedded source. That the HCO+ envelope-disk seems to have a center of rotation shifted slightly away from SMM1 to the southwest in the direction of SMM2 and that the HCO+ envelope-disk seems to be truncated around SMM2 both support this possibility. The center of mass in the system, if assumed to be the same as the center of rotation, is in the southwest of SMM1 (see §3.2) and thus in the northeast of SMM2. Thus, the embedded source, if existed, would have a mass of 8 (a mass lower than that of a brown dwarf), with the protostar in SMM1 now having a mass of 42 . Therefore, it would be a small binary companion surrounded by a dusty envelope-disk of 1.54 (see §3.1). Further submillimeter observations are needed to confirm this. The small mass of this companion may explain why there is no clear evidence of an outflow associated with SMM2. This companion would have an orbital period of 3000 yrs and could be responsible for the large-scale precession of the jet (Eislöffel et al., 2003). This binary companion, however, may not be responsible for the C-shaped bending that seems to have a much shorter period. We speculate that the HH 211 system may eventually evolve into a binary system consisting of a very low-mass star and a brown dwarf.
4.3 Outflowing gas from the envelope-disk?
The HCO+ structure extending ( 200 AU) to the southeast and northwest around the SiO jet seems to have an outflow motion along the jet axis, in addition to the rotation motion around the jet axis. It is seen within a wide-opening cavity with the western walls traced by the western extensions in the continuum (Fig. 1a) and is thus different from the large-scale molecular outflow driven by the fast-moving jet and wind (Lee et al., 2000). Assuming that it has the same inclination as the jet, it has a deprojected outflow velocity of 2.1 km s-1, about 1.8 times the rotation velocity at the base of the outflow, which is km s-1 (Fig. 4b). Thus, it can be considered as a low-speed outflow. With a size of 200 AU, the outflow has a dynamical time 450 years.
Similar low-speed outflow has also been seen along the jet axis in other Class 0 sources, e.g., IRAM 04191 (Lee et al., 2005) and HH 212 (Lee et al., 2007a) in HCO+, and even in Class II sources, e.g., RNO 91 (Lee et al., 2002) and CB 26 (Launhardt et al., 2008) in CO. Like the HH 211 outflow, the HH 212 and CB 26 outflows may also be rotating. In the case of CB 26, the outflow may arise from the disk and play a significant role in dispersing the disk material in the late stage of star formation (Launhardt et al., 2008). Here in the case of HH 211 (and probably also HH 212), the outflow may arise from the envelope-disk. It has a mean specific angular momentum of 50 AU km s-1, with 1.2 km s-1 at 45 AU (), and may carry away part of the extra angular momentum, if not all, allowing material to fall toward the center in the early phase of star formation. With an outflow velocity to rotation velocity ratio of 2, the low-speed outflow could be driven by magneto-centrifugal force as that seen in from the rotating structures, such as the outer part of the disk (Pudritz et al., 2007) or the inner part of the pseudodisk (a non-rotationally supported flattened envelope) (e.g., Allen, Li, & Shu, 2003).
4.4 Origin of SiO emission near the source
SiO emission is absent near the source, but suddenly appears at in knots RK1 and BK1 and peaks at at their first sub-knots. As mentioned, these knots likely consist of about 4 sub-knots separated by with a velocity range decreasing with the distance from the source. Near the source, this decrease in velocity range with the distance is expected if the sub-knots trace the internal shocks produced by a semi-periodical variation in the jet velocity [for the detailed velocity structures produced by such variation, see e.g., Fig. 2 in Suttner et al. (1997) or Fig. 8 in Lee & Sahai (2004)]. If this is the case, a sub-knot is expected to be seen closer in at from the source. Indeed, the SiO emission is seen extending all the way to . No such sub-knot (emission peak) is seen there probably because the shock there has just started to develop and is too weak to produce an emission peak. Thus, the SiO emission of the innermost pair of knots seems closely related to the shock enhancement of SiO in gas phase.
SiO abundance can be greatly enhanced in the shocks as a consequence of grain sputtering or grain-grain collisions releasing Si-bearing material into the gas phase, which reacts rapidly with O-bearing species (e.g., O2 and OH) to form SiO (Schilke et al., 1997; Caselli et al., 1997). This shock enhancement mechanism, which requires a flow time 100 yrs (Gusdorf et al., 2008a), seems too slow to explain the SiO emission of the innermost pair of knots, which have a dynamical time 30 yrs with a jet velocity of 170 km s-1, as in HH 212 (Cabrit et al., 2007; Lee et al., 2008). For the innermost SiO emission at (140 AU) from the source, the dynamical time is only 4 yrs. Therefore, at least for the innermost SiO emission, it is possible that SiO was already formed on dust grain and then released in gas phase in the shocks (Gusdorf et al., 2008b).
It is also possible that the decrease in velocity range with the distance for the innermost pair of knots is explained in the context of a X-wind model, in which the jet is actually a dense part of a wide-angle radial wind (Shu et al., 1995; Shang et al., 1998). For a simple comparison, we can assume the jet has a constant transverse size of , then the velocity range is given by km s-1, where is the distance of the jet from the source. Therefore, the velocity range is expected to be 26 km s-1 at and 9 km s-1 at , roughly similar to that seen in the PV diagrams (Fig. 7). In this case, SiO of gas phase could have formed in the jet due to high gas density in the jet (Glassgold et al., 1991), with a mass-loss rate yr-1 (Paper I, ). Further work is needed to study its production rate in order to explain why the SiO emission is not seen all the way to the source.
4.5 Launching radius of the jet
As mentioned, the mean velocity gradient seen across the jet axis toward the innermost pair of knots could be considered as an upper limit of the true gradient due to jet rotation. If this is the case, assuming that the SiO jet is a dense part of a magnetized wind launched from an accretion disk by magneto-centrifugal force, we can estimate the upper limit of the launching radius of the jet. With a central mass of 50 , a jet velocity of 170 km s-1, and a rotation velocity of 0.5 km s-1 at 10 AU, the upper limit of the launching radius is estimated to be 0.014 AU ( 3 ), following Anderson et al. (2003). At this radius, the Keplerian velocity is 54 km s-1, resulting in a jet velocity to Keplerian velocity ratio of 3, close to that expected for a wind launched by magneto-centrifugal force (e.g., Shu et al., 1995; Pudritz et al., 2007).
Velocity gradients have also been seen in another Class 0 source HH 212 across the jet axis toward its innermost pair of SiO knots, SN and SS, and may arise from jet rotation as well (Lee et al., 2008). Since knot SN is closer to the source and less affected by sideways ejection, its velocity gradient, with 0.5 km s-1 at 50 AU, can be considered as an upper limit of the true gradient due to jet rotation. Since the mass of the central protostar is 0.15 (Lee et al., 2006), the jet velocity is expected to be higher than that of HH 211 and can be assumed to be 200 km s-1. Thus, the upper limit of the launching radius of the SiO jet is found to be 0.05 AU for the HH 212 system. At this radius, the Keplerian velocity is 52 km s-1, resulting in a jet velocity to Keplerian velocity ratio of 3.8, also close to that expected for a wind launched by magneto-centrifugal force.
As a result, if the velocity gradients are really due to jet rotation, the SiO jets of the two Class 0 sources could be a part of a magnetized wind launched at 0.014-0.05 AU from the source, much closer than that of the HCO+ outflow, which seems to have an outflow base at the flattened envelope-disk. They could be launched from the innermost edge of the disk near the corotation radius, as predicted in the X-wind model (Shu et al., 1995). They may carry away excess angular momentum from the inner edge of the disk, allowing material to fall on to the protostar. Note that, however, since the velocity gradients could only be considered as upper limits of the true gradients due to jet rotation, the jets could have no rotation and different launching mechanism. Further observations at higher angular resolution are really needed to check this possibility.
5 Conclusions
We have mapped the HH 211 protostellar system in 352 GHz continuum, SiO (), and HCO+ () emission at up to resolution with the SMA. The main conclusions are the following:
-
1.
The continuum source is now resolved into two sources, SMM1 and SMM2, with a separation of 84 AU. SMM1 is seen at the center of the jet, probably tracing a (inner) dusty disk around the protostar driving the jet. Its mass is estimated to be 1–3 . SMM2 is seen to the southwest of SMM1 and may trace a 1.5–4 envelope-disk around a small binary companion.
-
2.
A flattened envelope-disk is seen in HCO+ around SMM1 perpendicular to the jet axis, with a radius of 80 AU. Its velocity structure is consistent with a rotation motion and can be fitted with a Keplerian law that yields a central mass of 5015 . Note that its velocity structure can also be fitted as well with a rotation law .
-
3.
If the flattened envelope-disk is indeed in Keplerian rotation, then the protostar that drives the jet could have a mass of 5015 . Thus, the protostar could be the lowest mass source known to have a collimated jet and a rotating flattened envelope-disk.
-
4.
A small-scale ( 200 AU) low-speed ( 2 km s-1) outflow is seen in HCO+ around the jet axis extended from the envelope-disk. It seems to rotate in the same direction as the envelope-disk with a mean specific angular momentum of 50 AU km s-1, and thus may carry away part of the angular momentum from the envelope-disk.
-
5.
The jet is seen in SiO originating from SMM1. The innermost pair of knots are now seen with a “C-shaped” bending and each consisting of 4 smaller sub-knots. They are very narrow, with a transverse width of 40 AU. Knots further downstream have a head-tail structure, with the head likely resulting from sideways ejection of the internal shocks and the tails tracing the weakly shocked material in the jet beam. The kinematics associated with most of the head-tail knots is consistent with the fast jet material in the tails catching up with the slower material in the heads. The knots likely result from the internal shocks produced by a semi-periodical variation in the jet velocity.
-
6.
We measure the proper motion of the SiO knots by comparing the data between 2008 and 2004, and obtain a transverse velocity of 17060 km s-1. The jet, with an inclination of 5∘ to the plane of the sky, has a velocity the same as the transverse velocity.
-
7.
The SiO associated with the innermost pair of knots could not be formed by grain-sputtering or grain-grain collisions that release Si into the gas phase. We suggest that the SiO could form directly on the grain surfaces and be released to the gas phase in the shocks.
-
8.
A possible velocity gradient is seen consistently across the innermost pair of SiO knots, consistent with the rotation sense of the HCO+ envelope-disk and the large-scale ammonia envelope. If this gradient, with 0.5 km s-1 at 10 AU, is an upper limit of the true rotational gradient of the jet, then the jet carries away a very small amount of angular momentum of 5 AU km s-1 and thus must be launched from the very inner edge of the disk, as predicted in the X-wind model. Further observations at higher resolution are really needed to confirm if this gradient is really due to jet rotation.
References
- Allen, Li, & Shu (2003) Allen, A., Li, Z., & Shu, F. H. 2003, ApJ, 599, 363
- Anderson et al. (2003) Anderson, J. M., Li, Z.-Y., Krasnopolsky, R., & Blandford, R. D. 2003, ApJ, 590, L107
- André et al. (1999) André, P., Motte, F., & Bacmann, A. 1999, ApJ, 513, L57
- Avila et al. (2001) Avila, R., Rodríguez, L. F., & Curiel, S. 2001, Revista Mexicana de Astronomia y Astrofisica, 37, 201
- Beckwith et al. (1990) Beckwith, S. V. W., Sargent, A. I., Chini, R. S., & Guesten, R. 1990, AJ, 99, 924
- Bouy et al. (2008) Bouy, H., et al. 2008, A&A, 486, 877
- Cabrit et al. (2007) Cabrit, S., Codella, C., Gueth, F. Nisini, B., Gusdorf, A., Dougados, C., & Bacciotti, F. 2007, A&A, 469, L29
- Caselli et al. (1997) Caselli, P., Hartquist, T. W., & Havnes, O. 1997, A&A, 322, 296
- Cerqueira et al. (2006) Cerqueira, A. H., Velázquez, P. F., Raga, A. C., Vasconcelos, M. J., & de Colle, F. 2006, A&A, 448, 231
- Chrysostomou et al. (2008) Chrysostomou, A., Bacciotti, F., Nisni, B., Ray, T. P., Eisloffel, J., Davis, C. J., & Takami, M. 2008, A&A, 482, 575
- Codella et al. (2007) Codella, C., Cabrit, S., Gueth, F., Cesaroni, R., Bacciotti, F., Lefloch, B., & McCaughrean, M. J. 2007, A&A, 462, L53
- Coffey et al. (2007) Coffey, D., Bacciotti, F., Ray, T. P., Eislöffel, J., & Woitas, J. 2007, ApJ, 663, 350
- Eislöffel et al. (2003) Eislöffel, J., Froebrich, D., Stanke, T., & McCaughrean, M. J. 2003, ApJ, 595, 259
- Enoch et al. (2006) Enoch, M. L., et al. 2006, ApJ, 638, 293
- Evans (1999) Evans, N. J. 1999, ARA&A, 37, 311
- Fendt & Zinnecker (1998) Fendt, C., & Zinnecker, H. 1998, A&A, 334, 750
- Froebrich et al. (2003) Froebrich, D., Smith, M. D., Hodapp, K.-W., & Eislöffel, J. 2003, MNRAS, 346, 163
- Glassgold et al. (1991) Glassgold, A. E., Mamon, G. A., & Huggins, P. J. 1991, ApJ, 373, 254
- Gueth & Guilloteau (1999) Gueth, F. & Guilloteau, S. 1999, A&A, 343, 571
- Gusdorf et al. (2008a) Gusdorf, A., Cabrit, S., Flower, D. R., & Pineau Des Forêts, G. 2008a, A&A, 482, 809
- Gusdorf et al. (2008b) Gusdorf, A., Pineau Des Forêts, G., Cabrit, S., & Flower, D. R. 2008b, A&A, 490, 695
- Hirano et al. (2006) Hirano, N., Liu, S.-Y., Shang, H., Ho, P. T. P., Huang, H.-C., Kuan, Y.-J., McCaughrean, M. J., & Zhang, Q. 2006, ApJ, 636, L141
- Lada et al. (2006) Lada, C. J., et al. 2006, AJ, 131, 1574
- Launhardt et al. (2008) Launhardt, R., et al. 2008, arXiv:0811.3910
- Lee et al. (2000) Lee, C.-F., Mundy, L.G., Reipurth, B., Ostriker, E.C., & Stone, J.M. 2000, ApJ, 542, 925
- Lee et al. (2006) Lee, C.-F., Ho, P. T. P., Beuther, H., Bourke, T. L., Zhang, Q., Hirano, N., & Shang, H. 2006, ApJ, 639, 292
- Lee & Sahai (2004) Lee, C.-F., & Sahai, R. 2004, ApJ, 606, 483
- Lee et al. (2007a) Lee, C.-F., Ho, P. T. P., Hirano, N., Beuther, H., Bourke, T. L., Zhang, Q., & Shang, H. 2007a, ApJ, 659, 499
- (29) Lee, C.-F., Ho, P. T. P., Palau, A., Hirano, N., Bourke, T. L., Shang, H., & Zhang, Q. 2007b, ApJ, 670, 1188
- Lee et al. (2008) Lee, C.-F., Ho, P. T. P., Bourke, T. L., Hirano, N., Shang, H., & Zhang, Q. 2008, ApJ, 685, 1026
- Lee et al. (2002) Lee, C.-F., Mundy, L. G., Stone, J. M., & Ostriker, E. C. 2002, ApJ, 576, 294
- Lee et al. (2005) Lee, C., Ho, P. T. P., & White, S. M. 2005, ApJ, 619, 948
- Machida et al. (2008) Machida, M. N., Inutsuka, S.-i., & Matsumoto, T. 2008, ApJ, 676, 1088
- McCaughrean et al. (1994) McCaughrean, M. J., Rayner, J. T., & Zinnecker, H. 1994, ApJ, 436, L189
- Nisini et al. (2002) Nisini, B., Codella, C., Giannini, T., & Richer, J. S. 2002, A&A, 395, L25
- Palau et al. (2006) Palau, A., Ho, P. T. P., Zhang, Q., Estalella, R., Hirano, N., Shang, H., Lee, C.-F., Bourke, T. L., Beuther, H., & Kuan, Y.-J. 2006, ApJ, 636, L137 A&A, 416, L9
- Phan-Bao et al. (2008) Phan-Bao, N., et al. 2008, ApJ, 689, L141
- Pudritz et al. (2007) Pudritz, R. E., Ouyed, R., Fendt, C., & Brandenburg, A. 2007, Protostars and Planets V, 277
- Rodríguez et al. (2008) Rodríguez, L. F., Torrelles, J. M., Anglada, G., & Reipurth, B. 2008, AJ, 136, 1852
- Santiago-Garcia et al. (2008) Santiago-Garcia, J., Tafalla, M., Johnstone, D., & Bachiller, R. 2008, arXiv:0810.2790
- Schilke et al. (1997) Schilke, P., Walmsley, C. M., Pineau des Forets, G., & Flower, D. R. 1997, A&A, 321, 293
- Shang et al. (1998) Shang, H. , Shu, F. H. & Glassgold, A. E. 1998, ApJ, 493, L91
- Shu et al. (1995) Shu, F. H., Najita, J. , Ostriker, E. C. & Shang, H. 1995, ApJ, 455, L155
- Stahler (1988) Stahler, S. W. 1988, ApJ, 332, 804
- Suttner et al. (1997) Suttner, G., Smith, M. D., Yorke, H. W. & Zinnecker, H. 1997, A&A, 318, 595
- Tafalla et al. (2004) Tafalla, M., Santiago, J., Johnstone, D., & Bachiller, R. 2004, A&A, 423, L21
- White & Hillenbrand (2004) White, R. J., & Hillenbrand, L. A. 2004, ApJ, 616, 998
- Wiseman (2001) Wiseman, J. 2001, in ASP Conf. Ser. 235, Science with the Atacama Large Millimeter Array, ed. A. Wootten (San Francisco: ASP), 179