A molecular line survey of the extreme carbon star CRL 3068 at millimeter wavelengths
Abstract
We present the results of a molecular line survey of the extreme carbon star CRL 3068 (catalog ). The observations were carried out with the Arizona Radio Observatory (ARO) 12 m telescope and the Heinrich Hertz Submillimeter Telescope (SMT) at the 2 mm and 1.3 mm atmospheric windows. The observations cover the frequency bands from 130–162 GHz and 219.5–267.5 GHz. The typical sensitivities achieved are mK and mK for the ARO 12 m and SMT, respectively. Seventy two individual emission features belonging to 23 molecular species and isotopologues were detected. Only three faint lines remain unidentified. The species -C3H, CH3CN, SiC2, and the isotopologues, C17O and C18O, HC15N, HN13C, C33S, C34S, 13CS, 29SiS, and 30SiS are detected in this object for the first time. Rotational diagram analysis is carried out to determine the column densities and excitation temperatures. The isotopic ratios of the elements C, N, O, S, and Si have also been estimated. The results are consistent with stellar CNO processing and suggest that CRL 3068 (catalog ) is more carbon rich than IRC+10216 (catalog ) and CIT 6 (catalog ). It is also shown that the chemical composition in CRL 3068 (catalog ) is somewhat different from that in IRC+10216 (catalog ) with a more extensive synthesis of cyclic and long-chain molecules in CRL 3068 (catalog ). The results will provide valuable clues for better understanding circumstellar chemistry.
1 Introduction
As a star evolves up the asymptotic giant branch (AGB), copious amount of material at its outer layers are ejected into space through stellar winds and form an expanding circumstellar envelope. Through millimeter-wave and infrared spectroscopy, we have learned that circumstellar envelopes around evolved stars are very efficient chemistry factories that produce organic and inorganic molecules over very short time scales. However, our understanding of the interactions between molecular processes, chemical environment, and local physical conditions is far from complete. In oxygen- and carbon-rich environments, the reaction routes are clearly different. In oxygen-rich objects, the circumstellar chemistry is believed to be dominated by OH and H2O molecules, and the chemical complexity of the oxygen-rich environments has been demonstrated by Ziurys et al. (2007). In carbon-rich objects, a large fraction of oxygen atoms is locked in CO and C-bearing compounds such as hydrocarbons and cyanopolyynes are efficiently reprocessed. Among the carbon-rich objects, the nearby AGB star IRC+10216 (catalog ) has been extensively studied (see, e.g. Cernicharo et al., 2000; He et al., 2008, and references therein), with more than 60 molecular species detected.
This paper is one of a series of studies devoted to the understanding of circumstellar chemistry of evolved stars. In previous work, we have presented the spectra of the AGB stars IRC+10216 (catalog ) (He et al., 2008) and CIT 6 (catalog ) (Zhang et al., 2009) and the planetary nebula (PN) NGC 7027 (catalog ) (Zhang et al., 2008) obtained using the Arizona Radio Observatory (ARO) 12 m telescope and the Heinrich Hertz Submillimeter Telescope (SMT). In the present study, we report a molecular line survey of the carbon-rich circumstellar envelope CRL 3068 (catalog ) using the same telescope settings with the aiming at exploring the molecular constituents and chemistry processes in an extremely carbon-rich environment.
The carbon-rich AGB star CRL 3068 (catalog ) (AFGL 3068 (catalog ), IRAS 23166+1655 (catalog ), LL Peg) is a long-period variable with a very long pulsation period of 696 days (Le Bertre et al., 1995). It has a high C/O abundance ratio of 1.38 (Winters et al., 1997) and has been taken as a prototype of extreme carbon stars (Volk et al., 1992). Jones et al. (1978) investigated the infrared (IR) spectrum of CRL 3068 (catalog ) and detected an SiC absorption feature at 11.3 m. The presence of SiC absorption was further confirmed by Clément et al. (2003) based on the Infrared Space Observatory (ISO) observations. The fact that the SiC feature is in self absorption suggests that the circumstellar envelope of CRL 3068 is extremely optically thick. This is supported by the very low color temperature of the dust emission component ( K, see e.g. Lebofsky & Rieke, 1977; Volk et al., 1992; Omont et al., 1993). Le Bertre et al. (1995) found that the dust continuum spectrum of CRL 3068 the wavelength range 1–50 m is consistent with a dust opacity law of .
Based on a consistent time-dependent hydrodynamical model, Winters et al. (1997) determined the distance to CRL 3068 (catalog ) to be 1.2 kpc, the time averaged outflow velocity as 14.7 km s-1, and the average mass loss rate as M☉yr-1. The distance derived by Winters et al. (1997) is close to a more recent value of 1.05 kpc reported by Yuasa et al. (1999) and Menzies et al. (2006). The derived mass loss rate of Winters et al. (1997) is 2–10 times higher than those obtained using CO lines (Knapp & Morris, 1985; Volk et al., 1993; Schöier et al., 2002; Woods et al., 2003; Teyssier et al., 2006) and that by fitting the dust continuum (Volk et al., 1992). The H I line at 21 cm was detected by Gérard & Le Bertre (2006), who estimated that the H I emission in CRL 3068 (catalog ) is extended over a region in diameter. Mauron & Huggins (2006) imaged the extended circumstellar envelope of CRL 3068 (catalog ) in the optical and were able to trace the galactic scattered light out to a distance of from the star. They estimated the expansion timescale of the envelope to be 15,200 yr. The optical image was characterized by a remarkable spiral pattern traced out to from the center, suggesting that binary companions might play a role in shaping the circumstellar envelope. The scenario of binary-induced outflow was further comfirmed by the near-IR adaptive optics images obtained with the Keck ii telescope, which showed that the central region of CRL 3068 (catalog ) is composed of two components separated by a distance of (Morris et al., 2006). Neri et al. (1998) mapped the CO(1–0) emission, which revealed a compact inner envelope and a surrounding detached bipolar shell.
Molecular lines in CRL 3068 (catalog ) at millimeter wavelengths have been explored by several authors. Relatively strong CO(1–0) line emission has been detected by Knapp & Morris (1985) and Nyman et al. (1992). HC3N lines were first detected by Jewell & Snyder (1984). Nguyen-Quang-Rieu et al. (1988) discovered the HCN(1–0) and H13CN(1–0) line emission. Sopka et al. (1989) reported the observations of CO, 13CO, HCN, H13CN, HC3N, and HNC in this object. Wannier et al. (1991) discovered relatively faint emission from C3H2. Radio observations toward CRL 3068 (catalog ) in the frequency ranges between 39–47 GHz and 85–91GHz were carried out with the Nobeyama 45 m radio telescope by Fukasaku et al. (1994), and the molecular species C2H, HC5N, C4H, and SiS were detected in this object for the first time. Woods et al. (2003) reported a molecular line survey made with the SEST 15 m and Onsala 20 m telescopes. The molecular species in CRL 3068 (catalog ) that were detected positively in their survey observation include CO, 13CO, CN, HCN, H13CN, HNC, C2H, HC3N, C3N, CS, and SiS.
In this paper, we present spectra of CRL 3068 (catalog ), representing the most complete molecular line survey of this carbon-rich envelope so far. The remaining parts of this paper are organized as follows: the observations and data reduction are described in Sect. 2; in Sect. 3, we presents the identification and measurements of detected molecular lines; Sect. 4 gives the column densities and abundances of detected species; in Sect. 5, the implication of our findings on circumstellar chemistry is discussed; our conclusions are summarized in Sect. 6.
2 Observations and data reduction
2.1 The ARO 12 m observations
The spectral line survey at the 2 mm window was carried out during the period from 2007 December to 2008 January with the ARO 12 m telescope at Kitt Peak. The 2-mm dual-channel SIS receivers were employed, operated in single sideband dual polarization mode. The image rejection ratio is larger than dB on most of the occasions. The system noise temperatures were typically 250–550 K. The spectrometer backends employed are two 256-channel filter banks (FBs) with a channel width of 1 MHz and a millimeter autocorrelator (MAC) with 3072 channels and 195 kHz per channel. The observations were made in beam switching mode with an azimuth beam throw of 2. We checked the pointing every 2–3 hours by observations of planets. The pointing accuracy was better than 15 at normal weather conditions. The scanned frequency range was from 130.0 to 163.9 GHz with a few gaps. The half power beam width (HPBW) is about 40′′ at this frequency range. Typical on-source integration times ranged from 70–90 minutes for each frequency setting. For 2 mm observations, we gave priority to the frequency ranges covering the strong lines as observed in IRC+10216 (catalog ) (Cernicharo et al., 2000). Only a few extremely faint lines in the spectra of IRC+10216 (catalog ) fall within the gaps of our spectra. The temperature scale was given in term of , which was calibrated by the chopper-wheel method, and corrected for atmospheric attenuation, radiative loss, and rearward and forward scattering and spillover. The main beam brightness temperature was determined using , where is the corrected beam efficiency ().
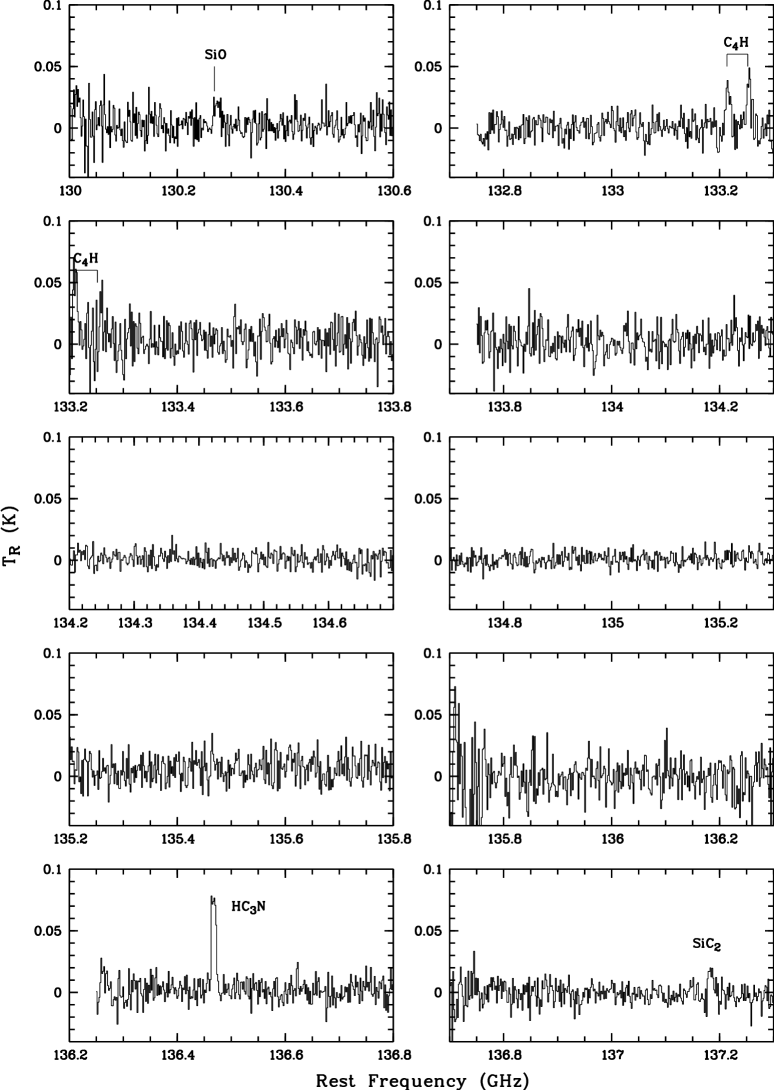
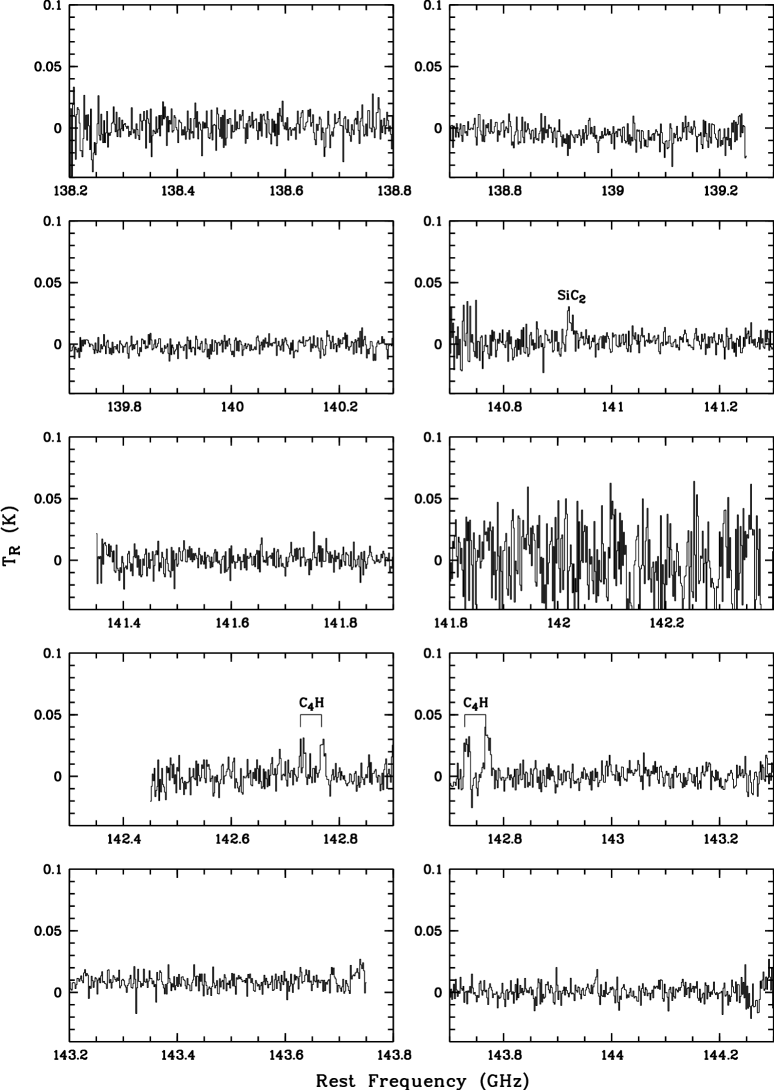
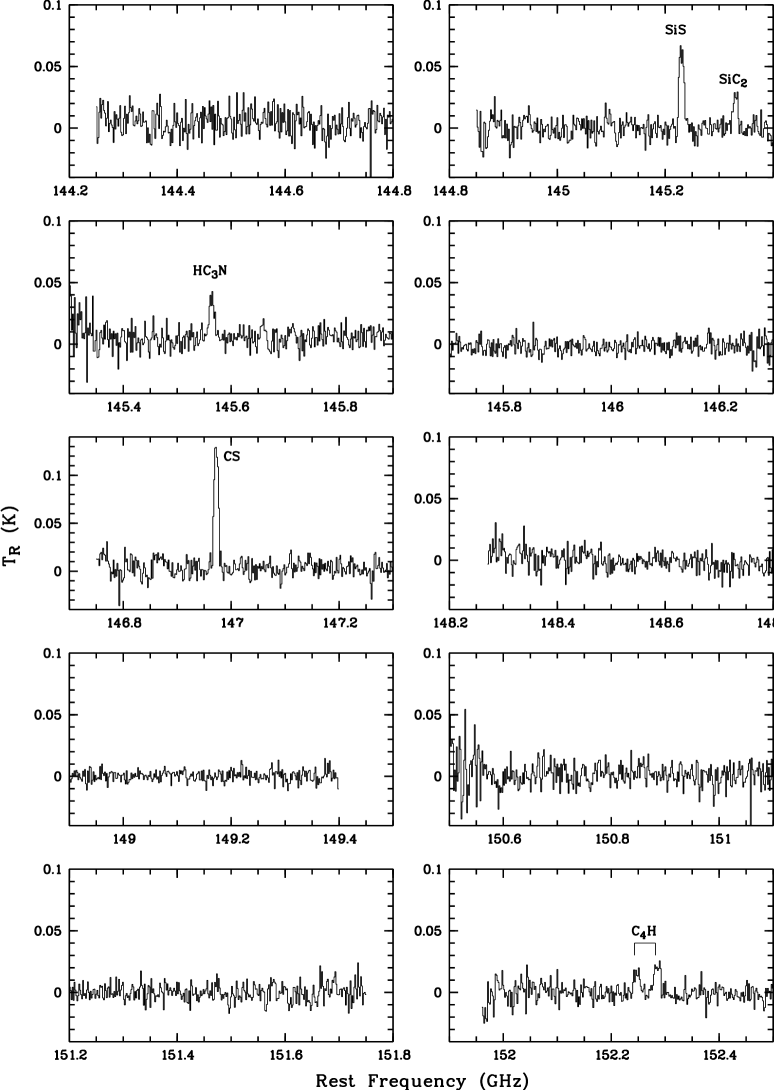
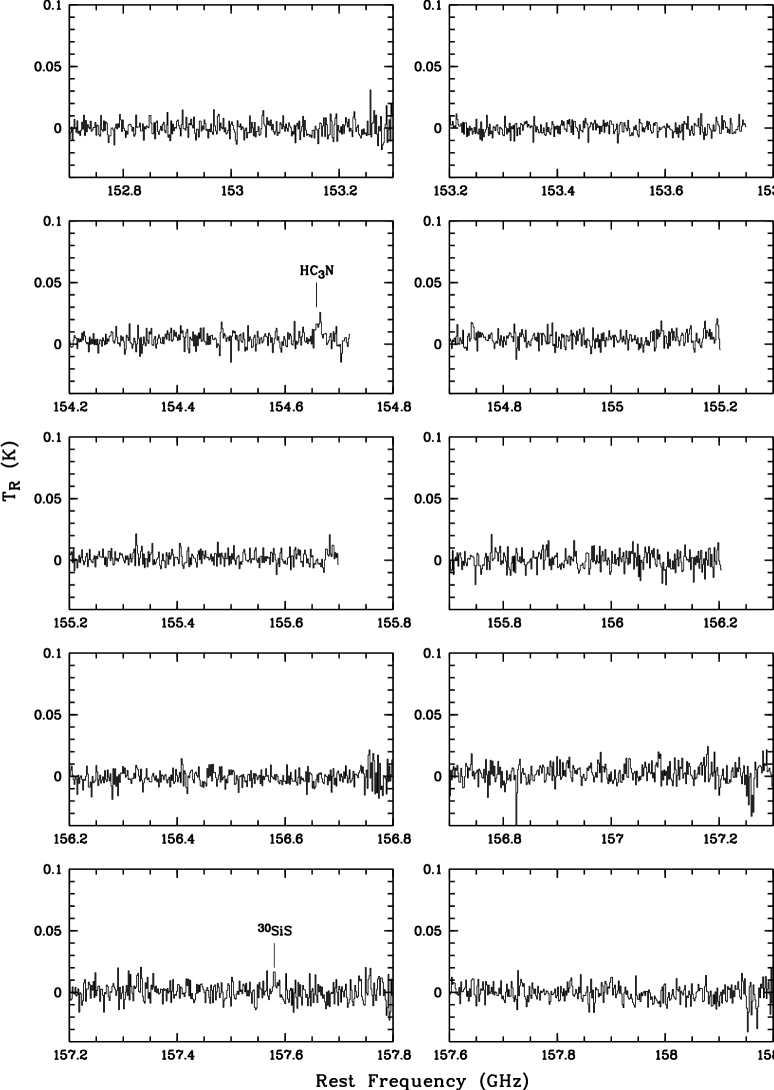
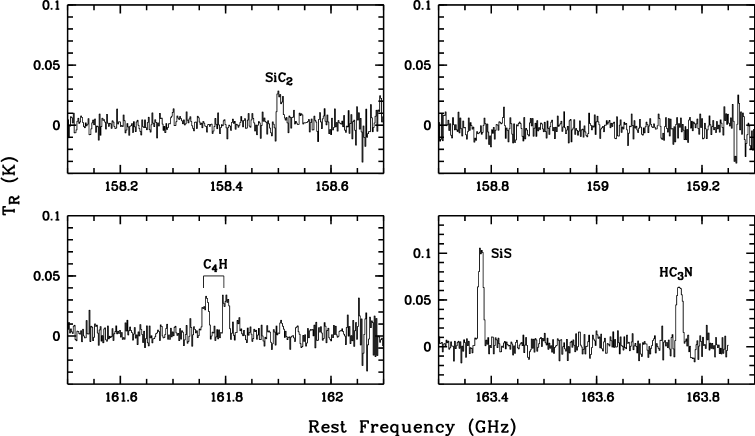
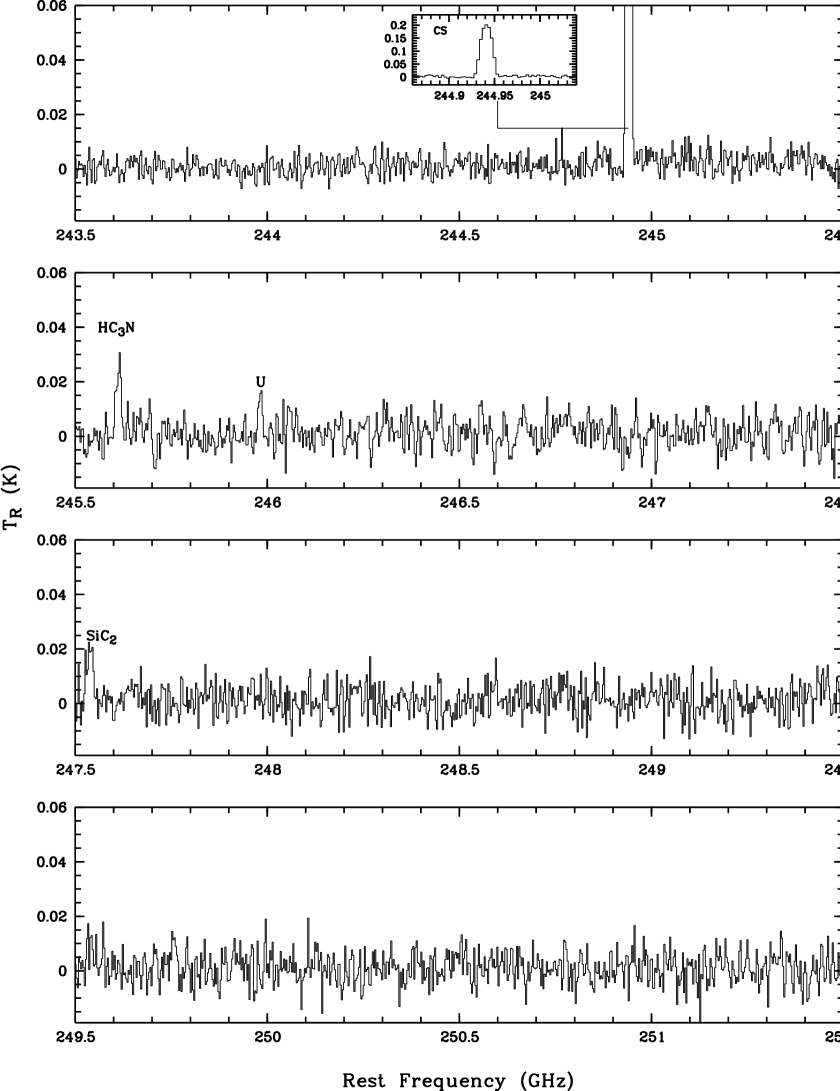
We used the CLASS software package in GILDAS 111GILDAS is developed and distributed by the Observatorie de Grenoble and IRAM. for the data reduction. After discarding the bad scans, we obtained the co-adding spectra from individual scans. On some occasions, the MAC spectra might suffer severe effects from the bandpass irregularities, and thus for some frequency coverages the signal-to-noise ratios might be relatively low due to the exclusion of these scans. The baseline was determined by low-order polynomial fits to the line-free regions of the spectra. In order to improve the signal-to-noise ratio, the spectra were smoothed and rebinned to a frequency resolution of 1 MHz, corresponding a velocity resolution of km s-1. The MAC spectra are presented in Figure 1. The typical rms noise temperature is less than 15 mK in main beam temperature unit.
2.2 The SMT observations
The spectral line survey at the 1.3 mm window was made using the SMT 10 m telescope located on Mt. Graham in 2008 January. For the observations, we utilized the ALMA Band 6 (211–275 GHz) sideband-separating SIS mixing-preamp, yielding a typical image rejection ratio of dB and a system noise temperature of K. The 2048-channel acousto-optical spectrometer (AOS) and the 1024-channel Forbes Filterbanks (FFBs) were used simultaneously and were configured to provide a channel width of 500 kHz and 1 MHz, respectively. A beam switching mode was applied with a separation between the ON and OFF beams of 2 in azimuth. The pointing was checked every 2 hours on nearby planets and was found to be accurate to within 10. The complete frequency range from 219.5 to 267.5 GHz was covered, with typical on-source integration time of 30 minutes at each frequency band. The beam size at this frequency range is about 30′′. The data were calibrated to the temperature scale, which was corrected for atmospheric attenuation. The main beam temperature was derived using , where is the main beam efficiency ().
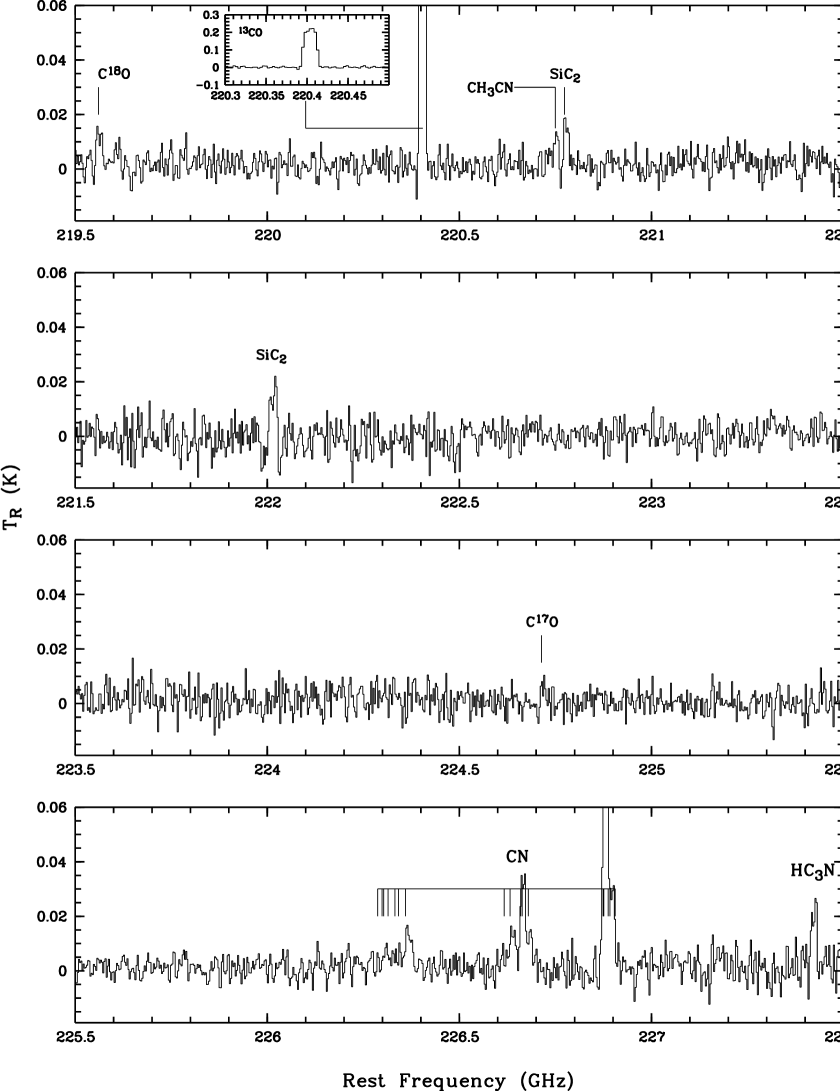
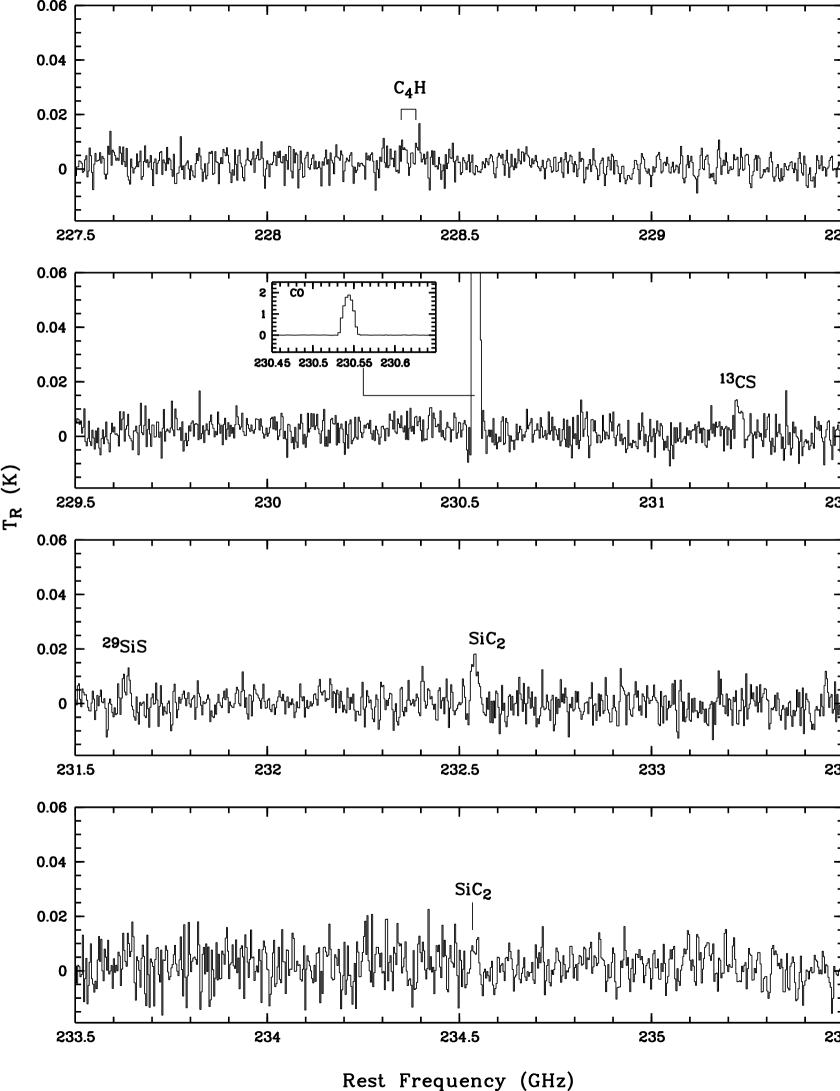
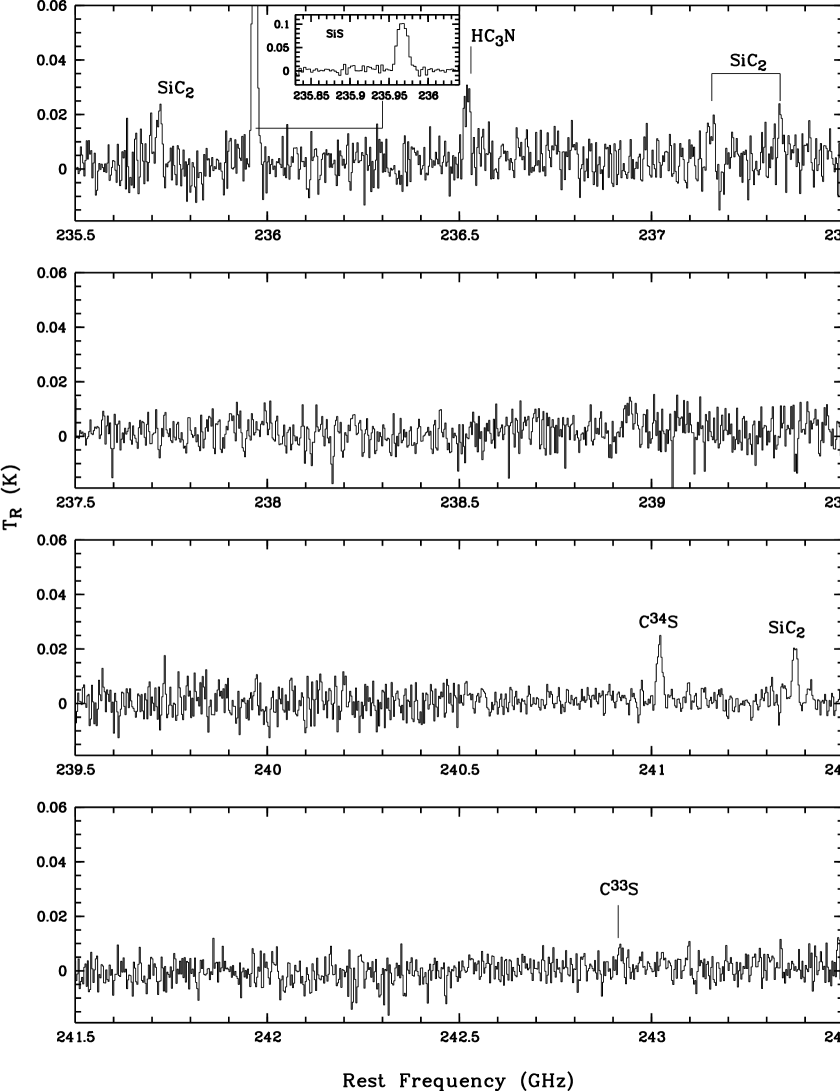
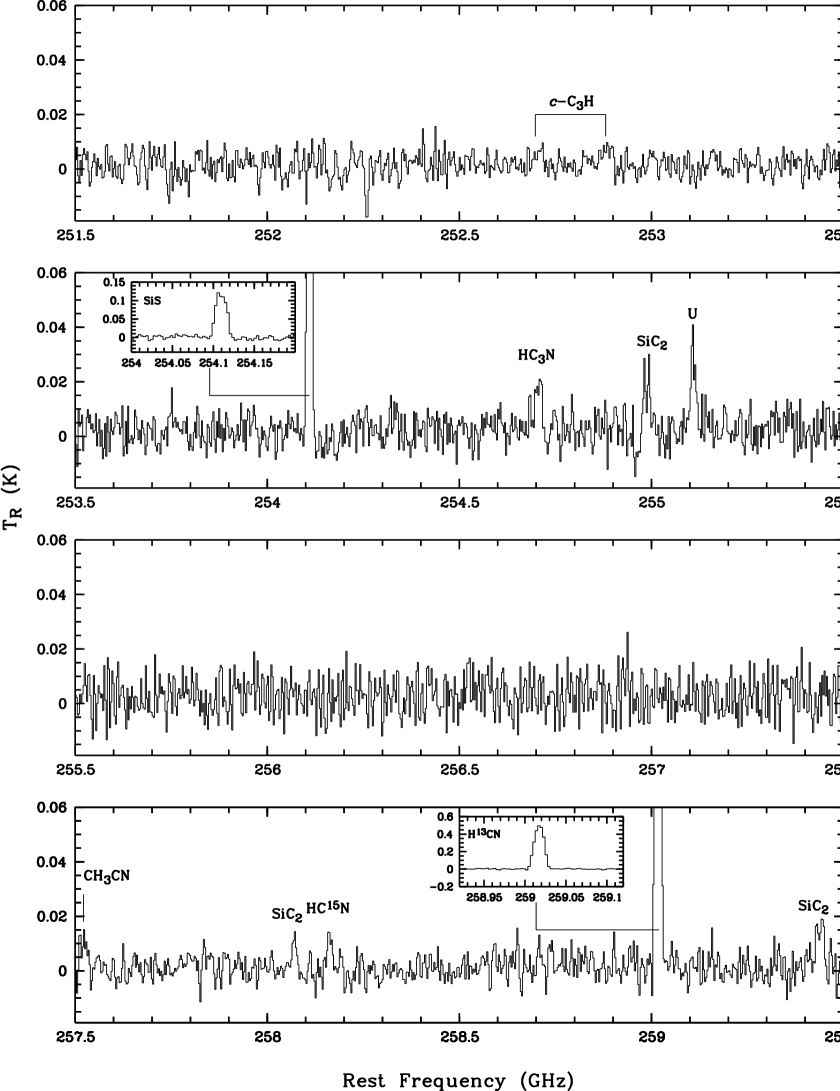
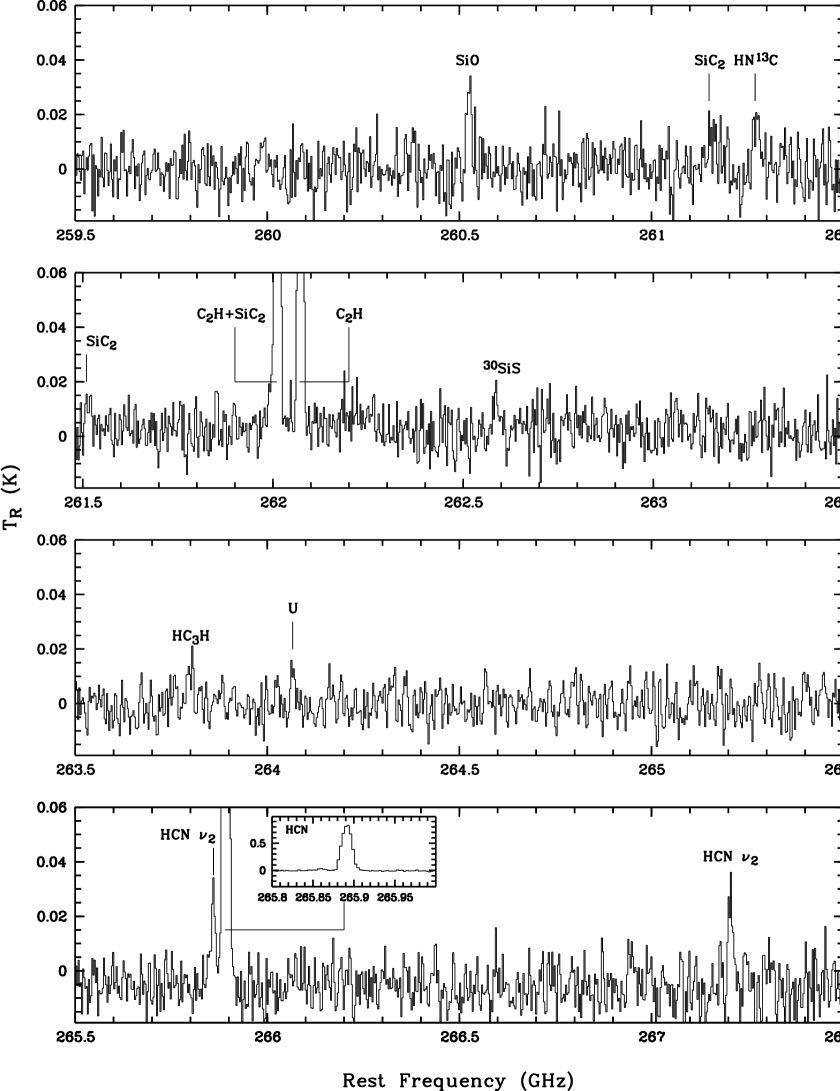
The procedure of data reduction was same as that for the 12 m data. Since there is no gap in the 1.3 mm survey region, all the spectral bands were merged together. Figure 2 gives the FFB spectra, which have been smoothed and rebinned by a factor of 3, yielding a frequency resolution of 3 MHz, corresponding a velocity resolution of 3.7 km s-1, and a typical rms temperature of 5 mK in main beam temperature unit.
3 Observational results
3.1 The overall survey
The spectra together with line identifications are shown in Figures 1 and 2. Note that some features in these figures are not real but caused by bandpass irregularities or bad channels. A total of 75 distinct emission features (including a few uncertain ones) were detected in our survey observations. The most intense line detected in our survey is the CO (2–1) transition, followed by the HCN (3–2) transition. Apart from these two transitions, the others have integrated intensities of less than 10 K km s-1. The molecular lines detected in the high frequency window are a factor of about two more than those detected in the low frequency window. This is partially due to the fact that the ARO 12 m telescope has a larger beam size than the SMT and thus the 12 m data are more likely to be affected by the beam dilution. The molecular line databases that are used for line identifications include the archives of molecular line frequencies derived from the theoretical calculations of the JPL catalog (Pickett et al., 1998)222http://spec.jpl.nasa.gov. and and the Cologne database for molecular spectroscopy (CDMS, Müller et al., 2001, 2005)333http://www.ph1.uni-koeln.de/vorhersagen/., and those from previous observations of other sources (e.g. Cernicharo et al., 2000; Pardo et al., 2007; He et al., 2008; Zhang et al., 2009, and the NIST Recommended Rest Frequencies for Observed Interstellar Molecular Microwave Transitions444http://physics.nist.gov/cgi-bin/micro/table5/start.pl). We identified 11 main molecular species, including CO, CS, C2H, C4H, -C3H, CH3CN, CN, HCN, SiC2, SiO, and SiS, and 12 rare isotopologues, including 13CO, C17O, C18O, C33S, C34S, 13CS, HC15N, H13CN, HN13C, HC3N, 29SiS, and 30SiS. Only three fairly weak features remain unidentified. Several transitions are new detection in CRL 3068 (catalog ). A full list of line identifications and measurements is presented in Table 1. Columns 1–3 give the identified species, transitions, and frequencies, respectively. The rms noise levels are given in column 4. Column 5 and 6 lists the peak and integrated intensities. Column 7 gives the line widths () obtained by fitting Gaussian line profiles. For blended lines, Table 1 gives the intensities and widths of the combined features.
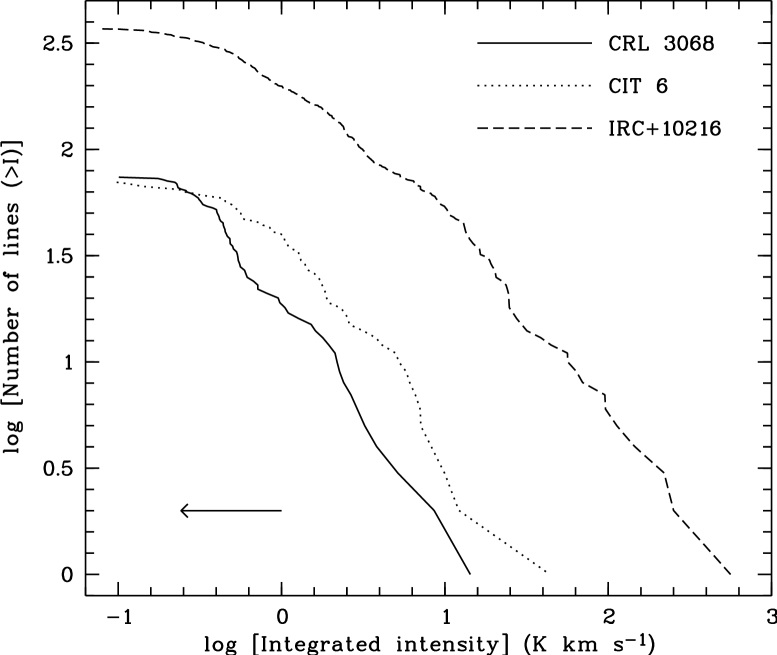
Figure 3 shows the cumulative number of detected lines exceeding a given integrated intensity. For comparison, the figure also plots the results for the spectra of IRC+10216 (catalog ) and CIT 6 (catalog ) which were obtained in the same observation project (He et al., 2008; Zhang et al., 2009). The shapes of these curves in Figure 3 are similar with each other although that of CRL 3068 (catalog ) seems to be slightly steeper than the other two. This suggests that the differences between the three objects can be mostly a distance effect, and the detection of a large number of lines in IRC+10216 does not imply that IRC+10216 is unique or richer in molecular content than the other two.
3.2 Individual molecules
The details of the molecules detection in CRL 3068 (catalog ) are described below. Here we compare these detections with the spectra of IRC+10216 (catalog ) and CIT 6 (catalog ), which are respectively from He et al. (2008) and Zhang et al. (2009) if no statement is issued.
3.2.1 CO
The –1 transitions of CO and its isotopologues 13CO, C17O, and C18O were detected by the SMT. The CO (2–1) transition is the strongest line detected in this survey, with an integrated intensity of 35.9 K km s-1. This line has been observed by Volk et al. (1993) using the 15 m JCMT. They obtained an integrated intensity of d K km s-1 (i.e. d K km s-1), slightly larger than our result. A higher integrated intensity of the CO (2–1) line was detected by Groenewegen et al. (1996) using the IRAM telescope. However, considering the larger beam size of the SMT compared to those of JCMT and IRAM, these intensity discrepancies are insignificant. The 13CO (2–1) line has also been detected by Groenewegen et al. (1996) and Bujarrabal et al. (1994). Our result yields an intensity ratio of (13CO 2–1)/(12CO 2–1), larger than the values of 0.10 and 0.07 found in IRC+10216 (catalog ) and CIT 6 (catalog ). This reflects differnt 13C/12C isotopic ratios and/or different optical depth effects on the three objects. The faint C17O and C18O lines are only marginally above the detection limit. The two rare isotopologues should be new detections for this object. The CO line shows a narrower profile than the isotopic lines which can be explained by the fact that the former is optically thick.
3.2.2 CS
The –2 and –4 transitions of CS were detected by the ARO 12 m and the SMT, respectively. The two CS lines toward this source have also been detected by Bujarrabal et al. (1994) using the IRAM telescope. In the 1.3 mm window, we for the first time detected the –4 isotopic transitions of C33S, C34S, and 13CS, among which the C33S (5–4) line emission is relatively faint and its measurement is uncertain. The –2 isotopic transitions lie in the 2 mm region, but are below our detection limit. The two main lines have a similar width but are narrower than the isotopic lines, suggesting that the main lines are optically thick. We obtained the intensity ratios of (13CS 5–4)/(12CS 5–4) and (C34S 5–4)/(C32S 5–4), larger than the corresponding values of 0.03 and 0.07 in IRC+10216 (catalog ). The trend is the same as that found for the (13CO 2–1)/(12CO 2–1) ratio.
3.2.3 C2H
Fukasaku et al. (1994) detected C2H in this object through the –0 transition. Their detection was further confirmed by Woods et al. (2003). The –2 transition is split in six hyperfine-structure lines grouped in three fine-structure groups, which lie in our survey range. The two strong main components, 37/2–25/2 and 35/2–23/2, are clearly detected in the 2 mm window. The 37/2–25/2 transition is blended with a considerably weaker SiC2 line. The faint 35/2–25/2 transition is overwhelmed by noise. We obtained the intensity ratio of (C2H 37/2–25/2)/(C2H 35/2–23/2), in good agreement with the values of 1.4 and 1.5 found in IRC+10216 (catalog ) and CIT 6 (catalog ), respectively.
3.2.4 C4H
The –9 transition of C4H in this object has been detected by Fukasaku et al. (1994). Due to fine structure interaction, every rotational transition of C4H is split into two components, which have similar intensities. A total of 12 favorable lines of C4H lie in our survey range. The eight C4H lines in the 2 mm window were clearly detected. The four lines in the 1.3 mm window are too faint to obtain reliable measurements. In Table 1, we only give an uncertain detection of the C4H (24–23 a,b) lines, which is the strongest transition of C4H in the 1.3 mm window. We found that these high- C4H lines are at least 3 times fainter than those in the 2 mm window. In IRC+10216 (catalog ), however, these C4H transitions have a similar strength (see Table 9 of He et al., 2008). This cannot be completely attributed to different beam dilution effects in the two objects, and can be a reflection of the different physical conditions of the two carbon envelopes.
3.2.5 -C3H
The cyclopropynylidyne radical (-C3H) has not been detected in CRL 3068 (catalog ) before this work. Here we report the first tentative detection of this species. Six favorable transitions of -C3H lie in our survey region. Only the strongest two transitions are discovered in our spectra with relatively weak strengths. -C3H has been detected in IRC+10216 (catalog ), whereas there is no evidence for the corresponding lines of -C3H in CIT 6 (catalog ).
3.2.6 CH3CN
There was no report of the detection of CH3CN in this object before this work. Woods et al. (2003) estimated the intensity upper limit of the (61–51) transition. Here we present the first detection of CH3CN in this object. There are a total of 14 favorable CH3CN transitions in our survey region. The strongest two fine-structure groups are clearly detected in the 1.3 mm window, but the others are below our detection limit. This species was also detected in IRC+10216 (catalog ) and CIT 6 (catalog ).
3.2.7 CN
The cyanogen radical (CN) is one of the most abundant molecules in envelopes of carbon rich stars. CN in CRL 3068 (catalog ) has been discovered by Woods et al. (2003) and Bachiller et al. (1997) in the –0 and –1 transitions. There are three –1 fine-structure groups of CN present in our survey region. They are split into total of 18 hyperfine structure components. All the three groups were apparently observed in the 2 mm window. The weakest one around 226.33 GHz should be a new detection. Our observations suggest the intensity ratio of the fine-structure groups around 226.87 GHz and 226.69 GHz to be 1.6, in excellent agreement the value of 1.4 obtained by Bachiller et al. (1997). The value is also consistent with those found in IRC+10216 (catalog ) and CIT 6 (catalog ).
3.2.8 HCN
The –2 transitions of HCN and its isotopologues HC15N and H13CN were clearly detected with well-defined profiles in the 2 mm window. The HCN (3–2) transition is the second strongest line after the CO (3–2) transition in our survey. A few vibrationally excited lines of HCN have been detected in IRC+10216 (catalog ) and CIT 6 (catalog ). The strongest two are detected in the spectra of CRL 3068 (catalog ). To our knowledge, this is the first detection of vibrationally excited lines in this object. We discovered the isotopologue HC15N for the first time. The intensity ratio of (HC15N 3–2)/(H13CN 3–2) is 0.027, which is slightly higher than the value of 0.016 obtained in IRC+10216 (catalog ). We also obtained the intensity ratio of (H13CN 3–2)/(H12CN 3–2), larger than the values of 0.16 and 0.41 found in IRC+10216 (catalog ) and CIT 6 (catalog ). The larger isotopologue-to-main line ratios in CRL 3068 (catalog ) are also found for CO and CS (see above). Consequently, we infer that the lines in this extreme carbon star is more optically thick than those in IRC+10216 (catalog ) and CIT 6 (catalog ).
3.2.9 HNC
HNC has been detected in CRL 3068 (catalog ) (Sopka et al., 1989; Fukasaku et al., 1994; Woods et al., 2003). This species can be produced through a similar way to HCN. HNC can also be enhanced through ion-molecular reactions or be transferred into HCN in high temperature. An abundance comparison of HNC with HCN can provide some insight into circumstellar chemistry. Although no HNC line lies in our survey region, we conclusively detected its isotopologue HN13C in the –2 transition for the first time. Our observations suggest the intensity ratio (H13CN 3–2)/(HN13C 3–2) to be 19.3, about an order of magnitude lower than that in IRC+10216 (catalog ). This implies that HNC has been enhanced in CRL 3068 (catalog ). HN13C was not detected in CIT 6 (catalog ).
3.2.10 HC3N
Cyanoacetylene (HC3N) has been commonly detected in carbon-rich circumstellar envelopes. The presence of HC3N in CRL 3068 (catalog ) has been confirmed (Jewell & Snyder, 1984; Sopka et al., 1989; Bujarrabal et al., 1994; Fukasaku et al., 1994; Woods et al., 2003). Nine HC3N transitions from –14 to –28 lie in the frequency range of our survey. All of them were detected in our spectra. Most of these high- transitions are new detections.
3.2.11 SiC2
SiC2 is the species having the most emission lines in our survey. Including possible detections and blended features, a total of 23 SiC2 transitions were detected. These SiC2 lines are relatively weak with peak brightness temperatures less than 40 mK. We cannot find previous papers reporting on the detections of SiC2 in CRL 3068 (catalog ). Woods et al. (2003) failed to discover SiC2 in this object and estimated an intensity upper limit of the SiC2 (50,5–40,4) transition.
3.2.12 SiO
SiO in CRL 3068 (catalog ) has been detected by Bujarrabal et al. (1994) in the –1 and –2 transitions. In our survey the –2 and –5 transitions were detected. The SiO (6–5) transition was also detected in our spectra of IRC+10216 (catalog ) and CIT 6 (catalog ). We found that the relative intensity of the SiO transition in CRL 3068 (catalog ) is much lower than those in IRC+10216 (catalog ) and CIT 6 (catalog ). We obtained the intensity ratio of (SiO 3–2/(13CO 3–2) in CRL 3068 (catalog ) is 0.1, an order of magnitude lower than the values of 1.1 and 1.0 found in IRC+10216 (catalog ) and CIT 6 (catalog ). Its isotopic transitions 29SiO and 30SiO (3–2) lie in the surveyed range but are overwhelmed by noise.
3.2.13 SiS
The –5 and –4 transitions of SiS in CRL 3068 (catalog ) have previously been observed by Bujarrabal et al. (1994), Fukasaku et al. (1994), and Woods et al. (2003). In this survey we conclusively detected four SiS transitions with higher (8–7, 9–8, 13–12, and 14–13) transitions. We also report the first possible detection of the isotopologues 29SiS and 30SiS.
3.2.14 Unidentified lines
Three weak lines detected at 3–8 noise levels remain unidentified. The 264067 MHz line probably corresponds to the U264072 line detected in IRC+10216 (catalog ) and the other two U lines have no corresponding detection in IRC+10216 (catalog ) and CIT 6 (catalog ). We also searched the NIST frequency table and found that the two features at 245982 MHz and 255108 MHz seem to be associated the U lines at 245993 MHz and 255158 MHz detected in Sgr B2(N) (Nummelin et al., 1998).
3.3 Line profiles
Since the circumstellar envelopes of AGB stars are expanding, molecular line profiles can provide significant insight into the nature of the lines as well as the kinematic structure of the envelopes. The lines arising from a spherical envelope might have four characteristic profile shapes (see e.g., Habing & Olofsson, 2003; Kwok, 2006): (a) a flat-topped line profile resulting from optically thin, spatially unresolved emission; (b) a parabolic line profile resulting from optically thick, spatially unresolved emission; (c) a double-peaked line profile resulting from optically thin, spatially resolved emission; (d) a smoothed parabolic (or seemingly flat-topped) line profile results from optically thick, spatially resolved emission. Our observations show that most of the detected lines are consistent of they being unresolved. The profiles of the CO, CS, and HCN emission lines appear to be parabolic, indicating that they are optically thick. The 13CO line show a rectangular profile, suggesting that it is likely optically thin. Some of the lines, such as vibrationally excited lines of HCN, exhibit fairly narrow profiles, probably because they are excited in a compact region close to the central star. The different widths for different emission lines seem to suggest that the expansion velocity of the envelope is not constant.
3.4 Nondetection
Compared with the spectra of IRC+10216 (catalog ), the nondetected molecular species in our survey region include AlCl, AlF, MgNC, NaCN, NaCl, PN, C2S, C3H, -C3H2, C3N, C3S, -C4H2, H2CO, SiC, and SiN. All the emission lines from these species are weak in IRC+10216 (catalog ) and are estimated to have an integrated-intensity upper-limit of 0.2 K km s-1 in CRL 3068 (catalog ). If the line intensities relative to the 13CO (2–1) transition in CRL 3068 (catalog ) are the same as those in IRC+10216 (catalog ), all these lines are well below our detection limit. Therefore, we cannot draw the conclusion that the molecular species in CRL 3068 (catalog ) are less abundant than in IRC+10216 (catalog ).
4 Column densities and abundances
For comparison, we have applied the same approach as used in our previous papers (Zhang et al., 2008, 2009) to calculate the column densities and abundances of the molecules detected in our spectra. This will minimize the effects of systematic errors when we compare the results in different objects.
The excitation temperatures () and column densities () were deduced using the standard rotational-diagram analysis. Under the assumption that the lines are optically thin, the level populations are in local thermal equilibrium (LTE), and , where is the cosmic background radiation temperature (2.7 K), we have the relation,
| (1) |
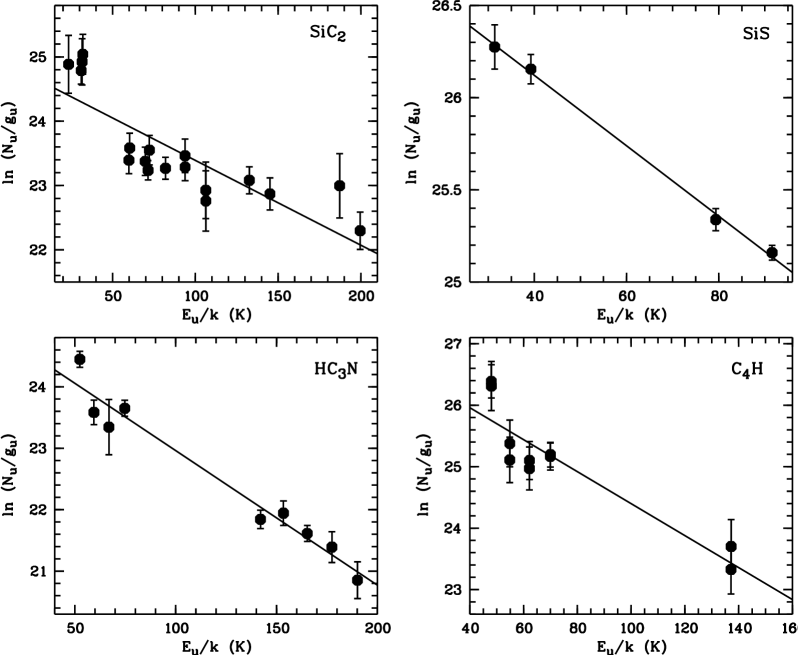
where , , and is the population, degeneracy, and excitation energy of the upper level, is the integration of the source brightness temperature over the velocity, is the line strength, is the dipole moment, is the line frequency, is the rotational partition function. If several transitions arising from levels covering a wide energy range are observed, and can be determined using a straight-line fit to versus . Departure from the linear relation suggests different excitation mechanisms or misidentification. For the calculations, we have corrected the effect of beam dilution through , where (″ and 30″ for the ARO 12 m and the SMT respectively) is the antenna full beam at half-power, and is the source diameter. Different transitions may have different and it is hard to determine for each molecule. According to the CO observations reported by Neri et al. (1998) and Teyssier et al. (2006), we assumed . The assumed value is similar to that used by Fukasaku et al. (1994) and will introduce a uncertainty in the derived column densities. Four molecular species, SiC2, SiS, HC3N, and C4H have adequate numbers of detected transitions covering a wide range of excitation energy and the rotational diagrams of these species are given in Figure 4. Although in general the transitions of these species are well fitted by straight lines, we note that the rotational diagram of SiC2 indicates a higher for high- transitions compared to the low- ones. This is similar to what is found in IRC+10216 (catalog ) (Avery et al., 1992; He et al., 2008), suggesting that excitation by infrared radiation may be important for this molecule in AGB envelopes. For the species for which the rotational diagrams are unavailable, an average ( K) was assumed to calculate their column densities.
The molecular abundances respect to molecular hydrogen () were calculated using the expression by Olofsson (1996),
| (2) |
where is given in K km s-1, the full half power beam width is in arc sec, the expansion velocity is in km s-1, is the distance in pc, is the mass loss rate in , the line frequency in GHz, is the statistical weight of the upper level, is the Einstein coefficient for the transition, is the energy of the lower level, and with and the inner radius and outer radius of the shell. To aid the reader, Appendix A provides full deduction of this formula. For the abundance calculation, we first determined the mass loss rate using the CO (2–1) line. Using the formula of Winters et al. (2002) and assuming and a distance of 1.05 kpc, we obtained , in good agreement with the recent result of Schöier et al. (2002) and Woods et al. (2003) but a factor of two lower than that of Teyssier et al. (2006). Whenever available, the and values given by Woods et al. (2003) were used. The emission regions of isotopologues were assumed to have the same inner and outer radii with those of their main species. The values derived from rotation diagram analysis are adopted. For species where more than one line is detected, we find that the spreads of the abundances derived from different transitions are very small (), and determine the average values weighted by line intensity. Although the adopted value is significantly larger than the average excitation temperature derived by Woods et al. (2003) for a sample of carbon stars and the excitation temperature may not be homogeneous within the envelope, the abundances are essentially insensitive to in the case of .
The derived values for , , and are given in Table. 2 . Our calculations are based on an optically thin assumption. Therefore, for the optically thick emission, the and given in Table 2 should be treated as lower limits. Combining various error sources (uncertainties of line intensity, excitation temperature, distance, mass-loss rate, etc.), we crudely estimate that the errors of the absolute column densities and abundances amount to a factor of . Note that the estimated errors are for the case that the basic assumptions of the method, i.e. optically thin emission, are met. If the extent of a given species is significantly different from that of CO, its column density may bear a larger error than estimated here. It is impossible to accurately determine the extent of each species without interferometric observations. In most of the cases, the self-shielding molecule CO is more extended than other molecules (see, e.g., Woods et al., 2003). If the source size is overestimated by a factor of two, the resultant column density will been underestimated by a factor of four. Accordingly, it is possible that the actual errors could rise above a factor of ten. Nevertheless, the column density ratios and the abundance ratios should be much more reliable.
Table 2 also gives a comparison of our results with those derived by Fukasaku et al. (1994) and Woods et al. (2003). While more molecular species are detected in our survey, for the molecules that are commonly detected (but no necessarily from the same transitions), Table 2 shows that the and values are in agreement within one order of magnitude. Such discrepancies are understandable considering different instruments and methods used for the observations and abundance analysis.
5 Discussion
5.1 Isotopic species
Theory predicts that during the AGB phase the nucleosynthesized products in the inner shell are dredged up to the stellar surface, resulting in changing the isotopic ratios of circumstellar envelopes (see Busso, 2006, for a recent review). Extensive observations have shown that the isotopic composition in carbon-rich stars is remarkably non-solar (e.g. Cernicharo et al., 2000), providing substantial tests for nucleosynthesis theory of AGB stars. Such non-solar isotopic ratios also make possible the identification of stellar solid-state materials in the Solar System (Zinner, 1998).
In Table 3, we give the isotopic ratios (or their lower limits) of carbon, oxygen, nitrogen, sulfur, and silicon in the extreme carbon star, CRL 3068 (catalog ). This table also lists the isotopic ratios for CIT 6 (catalog ), IRC+10216 (catalog ), and the Sun. A comparison of isotopic ratios in these objects allow us to study the nucleosynthesis and dredge-up processes in diverse physical conditions.
5.1.1 Carbon
The 12C/13C isotopic ratio is a good indicator of interior nucleosynthesis processing. The dredge-up processes can greatly enhance 13C in the surface. Moreover, the cool bottom processing and hot bottom burning can further decrease the 12C/13C ratio (e.g. Boothroyd & Sackmann, 1999; Frost et al., 1998).
We detected three 13C-bearing species, 13CO, 13CS, and H13CN. However, the CO/13CO, CS/13CS, and HCN/H13CN ratios only give lower limits of the 12C/13C because the main lines appear to be optically thick. On the other hand, if the 32S/34S isotopic ratio were known, we could use the optical thin 13CS and C34S lines to obtain the 12C/13C ratio. Based the fact that the nucleosynthesis in AGB stars is expected not to affect the abundances of sulfur isotopologues and that Cernicharo et al. (2000) has found the sulfur isotopic ratio in IRC+10216 (catalog ) to be close to solar, we can reasonably assume that the 32S/34S ratio in CRL 3068 (catalog ) is solar (22.5). From this assumption, we obtained a 12C/13C ratio of 29.7. Using a full radiative transfer analysis of 12CO and 13CO line emission, Woods et al. (2003) derived the 12C/13C ratio of 30, lending strong support to our result. The 12C/13C ratio in CRL 3068 (catalog ) is significantly lower than the solar value, suggesting the presence of extra mixing processes.
As a consequence of dredge-up processes, the C/O abundance ratio in circumstellar envelopes decreases along with the 12C/13C ratio. As shown in Table 3, the 12C/13C ratio in CRL 3068 (catalog ) is about a factor of 1.5 lower than those found in CIT 6 (catalog ) and IRC+10216 (catalog ), suggesting that CRL 3068 (catalog ) has a higher C/O ratio. Our observations, therefore, provide an opportunity to study circumstellar chemistry in extremely carbon rich environment.
5.1.2 Nitrogen
As a star ascends the AGB, the 14N-rich and 15N-poor material processed by the CNO cycle in the intershell is dredged up to the stellar surface, resulting a high 14N/15N abundance ratio in the envelope. Wannier et al. (1991) determined the lower limits of 14N/15N in a sample of carbon stars and found that in most of the cases they were larger than the terrestrial ratio.
The nitrogen isotopologue, 15N, has been detected through a faint emission line from HC15N. As its main line is optically thick, the HC14N/HC15N abundance ratio gives a lower limit of the isotopic ratio of 45. The optically thin species H13C14N and H12C15N may also be applied to derive the 14N/15N ratio. Assuming a 12C/13C ratio of 29.7 (see above), we obtained the 14N/15N ratio of 1099, a factor of 4 higher than the solar value. Wannier et al. (1991) obtained a lower limit of 14N/15N for CRL 3068 (catalog ), in good agreement with our result. The deduced nitrogen isotopic ratio is in accord with the predictions of stellar models.
5.1.3 Oxygen
Nucleosynthesis models predict enhancement of 17O in the circumstellar envelopes around carbon stars (Busso, 2006). Previous observations have shown that the C17O/C18O ratios in carbon-rich envelopes are significantly higher than the terrestrial and interstellar values (Wannier & Sahai, 1987; Kahane et al., 1992).
The weak C18O and C17O (2–1) transitions were detected in our survey, allowing us to determine the oxygen isotopic ratios in CRL 3068 (catalog ). The abundance ratios of CO and its isotopologues gives lower limits of isotopic ratios, as can be seen in Table 3. Under the assumption of 12C/13C, we used the optically thin species 13CO, C18O, and C17O to obtain the 16O/17O, 16O/18O, and 17O/18O ratios of 668, 472, and 0.7, respectively. The 16O/17O and 17O/18O ratios bear a large uncertainty, but clearly point to an enhancement of 17O. The 16O/18O ratio is comparable with the solar value. These isotopic ratios are well within the ranges reported by Kahane et al. (1992) for a sample of carbon-rich envelopes.
5.1.4 Sulfur and silicon
The isotopic compositions of sulfur and silicon are hardly affected by nucleosynthesis of AGB stars although they might be slightly changed by neutron capture. This is consistent with the observations that the S and Si isotopic ratios in IRC+10216 (catalog ) and CIT 6 (catalog ) are close to the solar values (Cernicharo et al., 2000; Zhang et al., 2009).
We detected the S and Si isotopologues 33CS, 34CS, 29SiS, and 30SiS in CRL 3068 (catalog ). The main line CS (3–2) is optically thick, while the few SiS transitions are likely to be optical thin. Consequently, we derived the 33S/34S , 29Si/30Si, 28Si/30Si, and 28Si/29Si ratios, and the lower limit of the 32S/34S ratio, as listed in Table 3. In IRC+10216 (catalog ) and CIT 6 (catalog ), the Si isotopic ratios were also obtained from the SiO and SiC2 isotopologues (He et al., 2008; Zhang et al., 2009), which, however, were not detected in the spectra of CRL 3068 (catalog ). We found that these S and Si isotopic ratios are compatible with the solar values, and there is no significant deviation between the S and Si isotopic ratios in CRL 3068 (catalog ) and those in IRC+10216 (catalog ) and CIT 6 (catalog ).
5.2 Remarks on the comparison between CRL 3068 and IRC+10216
CRL 3068 (catalog ) and IRC+10216 (catalog ) are the prototypes of extreme carbon stars, which are highly evolved heavily obscured by thick dust shells (Volk et al., 1992). Nevertheless, there exist some differences between the two objects. CRL 3068 (catalog ) has a colder IR color temperature than IRC+10216 (catalog ) (e.g. see Omont et al., 1993). Based on the (ISO) observations, Justtanont et al. (1998) have determined the color temperatures of CRL 3068 (catalog ) and IRC+10216 (catalog ) to be of 320 and 540 K, respectively. The ISO spectra show that the SiC 11.3 m feature exhibits a weak flat-topped emission profile in IRC+10216 (catalog ) while in CRL 3068 (catalog ) it is in absorption. This suggests either that CRL 3068 (catalog ) has a thicker dust envelope, or the abundance of the SiC grains is higher. Both the color temperature comparison and the SiC feature are consistent with the suggestion that CRL 3068 (catalog ) is in an even more evolved state than IRC+10216.
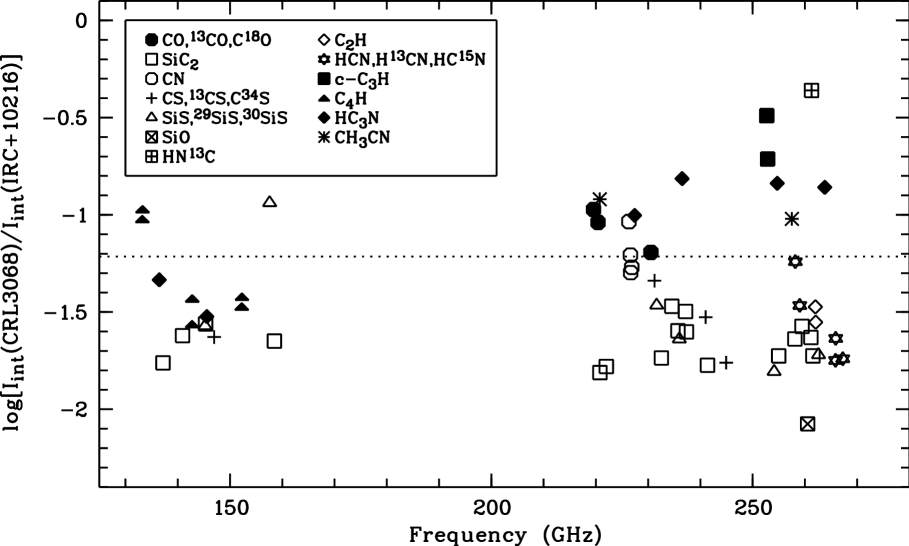
In Figure 5, we compare the integrated intensity ratios of the lines detected in CRL 3068 (catalog ) and IRC+10216 (catalog ). The average line ratio between the two objects is 0.06 with a standard deviation of 0.07. While there is a large scatter of ratios between species, for individual species the ratios are quite consistent. For example, the intensity ratios of SiC2 lines have an average of 0.022 with a standard deviation of 0.005. Note that in this analysis, we have not taken into account the beam dilution effect. Using the same method in Zhang et al. (2009) and assuming that CRL 3068 (catalog ) and IRC+10216 (catalog ) have diameters of 22′′ and 30′′ respectively, we estimate that these intensity ratios would increase by a factor of 1.6 and 1.4 for the ARO 12 m and the SMT data, respectively if the beam dilution effect is corrected for555According to the modelling by Woods et al. (2003), CRL 3068 (catalog ) has almost same CO envelope size as IRC+10216 (catalog ). If this is the case, the intensity ratios are not affected by the beam dilution effect.. CRL 3068 (catalog ) is about 8–10 times more distant than IRC+10216 (catalog ), and thus might intrinsically have a stronger average line intensity when the distance factor is taken into account.
Referring to Figure 5, if taking the average line intensity ratio as a reference, one can find that the emission from SiO, SiC2, SiS, CS, HCN, and their isotopologues seems to be depleted in CRL 3068 (catalog ) compared to those in IRC+10216 (catalog ), while HN13C, -C3H, HC3N, and CH3CN might be enhanced. The situation for other species is ambiguous. Although the classification is not very strict, it reflects that CRL 3068 (catalog ) has different chemical composition, excitation conditions, and optical depths with IRC+10216 (catalog ). A detailed discussion of the implication for circumstellar chemistry will be given in the following section.
Our results are in contrast to that presented in Woods et al. (2003), who found that for a sample of carbin-rich circumstellar envelops, the abundance discrepancies are typically less than a factor of five and the two objects, IRC+10216 (catalog ) and CRL 3068 (catalog ), are chemically similar. However, in CRL 3068 (catalog ), Woods et al. (2003) did not detect the species having the largest abundance discrepancies found here (e.g. SiO and -C3H). Recent studies of SiO and SiS in samples of carbon stars have been presented by Schöier et al. (2006) and Schöier et al. (2007), who derminated the molecular abundances through a detailed radiative transfer modelling of the SiO and SiS lines observed by them and some other authors. Their results suggest that the fractional abundances of SiO and SiS in carbon stars are in good agreement with each other. If the SiO and SiS abundances in CRL 3068 (catalog ) are similar to those in IRC+10216 (catalog ), our observations would suggest a significant enhancement of carbon chain molecules in CRL 3068 (catalog ), as shown in Figure 5. Nevertheless, we cannot completely rule out the possibility that the Si-bearing molecules in CRL 3068 (catalog ) are actually depleted.
5.3 Implication for circumstellar chemistry
The spectra of CRL 3068 (catalog ) are characterized by the wealth of C-bearing molecules. Among the newly detected species, only two are non-C-bearing molecules (SiO and SiS). From Figure 5, we can see that CRL 3068 (catalog ) has generally higher intensity ratios of C-bearing molecular lines to non-C-bearing ones compared to IRC+10216 (catalog ). This seems to lend support to the idea that CRL 3068 (catalog ) is more evolved and more carbon rich than IRC+10216 (catalog ).
It is intriguing that according to Figure 5 CRL 3068 (catalog ) shows enhancement of HN13C and depletion of H13CN compared to IRC+10216 (catalog ). Assuming that carbon isotope fractionation is insignificant for the two species and the HN13C/HNC abundance ratio is equal to the H13CN/HCN abundance ratio, we can infer that CRL 3068 (catalog ) has a higher HNC/HCN abundance ratio than IRC+10216 (catalog ). The HN13C (3–2)/H13CN (3–2) integrated intensity ratio in CRL 3068 (catalog ) is 0.05, about an factor of 13 larger than the value in IRC+10216 (catalog ) (see He et al., 2008). HCN and HNC can be produced through a similar way, i.e. dissociative recombination of HCNH+, and can convert to each other at certain physical conditions. At high temperature, HNC can be reprocessed into HCN through hydrogen exchange reaction. Hence, the higher HNC abundance in CRL 3068 (catalog ) might be related to its extreme cold environment. Furthermore, HNC can be destructed by atomic oxygen through the reaction
| (3) |
Therefore, the higher HNC/HCN abundance ratio probably reflects the extremely carbon-rich nature of CRL 3068 (catalog ). Schilke et al. (1992) suggest that the HNC/HCN abundance increases with increasing dust depletion factor because reaction (1) can be suppressed as a result of freeze-out of heavy elements onto dust grains. If this is the case, the extreme carbon star CRL 3068 (catalog ) may have a larger dust depletion factor than IRC+10216 (catalog ). Our observations also suggest that the column density ratio of HNC/HCN in CRL 3068 (catalog ) is about one order magnitude lower than that in PNs (Josselin & Bachiller, 2003). This is consistent with the observations of Herpin et al. (2002) who found that HNC is enhanced with respect to HCN at post-AGB stage due to certain chemical processes in the photodissociation region.
The chemical processes of CN are interconnected with those of HCN and HNC. CN can be produced through photodissociation of HCN or HNC. On the other hand, CN can be reprocessed into HCN or HNC through reaction with molecular hydrogen. Very efficient photodissociation has been found in the highly evolved AGB envelope CIT 6 (catalog ) (Zhang et al., 2009). In CRL 3068 (catalog ), we do not find evidence showing enhancement of CN. C2H and HC3N can be reprocessed by the same chemical precursor, C2H. The abundance ratio of the two species can provide a test for the chemical formation path (Wootten et al., 1980). We found that the abundance ratio (C2H)/(HC3N) in CRL 3068 (catalog ) is 7.7, lying within the range of 3–10 found by Wootten et al. (1980) in a wide variety of interstellar clouds and being consistent with gas-phase reaction scheme.
Among the most interesting finding in this study is the discovery of the cyclic molecule -C3H in CRL 3068 (catalog ). This follows the detection of another cyclic molecule C3H2 in this source by Wannier et al. (1991). We further note that HC3N and CH3CN seem to be slightly enhanced in CRL 3068 (catalog ). In the proto-planetary nebula CRL 618 (catalog ), cyanopolyynes chains are formed through the polymerization of HCN (Pardo et al., 2005). Our observations lead us to believe that CRL 3068 (catalog ) may be more evolved than IRC+10216 (catalog ) and cyclic and longer chain molecules are quickly being synthesized in its envelope. Since aromatic molecules emerge shortly after the end of the AGB (Kwok, 2004), the possible role that ring and chain molecules play in the synthesis of aromatic compounds is an important question in the study of circumstellar chemistry.
The interaction between stellar winds from AGB stars usually forms shock waves. Woods et al. (2003) have found that shocks alter the chemical compositions (e.g. CS and SiO) in the inner regions of some AGB envelopes. According to a non-equilibrium chemical model presented by Willacy & Cherchneff (1998), shocks can also strongly enhance SiO, which is a commonly observed species in carbon rich envelopes. However, we do not find enhancement of SiO in CRL 3068 (catalog ), probably suggesting that freeze out onto dust grains is significant in the extremely carbon rich envelope.
6 Summary and conclusions
In this molecular line survey toward the extreme carbon star CRL 3068 (catalog ) in the 1.3 mm and 2 mm windows, 72 molecular lines from 23 species were detected with three lines remain unidentified. The spectra are dominated by carbon-bearing molecules. The species -C3H, CH3CN, SiC2, C17O and C18O, HC15N, HN13C, C33S, C34S, 13CS, 29SiS, and 30SiS are detected for the first time in this object. From these observations, we have derived the chemical abundances and isotopic ratios of the molecular species. A comparison between these observations with the spectra of other AGB envelopes obtained previously using the same observations settings allows us to rigorously investigate the chemical processes in circumstellar envelopes. Compared to the archetypal carbon star IRC+10216 (catalog ), CRL 3068 (catalog ) is more carbon rich and shows an enhancement of -C3H and HN13C. The overall assessment is that CRL 3068 (catalog ) is a more evolved object on the AGB than IRC+10216. However, it should bear in mind that our conclusions are mainly based upon the comparison of relative line intensities which are assumed to directly correspond to the molecular abundances. To obtain more reliable absolute abundances and to make stronger statements about the chemical evolution in circumstellar envelops, interferometric observations and sophisticated treatments of radiative transfer processes are required.
This study is a part of a long-term project of investigating the evolution of circumstellar chemistry in the late stages of stellar evolution using the 2 mm and 1.3 mm spectra of a sample of AGB stars, PPNs, and PNs. Such a systematic study of the gas-phase molecules presents an important step to understand the synthesis of more complex aromatic and aliphatic compounds in evolved stars, and their role in the distribution of organic compounds throughout the Galaxy (Kwok, 2009). A detailed study of chemical processes in different physical conditions and evolutionary stages will be reported in the future.
References
- Avery et al. (1992) Avery, L. W. et al. 1992, ApJS, 83, 363
- Bachiller et al. (1997) Bachiller, R., Fente, A., Bujarrabal, V., Colomer, F., Loup, C., Omont, A., & de Jong, T. 1997, A&AS, 319, 235
- Boothroyd & Sackmann (1999) Boothroyd, A. I., & Sackmann, I.-J. 1999, ApJ, 510, 232
- Bujarrabal et al. (1994) Bujarrabal, V., Fuente, A., & Omont, A. 1994, A&A, 285, 247
- Busso (2006) Busso, M. M. 2006, in IAU Symp. 234, Planetary Nebulae, eds. M. J. Barlow, & R. H. Méndez (Cambridge: Cambridge University Press), p.91
- Cernicharo et al. (2000) Cernicharo, J., Guélin, M., & Kahane, C. 2000, A&AS, 142, 181
- Clément et al. (2003) Clément, D., Mutschke, H., Klein, R., & Henning, Th. 2003, ApJ, 594, 642
- Frost et al. (1998) Frost, C. A., Cannon, R. C., Lattanzio, J. C., Wood, P. R., & Forestini, M. 1998, A&A, 332, L17
- Fukasaku et al. (1994) Fukasaku, S. Hirahara, Y., Masuda, A. et al. 1994, ApJ, 437, 410
- Gérard & Le Bertre (2006) Gérard, E., & Le Bertre, T. 2006, AJ, 132, 2566
- Groenewegen et al. (1996) Groenewegen, M. A. T., Baas, F., de JONG, T., & Loup, C. 1996, A&A, 306, 241
- Habing & Olofsson (2003) Habing, H. J. & Olofsson, H., eds, 2003, Asymptotic Giant Branch Stars. Springer-Verlag, New York
- He et al. (2008) He, J.-H., Dinh-V-Trung, Kwok, S., Müller, H. S. P., Zhang, Y., Hasegawa, T., Peng, T. C., & Huang, Y. C. 2008, ApJS, 177, 275
- Herpin et al. (2002) Herpin, F., Goicoechea, J. R., & Cernicharo, J. 2002, ApJ, 577, 961
- Jewell & Snyder (1984) Jewell, P. R., & Snyder, L. E. 1984, ApJ, 278, 176
- Jones et al. (1978) Jones, B., Merrill, K. M., Puetter, R. C., & Willner, S. P. 1978, AJ, 83, 1437
- Josselin & Bachiller (2003) Josselin, E., & Bachiller, R. 2003, A&A, 397, 659
- Justtanont et al. (1998) Justtanont, K., Cami, J., Yamamura, I., de Jong, T., Waters, L. B. F. M. 1998, Ap&SS, 255, 351
- Kahane et al. (1992) Kahane, C., Cernicharo, J, Gómez-González, J., & Guélin, M. 1992, A&A, 256, 235
- Knapp & Morris (1985) Knapp, G. R., & Morris, M. 1985, ApJ, 292, 640
- Kwok (2004) Kwok, S. 2004, Nature, 430, 985
- Kwok (2006) Kwok, S. 2006, Physics and Chemistry of the Interstellar Medium, University Science Books
- Kwok (2009) Kwok, S. 2009, APSS, 319, 5
- Le Bertre et al. (1995) Le Bertre, T., Gougeon, S., & Le Sidaner, P. 1995, A&A, 299, 791
- Lebofsky & Rieke (1977) Lebofsky, M. J. & Rieke, G. H. 1977, AJ, 82, 646
- Lodders (2003) Lodders, K. 2003, ApJ, 591, 1220
- Mauron & Huggins (2006) Mauron, N., & Huggins, P. J. 2006, A&A, 452, 257
- Menzies et al. (2006) Menzies, J. W., Feast, M. W., & Whitelock, P. A. 2006, MNRAS, 369, 783
- Morris et al. (2006) Morris, M., Sahai, R., Matthews, K., Cheng, J., Lu, J., Claussen, M., & Sánchez-Contreras, C. 2006, in IAU Symp. 234 Planetary Nebulae, eds. M. J. Barlow, & R. H. Méndez (Cambridge: Cambridge University Press), p.469
- Müller et al. (2001) Müller, H. S. P., Thorwirth, S., Roth, D. A., & Winnewisser, G. 2001, A&A, 370, L49
- Müller et al. (2005) Müller, H. S. P., Schlöder, F., Stutzki, J., & Winnewisser, G. 2005, J. Mol. Struct., 742, 215
- Neri et al. (1998) Neri, R., Kahane, C., Lucas, R., Bujarrabal, V., & Loup, C. 1998, A&AS, 130, 1
- Nguyen-Quang-Rieu et al. (1988) Nguyen-Quang-Rieu, Deguchi, S., Izumiura, H., Kaifu, N., Ohishi, M., Suzuki, H., & Ukita, N. 1988, ApJ, 330, 374
- Nummelin et al. (1998) Nummelin, A., Bergman, P., Hjalmarson, A. et al. 1998, ApJS, 117, 427
- Nyman et al. (1992) Nyman, L.-Å., et al. 1992, A&AS, 93, 121
- Omont et al. (1993) Omont, A., Loup, C., Forveille, T., te Lintel Hekkert, P., Habing, H., &, Sivagnanam, P. 1993, A&A, 267, 515
- Olofsson (1996) Olofsson, H. 1996, in IAU Symp. 178, Molecules in Astrophysics: Probes & Processes, ed. E. van Dishoeck (Dordrecht: Kluwer), 457
- Pardo et al. (2005) Pardo, J. R., Cernicharo, J., & Goicoechea, J. R. 2005, ApJ, 628, 275
- Pardo et al. (2007) Pardo, J. R., Cernicharo, J., Goicoechea, J. R., Guélin, M., & Ramos, A. A. 2007, ApJ, 661, 250
- Pickett et al. (1998) Pickett, H. M., Poynter, R. L., Cohen, E. A., Delitsky, M. L., Pearson, J. C., & Muller, H. S. P. 1998, J. Quant. Spectrosc. & Rad. Transfer, 60, 883
- Schilke et al. (1992) Schilke, P., Walmsley, C. M., Pineau des Forêts, G., Roueff, E., Flower, D. R., & Guilloteau, S. 1992, A&A, 256, 595
- Schöier et al. (2007) Schöier, F. L. , Bast, J., Olofsson, H., & Lindqvist, M. 2007, A&A, 473, 871
- Schöier et al. (2006) Schöier, F. L., Olofsson, H., & Lundgren, A. A. 2006, A&A, 247, 255
- Schöier et al. (2002) Schöier, F. L., Ryde, N., & Olofsson, H. 2002, A&A, 391, 577
- Sopka et al. (1989) Sopka, R. J., Olofsson, H. J., Johansson, L. E. B., Nguyen-Q-Rieu, & Zuckerman, B. 1989, A&A, 210, 78
- Teyssier et al. (2006) Teyssier, D, , Hernandez, R., Bujarrabal, V., Yoshida, H., & Phillips, T. G. 2006, A&A, 450, 167
- Volk et al. (1992) Volk, K., Kwok, S., & Langill, P. P. 1992, ApJ, 391, 285
- Volk et al. (1993) Volk, K., Kwok, S., & Woodsworth, A. W. 1993, ApJ, 402, 292
- Willacy & Cherchneff (1998) Willacy, K., & Cherchneff, I. 1998, A&A, 330, 676
- Wannier & Sahai (1987) Wannier, P. G., & Sahai, R. 1987, ApJ, 319, 367
- Wannier et al. (1991) Wannier, P. G., Andersson, B.-G., Olofsson, H., Ukita, N., & Young, K. 1991, ApJ, 380, 593
- Winters et al. (1997) Winters, J. M., Fleischer, A. J., Le Bertre, T., & Sedlmayr, E. 1997, A&A, 326, 305
- Winters et al. (2002) Winters, J. M., Le Bertre, T., Nyman, L.-Å, Omont, A., & Jeong, K. S. 2002, A&A, 388, 609
- Woods et al. (2003) Woods, P. M., Schöier, F. L., Nyman, L.-Å, & Olofsson, H. 2003, A&A, 402, 617
- Wootten et al. (1980) Wootten, A., Bozyan, E. P., & Garrett, D. B. 1980, ApJ, 239, 844
- Yuasa et al. (1999) Yuasa, M., Unno, W., & Magono, S. 1999, PASJ, 51, 197
- Ziurys et al. (2007) Ziurys, L. M., Milam, S. N., Apponi, A. J., Woolf, N. J. 2007, Nature, 447, 1094
- Zhang et al. (2008) Zhang, Y., Kwok, S., & Dinh-V-Trung 2008, ApJ, 678, 328
- Zhang et al. (2009) Zhang, Y., Kwok, S., & Dinh-V-Trung 2009, ApJ, 691, 1660
- Zinner (1998) Zinner, E. 1998, Ann. Rev. Earth Planet. Sci., 26, 147
Appendix A Olofsson formula for molecular abundance
For the reader’s convenience, we deduce the formula presented by Olofsson (1996) for the calculation of molecular abundances respect to H2. The basic assumptions include: 1) all molecular emission originates from a spherical shell with inner radius and outer radius ; 2) the expansion velocity , the mass loss rate , and the excitation temperature are constant along the radius 3) the molecular abundance respect to H2 is homogeneous in the envelope.
For a Gaussian beam measuring a molecular line, the main beam temperature at a given velocity is obtained by
| (A1) |
where is the angular distance to the center, is the half-power beam width, and is the source brightness temperature at and . For a given volume element at a distance to the center of the envelope , we have
| (A2) |
where D is the distance between the antenna and the source and is the velocity along the line of sight. From the radiative transfer equation, the source brightnesss temperature is given by
| (A3) |
where is the optical depth. Substituting Equ. A2 and Equ. A3 into Equ. A1, we have
| (A4) |
where we have defined and thus .
Accroding to radiative transfer equation, is given by
| (A5) |
where is the weight of the upper level, the Einstein coefficient, the Planck constant, the Boltzman constant, the line frequency, the number density of the species, the partition function, the energy of lower level, and the path length element along the line of sight. From the relation , we have
| (A6) |
From Equs, A5 and A6, we obtain
| (A7) |
where
| (A8) |
The number density for a molecular species is given by
or
| (A9) |
where is the abundance relative to H2, is the mass of a hydrogen molecule, and is the mass loss rate for H2. Substituting Equs. A7–A9 into A4 and assuming , we obtain the molecular abundance relative to H2
| (A10) |
| Species | Transition | Frequencya | db | |||
|---|---|---|---|---|---|---|
| (MHz) | (upper–lower) | (mK) | (K) | (K km/s) | (km/s) | |
| CO | J=2–1 | 230538.0 | 4 | 1.893 | 35.942 | 17.7 |
| 13CO | J=2–1 | 220398.7 | 4 | 0.221 | 5.149 | 21.2 |
| C17O | J=2–1 | 224714.4 | 4 | 0.009 | 0.23: | … |
| C18O | J=2–1 | 219560.4 | 4 | 0.016 | 0.313 | 25.0 |
| CS | J=3–2 | 146969.0 | 11 | 0.143 | 2.658 | 18.4 |
| J=5–4 | 244935.6 | 4 | 0.201 | 3.821 | 17.3 | |
| C33S | J=5–4 | 242913.6 | 3 | 0.010 | 0.17: | … |
| C34S | J=5–4 | 241016.1 | 3 | 0.025 | 0.485 | 21.2 |
| 13CS | J=5–4 | 231221.0 | 4 | 0.013 | 0.325 | 33.5 |
| C2H | N=3–2 J=7/2–5/2 | 262005.3$ | 7 | 0.130 | 3.233 | 22.3 |
| N=3–2 J=5/2–3/2 | 262066.1 | 7 | 0.079 | 1.950 | 31.6 | |
| C4H | N=14–13 a | 133213.7 | 14 | 0.052 | 1.274 | … |
| N=14–13 b | 133252.1 | 14 | 0.035 | 1.100 | … | |
| N=15–14 a | 142728.8 | 11 | 0.030 | 0.452 | 27.2 | |
| N=15–14 b | 142767.3 | 11 | 0.029 | 0.553 | 27.3 | |
| N=16–15 a | 152243.6 | 9 | 0.026 | 0.459 | 23.3 | |
| N=16–15 b | 152282.1 | 9 | 0.029 | 0.508 | 27.7 | |
| N=17–16 a | 161758.1 | 8 | 0.036 | 0.715 | 20.8 | |
| N=17–16 b | 161796.6 | 8 | 0.041 | 0.716 | 22.2 | |
| N=24–23 a | 228348.6 | 4 | 0.010 | 0.26: | … | |
| N=24–23 b | 228387.0 | 4 | 0.009 | 0.32: | … | |
| -C3H | 5(1,4)–4(1,3) 11/2–9/2 | 252697.3 | 4 | 0.010 | 0.23: | … |
| 5(1,4)–4(1,3) 9/2–8/2 | 252881.0 | 4 | 0.010 | 0.31: | … | |
| CH3CN | JK=–111 | 220743.0* | 4 | 0.014 | 0.291 | 13.2 |
| JK=–110 | 220747.2* | 4 | — | — | — | |
| JK=– | 257507.6* | 4 | 0.015 | 0.264 | 26.0 | |
| JK=– | 257522.4* | 4 | — | — | — | |
| JK=– | 257527.4* | 4 | — | — | — | |
| CN | N(J,F)=2(3/2,1/2)–1(3/2,1/2) | 226287.4* | 4 | 0.010 | 0.20: | … |
| N(J,F)=2(3/2,1/2)–1(3/2,3/2) | 226298.9* | 4 | — | — | — | |
| N(J,F)=2(3/2,3/2)–1(3/2,1/2) | 226303.0* | 4 | — | — | — | |
| N(J,F)=2(3/2,3/2)–1(3/2,3/2) | 226314.5* | 4 | — | — | — | |
| N(J,F)=2(3/2,3/2)–1(3/2,5/2) | 226332.5* | 4 | 0.015 | 0.594 | 22.5 | |
| N(J,F)=2(3/2,5/2)–1(3/2,3/2) | 226341.9* | 4 | — | — | — | |
| N(J,F)=2(3/2,5/2)–1(3/2,5/2) | 226359.9* | 4 | — | — | — | |
| N(J,F)=2(3/2,1/2)–1(1/2,3/2) | 226616.6* | 4 | 0.016 | 0.405 | 23.8 | |
| N(J,F)=2(3/2,3/2)–1(1/2,3/2) | 226632.2* | 4 | — | — | — | |
| N(J,F)=2(3/2,5/2)–1(1/2,3/2) | 226659.6* | 4 | 0.036 | 1.049 | 21.8 | |
| N(J,F)=2(3/2,1/2)–1(1/2,1/2) | 226663.7* | 4 | — | — | — | |
| N(J,F)=2(3/2,3/2)–1(1/2,1/2) | 226679.3* | 4 | — | — | — | |
| N(J,F)=2(5/2,5/2)–1(3/2,3/2) | 226874.2* | 4 | 0.088 | 2.399 | 21.9 | |
| N(J,F)=2(5/2,7/2)–1(3/2,5/2) | 226874.8* | 4 | — | — | — | |
| N(J,F)=2(5/2,3/2)–1(3/2,1/2) | 226875.9* | 4 | — | — | — | |
| N(J,F)=2(5/2,3/2)–1(3/2,3/2) | 226887.4* | 4 | — | — | — | |
| N(J,F)=2(5/2,5/2)–1(3/2,5/2) | 226892.1* | 4 | — | — | — | |
| N(J,F)=2(5/2,3/2)–1(3/2,5/2) | 226905.4* | 4 | — | — | — | |
| HCN | J=3–2 | 265886.4 | 7 | 0.831 | 14.315 | 15.8 |
| =11e J=3–2 | 265852.8 | 7 | 0.034 | 0.401 | 11.5 | |
| =20 J=3–2 | 267243.2 | 7 | 0.036 | 0.231 | 14.5 | |
| HC15N | J=3–2 | 258154.7 | 4 | 0.014 | 0.233 | 22.3 |
| H13CN | J=3–2 | 259011.8 | 5 | 0.495 | 8.582 | 15.8 |
| HN13C | J=3–2 | 261263.4 | 7 | 0.021 | 0.445 | 23.7 |
| HC3N | J=15–14 | 136464.4 | 11 | 0.082 | 1.787 | 21.4 |
| J=16–15 | 145560.9 | 10 | 0.053 | 0.953 | 21.4 | |
| J=17–16 | 154657.3 | 9 | 0.020 | 0.45: | … | |
| J=18–17 | 163753.4 | 10 | 0.075 | 1.611 | 21.8 | |
| J=25–24 | 227418.9 | 4 | 0.027 | 0.530 | 20.5 | |
| J=26–25 | 236512.8 | 6 | 0.031 | 0.672 | 25.3 | |
| J=27–26 | 245606.3 | 4 | 0.031 | 0.541 | 21.3 | |
| J=28–27 | 254699.5 | 5 | 0.021 | 0.485 | 19.3 | |
| J=29–28 | 263792.3 | 6 | 0.021 | 0.310 | 26: | |
| SiC2 | 60,6–50,5 | 137180.8 | 10 | 0.022 | 0.424 | 21: |
| 62,5–52,4 | 140920.1 | 9 | 0.025 | 0.483 | 20: | |
| 62,4–52,3 | 145325.8 | 9 | 0.029 | 0.560 | 20.6 | |
| 70,7–60,6 | 158499.2 | 7 | 0.033 | 0.617 | 25.0 | |
| 100,10–90,9 | 220773.7 | 4 | 0.019 | 0.380 | 18.3 | |
| 92,7–82,6 | 222009.4 | 5 | 0.022 | 0.400 | 29.0 | |
| 102,9–92,8 | 232534.1 | 4 | 0.018 | 0.411 | 29.7 | |
| 108,2–98,1 | 234534.0* | 6 | 0.012 | 0.222 | 29.3 | |
| 108,3–98,2 | 234534.0* | 6 | — | — | — | |
| 106,5–96,4 | 235713.0* | 5 | 0.024 | 0.415 | 15: | |
| 106,4–96,3 | 235713.1* | 5 | — | — | — | |
| 104,7–94,6 | 237150.0 | 5 | 0.019 | 0.417 | 30: | |
| 104,6–94,5 | 237331.3 | 5 | 0.024 | 0.35: | 15: | |
| 110,11–100,10 | 241367.7 | 3 | 0.020 | 0.439 | 18.6 | |
| 102,8–92,7 | 247529.1 | 5 | 0.022 | 0.544 | 22.8 | |
| 112,10–102,9 | 254981.5 | 5 | 0.030 | 0.466 | 28: | |
| 118,3–108,2 | 258065.0* | 4 | 0.014 | 0.189 | 16.2 | |
| 118,4–108,3 | 258065.0* | 4 | — | — | — | |
| 116,6–106,5 | 259433.3* | 5 | 0.019 | 0.502 | 23.0 | |
| 116,5–106,4 | 259433.3* | 5 | — | — | — | |
| 114,8–104,7 | 261150.7 | 7 | 0.016 | 0.33: | … | |
| 114,7–104,6 | 261509.3 | 7 | 0.015 | 0.28: | 22.4 | |
| 120,12–110,11 | 261990.7$ | 7 | 0.130 | 3.233 | 22.3 | |
| SiO | J=3–2 | 130268.6 | 12 | 0.026 | 0.976 | 22.1 |
| J=6–5 | 260518.0 | 7 | 0.034 | 0.537 | 15.7 | |
| SiS | J=8–7 | 145227.0 | 9 | 0.078 | 1.517 | 20.3 |
| J=9–8 | 163376.7 | 10 | 0.119 | 2.127 | 19.5 | |
| J=13–12 | 235961.1 | 6 | 0.101 | 2.188 | 18.8 | |
| J=14–13 | 254102.9 | 5 | 0.121 | 2.265 | 18.4 | |
| 29SiS | J=13–12 | 231626.7 | 4 | 0.013 | 0.243 | 30: |
| 30SiS | J=9–8 | 157579.7 | 9 | 0.025 | 0.44: | … |
| J=15–14 | 262585.0 | 7 | 0.021 | 0.101 | 19.4 | |
| U | 245982.0 | 5 | 0.017 | 0.605 | 14.7 | |
| 255108.0 | 5 | 0.041 | 0.817 | 16.0 | ||
| 264067.0 | 5 | 0.016 | 0.175 | 13.9 |
| Species | (K)b | (cm-2) | ||||
|---|---|---|---|---|---|---|
| This paperc | F94d | This paperc | W03d | |||
| CO | 6.20(16) | 1.5(-4) | ||||
| 13CO | 1.17(16) | 2.7(-5) | ||||
| C17O | 5.58(14): | 1.2(-6): | ||||
| C18O | 7.66(14) | 1.7(-6) | ||||
| CS | 3.24(13) | 5.8(-8) | 3.7(-7) | |||
| C33S | 1.38(12): | 2.7(-9): | ||||
| C34S | 3.95(12) | 7.8(-9) | ||||
| 13CS | 2.91(12) | 5.9(-9) | ||||
| C2H | 1.82(14) | (14) | 2.7(-7) | 5.7(-6) | ||
| C4H | 3.52(14) | 7.0(14) | 6.5(-7) | |||
| -C3H | 1.78(13): | 3.6(-8): | ||||
| CH3CN | 5.77(12) | 8.1(-8) | (-7) | |||
| CN | 1.93(14) | 3.9(-7) | 4.6(-7) | |||
| HCN | 4.17(13) | 6.0(14) | 4.5(-8) | 6.3(-6) | ||
| HC15N | 5.49(11) | 1.0(-9) | ||||
| H13CN | 2.01(13) | 3.7(-8) | 3.0(-8) | |||
| HN13C | 1.26(12) | 2.3(-9) | (-8) | |||
| HC3N | 1.78(13) | (14) | 3.5(-8) | 5.0(-7) | ||
| SiC2 | 3.49(13) | 3.8(-8) | (8) | |||
| SiO | 1.64(12) | 3.0(-9) | ||||
| SiS | 5.69(13) | (13) | 1.5(-7) | 6.7(-7) | ||
| 29SiS | 6.38(12) | 1.3(-8) | ||||
| 30SiS | 2.83(12) | 5.2(-9) | ||||
| Isotopic ratio | CRL 3068 | CIT 6a | IRC+10216b | Solarc | |
|---|---|---|---|---|---|
| Sepcies | Value | ||||
| 12C/13C | 12C34S/13C32S | 29.7d | 45.4 | 45 | 89 |
| 12CO/13CO | 5.6e | ||||
| 12CS/13CS | 9.8e | ||||
| H12CN/H13CN | 1.2e | ||||
| 14N/15N | H13C14N/H12C15N | 1099f | 272 | ||
| HC14N/HC15N | 45e | ||||
| 16O/17O | 13C16O/12C17O | 668:f | 890 | 967 | 2680 |
| C16O/C17O | 125:e | ||||
| 16O/18O | 13C16O/12C18O | 472f | 1172 | 499 | |
| C16O/C18O | 88e | ||||
| 17O/18O | C17O/C18O | 0.7: | 1.14 | 0.2 | |
| 32S/34S | C32S/C34S | 7.4e | 6.7e | 18.9 | 22.5 |
| 33S/34S | C33S/C34S | 0.3: | 0.2: | 0.19 | 0.18 |
| 29Si/30Si | 29SiS/30SiS | 2.5 | 1.0 | 1.46 | 1.52 |
| 28Si/30Si | 28SiS/30SiS | 28.8 | 8.8e | 24.7 | 29.9 |
| 28Si/29Si | 28SiS/29SiS | 11.5 | 8.9e | 17.2 | 19.6 |