An optical and X-ray study of the fossil group RX J1340.6+4018 ††thanks: Based on observations obtained at the Gemini Observatory, which is operated by the Association of Universities for Research in Astronomy, Inc., under a cooperative agreement with the NSF on behalf of the Gemini partnership: the National Science Foundation (United States), the Particle Physics and Astronomy Research Council (United Kingdom), the National Research Council (Canada), CONICYT (Chile), the Australian Research Council (Australia), CNPq (Brazil) and CONICET (Argentina) – Observing run ID: GN-2006B-Q-38.
Abstract
Fossil groups are systems with one single central elliptical galaxy and an unusual lack of luminous galaxies in the inner regions. The standard explanation for the formation of these systems suggests that the lack of bright galaxies is due to galactic cannibalism. In this study we show the results of an optical and X-ray analysis of RX J1340.6+4018, the prototype fossil group. The data indicates that RX J1340.6+4018 is similar to clusters in almost every sense, dynamical mass, X-ray luminosity, M/L and luminosity function, except for the lack of L* galaxies.
There are claims in the literature that fossil systems have a lack of small mass haloes, compared to predictions based on the LCDM scenario. The observational data gathered on this and other fossil groups so far offer no support to this idea.
Analysis of the SN Ia/SN II ejecta ratio in the inner and outer regions shows a marginally significant central dominance of SN Ia material. This suggests that either the merger which originated the central galaxy was dry or the group has been formed at early epochs, although better data are needed to confirm this result.
1 Introduction
Fossil groups (FGs) are bright and extended X-ray emission systems (LX,bol 1042 h ergs ) dominated by a single giant elliptical galaxy and with at least a two-magnitude difference between the first and second-ranked galaxies (in the R-band) within half of its virial radius. Initially, FGs were thought to be the cannibalistic remains of small galaxy groups that lost energy through tidal friction, perhaps the final stage of compact groups (e.g. Barnes 1989, Ponman and Bertram 1993, Jones et al. 2003). More recently, X-ray measurements of FGs were shown to be inconsistent with this formation mechanism, in particular because the intergalactic medium of a number of FGs is similar to those of galaxy clusters, with temperatures sometimes in excess of 4 keV (e.g. Khosroshahi et al. 2006; Khosroshahi et al 2007) and, thus, FGs have high gravitational masses compared with most nearby groups. As an example, one of the most massive Hickson compact groups known, HCG 62, is an order of magnitude less massive than the typical FGs studied so far (Mendes de Oliveira & Carrasco 2007).
The high masses of FGs estimated in X-rays were confirmed by the dynamical studies of these systems. Recent measurements of galaxy velocity dispersions in FGs (Mendes de Oliveira et al. 2006; Cypriano et al. 2006; Khosroshahi et al 2007) are fully consistent with the dynamical state of the system as determined from X-ray observations, indicating that they have relatively deep gravitational potential wells, typical of clusters.
The lack of L* galaxies in the central regions in a cluster-sized potential was quite intriguing at first and motivated a number of studies. D’Onghia et al. (2005) and Dariush et al. (2007) suggested that these systems are older than clusters of comparable masses. von Benda-Beckmann et al. (2008), from the analysis of the magnitude gap between the brightest and the second most bright group member in a cosmological simulation, also suggest that fossil groups are old structures and point out that they are a transitory phase in the life of group which ends with the infall of new galaxies from the neighborhood. Díaz-Giménez et al. (2008) analyzed FGs in the Millennium simulation (Springel et al. 2005) and in a mock catalogue and concluded that although FGs have assembled early, first-ranked galaxies in FGs only formed their magnitude gaps and their luminous galaxies quite recently.
The most likely mechanism proposed for the lack of luminous galaxies surrounding the central dominant galaxy is cannibalism (e.g. Jones et al. 2003). The central merging, if not completely “dry” (i.e. involving gas-poor galaxies), should be accompanied by star formation bursts, causing subsequent metal rich SN II-driven galactic winds or superwinds (e.g. Sanders & Mirabel 1996). These secular winds would deposit metals and energy into the central gas and this extra energy may contribute to explain the typical lack of cooling cores in FGs (Sun et al. 2004; Khosroshahi et al 2004, 2007). The wind metal injection would make the central SN Ia/SN II ejecta of FGs different (lower) from that of normal groups and similar sized clusters. This scenario can, in principle, be tested by measuring individual elemental abundances and their ratios with sufficiently high S/N X-ray data (Dupke, Mendes de Oliveira & Sodré 2009).
Based on the luminosity function of the fossil group RX J1340.6+4018 published by Jones et al. (2000) and on the conclusion that RX J1340.6+4018 lived in a sparse environment (Ponman et al. 1994), D’Onghia & Lake (2004) claimed that FGs may pose a severe problem for the cold dark matter models, since they did not have as much substructure as expected for such massive systems. On the other hand, Sales et al. (2007) using the millennium simulation found that the luminosity functions of three FGs, including RX J1340.6+4018, are not inconsistent with CDM predictions, although the authors stress that the current sample of FGs with reliable luminosity functions is still poor. Reinforcing this idea, Zibetti et al. (2009), who recently estimated the substructure function from photometric data for six fossil systems (also including RX J1340.6+4018), finds that these systems are consistent with normal clusters and with numerical simulations as well. New measurements and improvements in the determination of luminosity functions for these systems is of paramount importance to determine their origin. Here, we revise the luminosity function of the system RX J1340.6+4018, which is considered the prototype fossil group (Ponman et al. 1994).
In Section 2 we describe the optical and X-ray data we used in this work. In Section 3 we present the results we obtain using the optical data. In Section 4 the results obtained from the X-ray data are presented as well as the result of a test for the formation scenario of galaxies through cannibalism of L* galaxies. Section 5 summarizes and discusses our findings. Throughout this paper, we adopt, unless explicitly mentioned otherwise, a cosmology with km s-1 Mpc-1, and , so that 12.9 kpc at the cluster distance (, see Section 3.1).
2 Observations and Data Reduction
The imaging and multi-slit spectroscopic observations of the group RX J1340.6+4018 were done with the GMOS instrument, mounted on the Gemini North telescope, on May 2nd and June 22nd, in 2006, respectively (see sections 2.1 and 2.2 below). The X-ray study was based on archival Chandra data, as described in section 2.3.
2.1 Optical Imaging
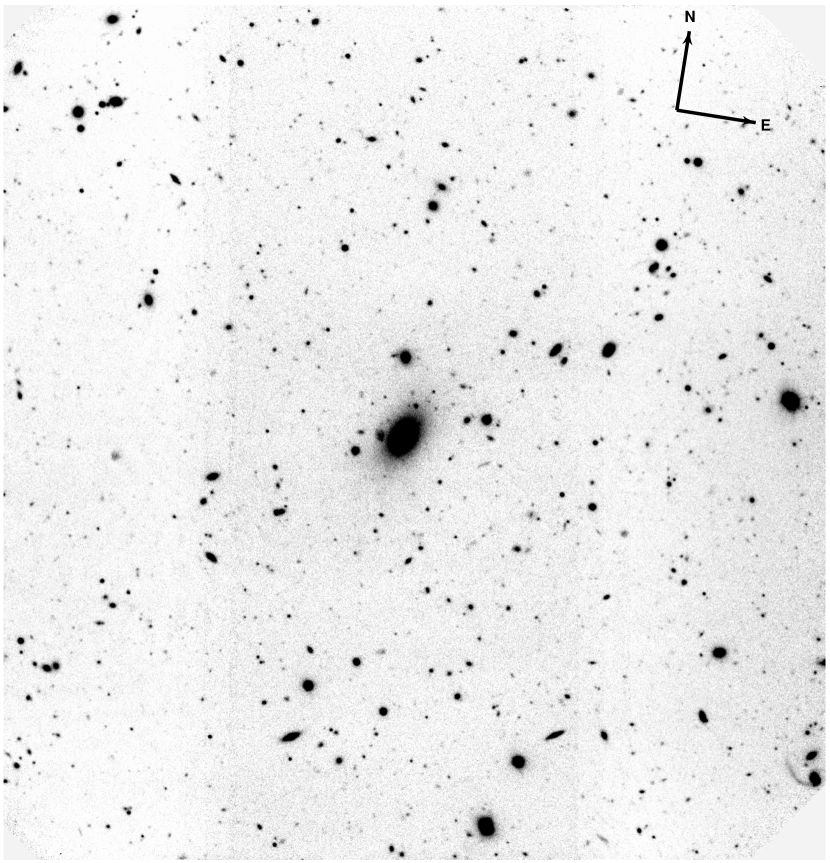
The imaging consisted of s exposures in each of the two filters from the SDSS system (Fukugita et al. 1996) g′ and i′. The typical FWHM for point sources was 0.75” in all images. All observations were performed in photometric conditions. Fig. 1 displays the i′ image of the system.
The calibration to the standard SDSS system was made using calibration stars observed about one month before the FG observations. No calibration stars were taken in the night of the FG observations, given that the telescope dome had to be closed due to strong winds shortly after the object observation. We confirmed the goodness of the i′-band zero point obtained from the calibration stars by comparing magnitudes measured by us with those from the SDSS database, for 20 galaxies in common, in the magnitude range i=18-20, finding no systematic difference. All observations were processed in a standard way with the Gemini IRAF111IRAF is distributed by NOAO, which is operated by the Association of Universities for Research in Astronomy Inc., under contract with the National Science Foundation package v1.8.
Positions and magnitudes (isophotal and aperture) were obtained for all objects. We estimate that the galaxy catalog is essentially complete down to 24.25 i′ magnitude (the peak of the number-count histogram). The SExtractor stellarity index (Bertin and Arnouts 1996) was used to separate stars from galaxies. All objects with stellarity index were selected as galaxies.
2.2 Optical Spectroscopy
Galaxies for spectroscopic follow-up were selected based on their magnitudes and colors. Figure 2 shows the color-magnitude diagrams for galaxies with mag. Objects in the region within and bluer than the red cluster sequence and brighter than mag (, vertical line in Figure 2) were selected as potential candidates. Galaxies above the red sequence are expected to be in the background, since their colors are redder than the expected colors of elliptical galaxies at the group redshift. The outermost galaxy, which turned out to be a member of the group/cluster, has a distance of 516 h kpc from the X-ray center of RX J1340.6+4018 (which coincides very well with the central galaxy).
Four multi-slit exposures of 2400 seconds each was obtained through a mask with 1.0″ slits, using the R400 grating, for a final resolution of 7-8 Å (as measured from the FWHM of the arc lines), covering approximately the range 4000 – 8000 Å (depending on the position of each slitlet).
Standard procedures were used to reduce the multi-slit spectra using tasks within the Gemini IRAF package. Wavelength calibration was done using Cu-Ar comparison-lamp exposures before and after the exposures.
Redshifts for galaxies with absorption lines were determined using the cross-correlation technique (Tonry & Davis 1979) as implemented in the package RVSAO (Kurtz & Mink 1998) running under IRAF. The final heliocentric velocities of the galaxies were obtained by cross-correlation with several template spectra. The final errors on the velocities were determined from the dispersion in the velocity estimates using several different galaxy and star templates. In the case of emission-line redshifts, errors were estimated from the dispersions in redshifts obtained using different emission lines. The S/N of the data, measured in the continuum region 6400–6500Å, ranged from 10 to 32.
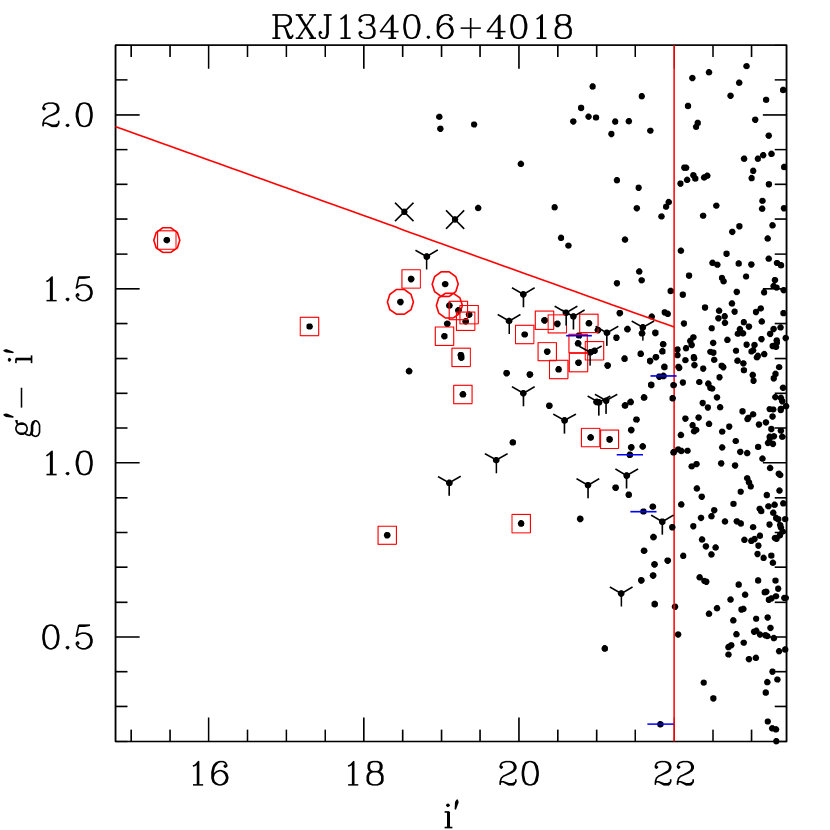
Table 1 lists positions, isophotal magnitudes, aperture (g’ - i’) colors, radial velocities with errors and the Tonry & Davis cross-correlation coefficient R for all galaxies with reliable velocity determinations obtained in this study.
| (1) | (2) | (3) | (4) | (5) | (6) | (7) |
|---|---|---|---|---|---|---|
| Name aaThe names of the galaxies are based on their 2000 celestial coordinates (RA seconds and DEC minutes and seconds). Thus galaxy Gab.c+defg is located at 13 40 ab.c +40 de fg. | RA (2000) | DEC (2000) | i′ (AB Mag.) | g′-i′ | (km s-1) | R |
| G29.2+1704 | 13 40 29.2 | 40 17 04 | 20.98 | 1.32 | 4.1 | |
| G18.3+1830 | 13 40 18.3 | 40 18 30 | 19.26 | 1.30 | 7.0 | |
| G30.7+1539 | 13 40 30.7 | 40 15 39 | 18.61 | 1.53 | 7.2 ccSpectra with emission lines but with redshift measured from absorption lines. | |
| G26.4+1811 | 13 40 26.4 | 40 18 11 | 20.76 | 1.34 | 2.6 | |
| G35.9+1826 | 13 40 35.9 | 40 18 26 | 20.33 | 1.41 | 5.0 | |
| G44.2+1902 | 13 40 44.2 | 40 19 02 | 20.36 | 1.32 | 3.0 | |
| G23.6+1817 | 13 40 23.6 | 40 18 17 | 19.31 | 1.41 | 4.6 | |
| G32.5+1612 | 13 40 32.5 | 40 16 12 | 19.36 | 1.43 | 6.0 | |
| G44.5+1637 | 13 40 44.5 | 40 16 37 | 19.04 | 1.36 | 3.0 | |
| G32.4+1533 | 13 40 32.4 | 40 15 33 | 20.77 | 1.29 | 5.6 | |
| G32.6+1910 | 13 40 32.6 | 40 19 10 | 19.22 | 1.44 | 7.8 | |
| G32.8+1740 | 13 40 32.8 | 40 17 40 | 15.46 | 1.60 | 8.9 | |
| G36.5+1843 | 13 40 36.5 | 40 18 43 | 20.50 | 1.40 | 4.0 | |
| G33.1+1753 | 13 40 33.1 | 40 17 53 | 20.90 | 1.40 | 2.4 | |
| G32.7+1934 | 13 40 32.7 | 40 19 34 | 20.92 | 1.07 | 3.0 | |
| G41.1+1558 | 13 40 41.1 | 40 15 58 | 20.07 | 1.37 | 6.2 | |
| G36.0+1604 | 13 40 36.0 | 40 16 04 | 20.51 | 1.27 | 5.9 | |
| G37.6+1517 | 13 40 37.6 | 40 15 17 | 17.30 | 1.39 | 7.2 | |
| G44.3+1612 | 13 40 44.3 | 40 16 12 | 19.28 | 1.20 | bbRedshift measured from emission lines. | |
| G40.4+1651 | 13 40 40.4 | 40 16 51 | 21.17 | 1.07 | bbRedshift measured from emission lines. | |
| G20.4+1918 | 13 40 20.4 | 40 19 18 | 20.03 | 0.83 | 6.8 ccSpectra with emission lines but with redshift measured from absorption lines. | |
| G20.3+1924 | 13 40 20.3 | 40 19 24 | 18.30 | 0.79 | 8.1 ccSpectra with emission lines but with redshift measured from absorption lines. | |
| G24.0+1618 | 13 40 24.0 | 40 16 18 | 20.92 | 1.32 | 2.7 | |
| G23.9+1904 | 13 40 23.9 | 40 19 04 | 20.06 | 1.48 | 6.6 | |
| G24.8+1953 | 13 40 24.8 | 40 19 53 | 20.89 | 0.93 | bbRedshift measured from emission lines. | |
| G40.4+1909 | 13 40 40.4 | 40 19 09 | 18.81 | 1.59 | 4.5 | |
| G18.3+1936 | 13 40 18.3 | 40 19 36 | 21.85 | 0.83 | bbRedshift measured from emission lines. | |
| G27.1+1642 | 13 40 27.1 | 40 16 42 | 19.71 | 1.01 | 6.7 ccSpectra with emission lines but with redshift measured from absorption lines. | |
| G21.5+1930 | 13 40 21.5 | 40 19 30 | 19.11 | 0.94 | 4.5 ccSpectra with emission lines but with redshift measured from absorption lines. | |
| G40.8+1841 | 13 40 40.8 | 40 18 41 | 20.06 | 1.20 | bbRedshift measured from emission lines. | |
| G34.4+1906 | 13 40 34.4 | 40 19 06 | 21.32 | 0.62 | bbRedshift measured from emission lines. | |
| G40.3+1900 | 13 40 40.3 | 40 19 00 | 19.87 | 1.41 | bbRedshift measured from emission lines. | |
| G19.5+1700 | 13 40 19.5 | 40 17 00 | 21.12 | 1.18 | bbRedshift measured from emission lines. | |
| G42.5+1705 | 13 40 42.5 | 40 17 05 | 21.60 | 1.39 | bbRedshift measured from emission lines. | |
| G21.8+1959 | 13 40 21.8 | 40 19 59 | 21.39 | 0.96 | bbRedshift measured from emission lines. | |
| G27.7+2013 | 13 40 27.7 | 40 20 13 | 20.59 | 1.12 | bbRedshift measured from emission lines. | |
| G19.9+1732 | 13 40 19.9 | 40 17 32 | 21.13 | 1.37 | bbRedshift measured from emission lines. | |
| G43.0+1701 | 13 40 43.0 | 40 17 01 | 21.03 | 1.17 | bbRedshift measured from emission lines. | |
| G26.6+1703 | 13 40 26.6 | 40 17 03 | 20.70 | 1.42 | bbRedshift measured from emission lines. | |
| G37.8+1818 | 13 40 37.8 | 40 18 18 | 20.61 | 1.43 | bbRedshift measured from emission lines. |
2.3 X-rays
We analized Chandra archived data of the fossil group RX J1340.6+4018 in order to obtain its temperature and attempt a measurement of elemental abundance ratios. This system was observed by Chandra ACIS-S3 in Aug 2002 for 47.6 ksec. The cluster was centered on the S3 chip. The Ciao 3.3.0.1 with CALDB 3.2.4 was used, to screen the data. After correcting for a short flare-like period the resulting exposure time in our analysis was 46.3 ksec. A gain map correction was applied together with PHA and pixel randomization. ACIS particle background was cleaned as prescribed for VFAINT mode. Point sources were extracted and the background used in spectral fits was generated from blank-sky observations using the acis_bkgrnd_lookup script.
Here we show the results of spectral fittings with XSPEC V11.3.1 (Arnaud 1996) using the APEC and VAPEC thermal emission models. Metal abundances are measured relative to the solar photospheric values of Anders & Grevesse (1989). Galactic photoelectric absorption was incorporated using the WABS model (Morrison & McCammon 1983). Spectral channels were grouped to have at least 20 counts/channel. Energy ranges were restricted to 0.5–8.0 keV. The spectral fitting errors are at the 1- confidence level, unless stated otherwise. Given that individual abundances require a higher S/N than that observed in the outer regions, we tied Oxygen and Neon together since they have similar range of yield variation for SN Ia and II. Argon and Calcium are not well constrained and were also tied together in the spectral fittings. Fits with these elements untied did not produce significantly different results. For mass yields of SN Ia and SN II, we use the values of Nomoto et al. (1997a,b). SN II yields were calculated integrating over a Salpeter IMF for a progenitor mass range of 10 to 50 M⊙.
3 Optical Properties of RX J1340.6+4018
3.1 Galaxy velocity distribution
Using the heliocentric radial velocities listed in Table 1, we consider as members of RX J1340.6+4018 the 22 galaxies with velocities between 50378 and 52451 km s-1 (out of which only 5 have emission lines). The data were analyzed with the statistical software rostat (Beers, Flynn & Gebhartd 1990), which did not find any large gap in the velocity distribution. In addition, no other data-points were found outside a range. Fig. 3 shows the velocity histogram for the 22 member galaxies studied by us.

Using the robust bi-weighted estimator of rostat, the following values for the systemic redshift and velocity dispersion were found: and km s-1, respectively. It is in contrast with the earlier result of Khosroshahi et al (2007) of determined for only four galaxies, although not inconsistent, all uncertainties considered. If we characterize the virial radius by the radius within which the interior density is 200 times the critical density (r200), the measured projected velocity dispersion implies a virial radius of r (Carlberg et al. 1997). The errors are due only to the velocity dispersion determination and do not include the uncertainties implicit in the cited equation (such as departures from a profile at large radii). This value is somewhat higher than that estimated from X-rays (see section 4), which can be given, as defined in Evrard, et al. (1996), by r.
If the optically derived virial radius estimate is taken at face value, it would imply that RX J1340.6+4018 could not be classified “strictly“ as a fossil group (in the Jones et al. definition) given that there is one galaxy, G37.6+1517, which is 1.8 magnitudes fainter than the brightest group galaxy in the i’ band (1.6 in g’), and which is located at a clustercentric radius of 480 kpc. We note that Santos et al. (2007) has also pointed out that RX J1340.6+4018 did not follow the strict definition of a fossil group.
We determine the dynamical mass of the system by using four different mass estimators, as suggested by Heisler et al. (1985): virial, projected, average and median mass estimators (see results in Table 2). The adopted center of mass of the system was the brightest cluster galaxy. The errors were calculated by using 1000 bootstrap simulations. Note that the dispersion between the mass values obtained using the several different methods is small compared to the errors in a single measurement. The average of the mass given by the four estimators is M. We recall that all values are calculated within a radius of 516 h kpc ( 40% of the virial radius of the system).
| (1) | (2) | (3) | |
|---|---|---|---|
| Estimator | Mass ( M⊙) | M/L (M⊙/L) | |
| Virial | 330 | ||
| Projected | 443 | ||
| Average | 316 | ||
| Median | 297 | ||
| Mean value | 3.40 | 347 |
3.2 The Luminosity Function and Mass-to-Light Ratios
We show in Fig. 4 the luminosity function of RX J1340.6+4018 (solid circles) for galaxies with spectroscopically confirmed membership either obtained in this paper (22 galaxies) or given by Jones et al. (2003, three galaxies plus the central one; for the latter we also have a spectrum), corrected for incompleteness. The absolute magnitudes were calculated after correcting the observed magnitudes for Galactic extinction and applying -corrections. The selection function (number of galaxies with reliable redshifts over the total number of galaxies in a given magnitude bin), also shown in Fig. 4, was calculated considering only galaxies bluer than the upper limit of the adopted red cluster sequence.
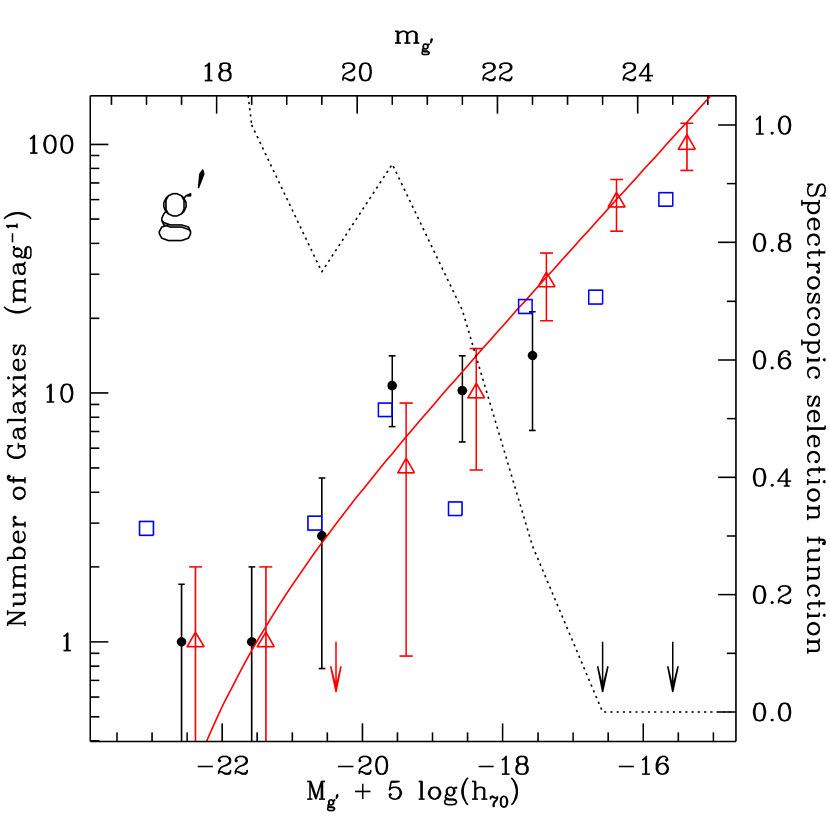
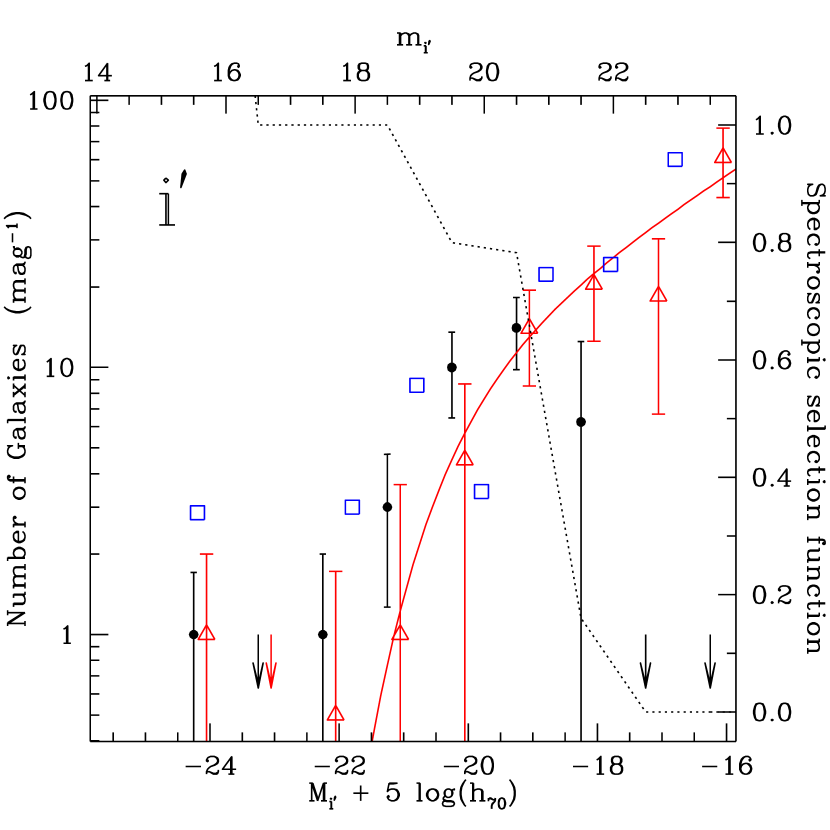
We have estimated the photometric luminosity function of RX J1340.6+4018 down to the completeness level of our photometric data (g′ = 24.5 and i′ = 23.5 mag) by adopting the procedure described in our previous papers (Mendes de Oliveira et al. 2006; Cypriano et al. 2006), where the control fields used for the background subtraction are the ones from Boris et al. (2007). The photometric luminosity functions are shown in Fig. 4 as open triangles. They go deeper than the spectroscopic results (solid circles) and they suggest that the number of galaxies keeps increasing at faint magnitudes. It is important to note that, at bright magnitudes, there is no important discrepancy between the luminosity functions calculated using both methods.
In Figure 4 we also overplotted the data from Jones et al. (2000, R 400 h kpcR 400 h kpc) for the sake of comparison. For that we adopted the colours g′-R=0.90 and R-i′=0.54, which implies an overall g′-i′ colour of 1.44, which is consistent with our data (see Figure 2 and with the colours of an Sab galaxy at the redshift of 0.17 (Fukugita et al. 1995). By inspection of Figure 4 one can see that Jones et al. and our data sets are consistent with each other, although ours seem to be less noisy, probably due to the use of colours to aid on the background subtraction.
The shape of the luminosity function is very similar in the g’ and i’-band diagrams. The faint end of the luminosity function is steeply rising up to our completeness limit. The shape of the photometric luminosity function in the i’-band, when fit to a Schechter function in the interval , is well described by such a function with the following parameters: M and . For the g’-band, the photometric luminosity function is fit in the interval , and the best fit to a Schechter function is given by the following parameters: M and . Lines indicating the best Schechter luminosity functions fitted are plotted in Fig. 4.
We integrated the best fit Schechter function on the band to obtain the total luminosity of the group, assuming that the magnitude of the Sun in the -band is M = 5.11 mag 111Calculated by C. Willmer using the solar spectra: www.ucolick.org/cnaw/sun.html. We then added the luminosity of the central galaxy, since this galaxy is not taken into account when fitting the luminosity function. The final result is 9.8 1011 L⊙ on the band, where the central galaxy alone is responsible for almost 80% of the entire cluster luminosity budget. This leads to a mass-to-light ratio of 347 M⊙/L (using the mean value for the masses obtained with the four estimators, M⊙ - see Table 2). Results for the mass-to-light ratio, inside a radius of 516 h kpc ( 40% r200), using different mass estimators, are presented in Table 2.
3.3 Surface photometry of the BCG
In the upper panel of Fig. 5, the azimutally averaged photometric profile of the central galaxy of RX J1340.6+4018 is shown. The surface photometry was performed using the task ELLIPSE in STSDAS/IRAF, which fits ellipses to extended object isophotes. We allowed the ellipticity and position angle of the successive ellipses to change but the center remained fixed. The ellipse fitting was performed only in the deeper i′ image. For the g′-band image, the software measured the isophotal levels using the parameters estimated in the i′-band image. There are several small objects within the isophotes of the central galaxy which were masked during the profile fitting procedure.

We have fitted a r1/4-law to the galaxy profile, from well outside the seeing disk (3.0″) to a radius corresponding to mag arcsec-2. In the lower panel of Fig. 5, the residuals (data – r1/4-law model) for the i′-band data are shown. There is no light excess over the de-Vaucoleurs profile indicating that this galaxy is not a cD.
4 X-ray properties of RX J1340.6+4018
4.1 ICM temperature and abundances
The gas temperature is consistent with a flat profile with a central (r37′′) value of 1.210.07 keV and outer value (112r37′′) of 1.310.14 keV, consistent within the errors with the average value of 1.160.08 keV determined by Khosroshahi et al (2007). If a cold core is present, it is very mild and not seen with the current statistics. The iron abundance is consistent with a flat profile, but shows marginal signs of a central enhancement. Its central value is 0.290.09 Solar and in the outer regions we can only set an upper limit of 0.2 Solar. The measured value of the intracluster gas X-ray luminosity from 0.5–10 keV of RX J1340.6+4018 is h erg s-1. According to the relations for groups and clusters from Mahdavi & Geller (2001), we find that for a system with this X-ray luminosity we would expect a velocity dispersion of about = 425 km s-1, in good agreement with our direct measurement, given the high scattering in the LX– relation (240 km/s).
4.2 Central abundance ratios and fossil group formation models
The isolation of the central galaxy in FGs and the correlation between the FG’s X-ray and central galaxy’s optical luminosities suggest that the formation process of these systems involve the merging of central bright galaxies due to dynamical friction. Given the time scales for dynamical friction, it was originally suggested that FGs have an earlier formation epoch than regular groups (e.g. Ponman et al. 1994). This is also in agreement with predictions of the concentration parameters and magnitude differences of the two brightest galaxies in FGs from numerical simulations (Wechsler et al. 2002, D onghia et al. 2005). However, the cooling time of FGs is observed to be significantly below the Hubble time (e.g., RX J1416.4+2315, ESO 3060170, Sun et al. (2004); NGC 6482, Khosroshahi et al. (2004, 2006), but they typically lack cooling cores, in disagreement with what one would expect for an old undisturbed system. This is a notable difference from regular rich groups, which often show cooling cores (e.g. Finoguenov & Ponman 1999), even in spite of strong AGN activity.
To try to solve this apparent contradiction it is desirable to have other independent formation age indicators. Elemental abundances measured in the central regions of FGs can be used as such (Dupke, Mendes de Oliveira & Sodré 2009). The general idea is based on the fact that different metal enrichment mechanisms contaminate the intragroup medium with different relative ejecta dominance and are more intense at different cluster locations and in different time scales. For example, protogalactic winds are dominated mostly by SN II and produce an early more distributed background of SN II ejecta throughout the group/cluster, while ram-pressure stripping happens continuously throughout the cluster’s history and creates a more concentrated SN Ia contamination, given its dependence on the ambient density.
If the group has an earlier origin and has been undisturbed for a long time, the above mentioned enrichment processes will develop a radial chemical gradient in such a way as to increase the central Fe mass fraction dominance from SN Ia, which is observed in rich groups and clusters of galaxies (e.g. Dupke 1999; Dupke & White 2000a,b; Allen et al 2001; Finoguenov et al. 2000; Dupke & Arnaud 2001). If the mergers are ”dry”, i.e., involving gasless galaxies, an older system should have a higher SN Ia central enhancement than a younger system. This central SN Ia enhancement has not been observed yet in any FG. In fact, most FGs seem to have an inverted trend of reduced central SN Ia dominance (Dupke, Mendes de Oliveira & Sodré 2009), suggesting that, without fine tuning, the difference between FGs and regular groups is not due to age but to the type of merger that created the central galaxy. Gas rich galaxy mergers presumably would be accompanied by SN II powered winds, diluting the SN Ia central dominance.
In order to compare the enrichment distribution, we selected two regions for spectral analysis. The first corresponds to the typical cooling radius, where the cooling time is less than the Hubble time (assumed as 100kpc or 10% of r200, which is determined according to r Mpc) and is denoted rcool. The second region is an annulus going from the border of rcool to 320 kpc, denominated outer in Table 3. A central circular region with 5 kpc radius was excluded to account for possible AGN contamination. Even though the current observation does not allow us to determine variations of the abundance of different -elements significantly, there seems to be an overall tendency for the abundance of the –elements silicon, sulfur, oxygen and magnesium to decline towards the central regions. The results are shown in Table 3 and suggest a gradient in the supernovae type enrichment dominance, unlike that of other FGs (Dupke, Mendes de Oliveira & Sodré 2009), but similar to that found in rich groups and poor clusters. The number of counts is very small for the analysis of individual ratios, so that we can only analyze an ensemble of abundance ratios. The error weighted average of the abundance ratios O/Fe, Si/Fe, S/Fe and Mg/Fe indicates that the SN Ia Fe mass fraction in the central regions of RX J1340.6+4018 is 919% and consistent with 0% in the outer parts.
| Element | Inner rcoolbb for the spectral fittings are 1.16 and 1.52 for 39 and 110 d.o.f. for the inner and outer regions respectively | Outerbb for the spectral fittings are 1.16 and 1.52 for 39 and 110 d.o.f. for the inner and outer regions respectively |
|---|---|---|
| O | 0.0ccErrors are 68% confidence limits | 0.4 |
| Mg | 0.41 | 1.55 |
| Si | 0.26 | 0.44 |
| S | 0.0 | 1.78 |
| Fe | 0.29 | 0.0 |
5 Discussion
Here we summarize our main findings in this optical and X-ray study of RX J1340.6+4018:
-
•
RX J1340.6+4018 is a cluster-like fossil group at , with a velocity dispersion of 565 km/s and a mass of 3.4 1014 M⊙within 516 h kpc (about 40% of its virial radius). Thus, the prototype FG is indeed a cluster, not a group.
-
•
We find a steep faint-end for the galaxy luminosity function of the cluster (with ), which is consistent with the data points published by Jones et al. (2000) and also with the Virgo and Coma luminosity functions. We conclude that there is little room for claims that the low mass (faint) end of fossil groups is essentially different from that of clusters such as Virgo (D’Onghia & Lake 2004). Thus, they do not pose a problem for CDM models (see also Zibetti et al. 2009).
-
•
The brightest object of RX J1340.6+4018 is not a cD galaxy. Its surface brightness profile follows closely a de Vaucouleurs-law out to 2.5 effective radii.
-
•
The X-ray analysis of the elemental abundance ratio profiles indicates that the Fe mass fraction in the central region is dominated by SN Ia contamination, similar to other groups and poor clusters of galaxies. This suggests that either the merger which originated the central galaxy was “dry” (the galaxies involved in this process were gas poor), or the the group has been formed at early epochs.
-
•
RX J1340.6+4018 does not constitute a low-density environment. Like RX J1552.2+2013 and RX J1416.4+2315, this object is a galaxy cluster with a large magnitude gap in the bright end. The fairly high X-ray emission, the large fraction of elliptical galaxies (most of the bright galaxies in Fig. 1 are early-types), the radial velocity distribution (Fig. 3), as well as the lack of obvious substructures, imply a high degree of virialization for RX J1340.6+4018.
Fossil groups have, by definition, a lack of bright galaxies because of the selection criteria used to catalogue them. The bright-end of the luminosity function of these systems is then known to be unusual, with too few L∗ galaxies. At the faint-end, not much has been known so far, but a scenario seems to be emerging that the massive FGs have steep luminosity functions with exception of perhaps RX J1552.2+2013, for which we just reach the magnitude of the dwarf upturn (the point where the curve goes from being giant-dominated to dwarf-dominated). For the particular case studied here, of RX J1340.6+4018, the faint end of its luminosity function is very steep () but, within the errors, it is similar to that of other galaxy clusters of comparable masses. For example, for the 2dF and RASS–SDSS clusters, in the blue-band (de Propris et al. 2003; Popesso et al. 2005). It is also comparable with the faint-end slope of clusters like Virgo (, Rines & Geller 2008) and Coma (, Iglesias-Páramo et al. 2003). It is worth mentioning that the above errors are statistical and, due to cosmic variance, they are probably underestimated.
We found that the central galaxy of RX J1340.6+4018 does not show any light excess over its de Vaucouleurs profile (which would characterize a cD galaxy). So far, only one central galaxy of a FG, that of RX J1552.2+2013, has been classified as a cD (perhaps not coincidentally, it is also the only FG observed to have a declining luminosity function at M).
The best accepted scenario for the formation of FGs involves the merging of the central bright galaxies. The lack of SN II ejecta dominance in the central regions of RX J1340.6+4018 implies that the mergers that formed the central galaxy were ”dry”. The overall results are consistent with an early epoch origin for this FG, so that it has been undisturbed for a long time and central replenishment with SN Ia material, through e.g., ram-pressure stripping, has not been affected by secondary SN II winds. The suspected lack of a cooling core in this system is, if this result is confirmed with better data, still an open question. The scenario of fossil group formation may become clearer when more of these groups are studied spectroscopically. Ongoing determinations of the luminosity function for a large sample of fossil groups and the detailed study of the properties of the brightest group members, including the determination of their ages and metal abundances, may also elucidate some of the unsolved problems regarding these systems.
References
- Allen et al. (2001) Allen, S. W., Fabian, A. C., Johnstone, R. M., Arnaud, K. A., & Nulsen, P. E. J., 2001, MNRAS, 322, 589
- Barnes (1989) Barnes, J., 1989, Nature, 338, 123
- Baumgartner et al. (2005) Baumgartner, W. H., Loewenstein, M., Horner, D. J., & Mushotzky, R. F., 2005, ApJ, 620, 680
- Beers, Flynn & Gebhartd (1990) Beers, T. C., Flynn K. & Gebhardt 1990, AJ, 100, 32
- von Benda-Beckmann et al. (2001) von Benda-Beckmann, A., D’Onghia, E., Gottlober, S., Hoeft, M., Khalatyan, A., Klypin, A. Muller, V., 2008, MNRAS, 386, 2345
- Bertin & Arnouts (1996) Bertin, E. & Arnouts, S. 1996, A&AS, 117, 393
- Boris et al. (2007) Boris, N. V., Sodré, L., Jr., Cypriano, E. S., Santos, W. A., de Oliveira, C. M., & West, M. 2007, ApJ, 666, 747
- Carlberg et al. (1997) Carlberg, R. G., Yee,H. K. C., & Ellingson, E. 1997, ApJ, 478, 462
- Cypriano et al. (2006) Cypriano, E. S., Mendes de Oliveira, C. L. & Sodré Jr., L. 2006, AJ, 132, 514
- Dariush et al. (2007) Dariush, A., Khosroshahi, H. G., Ponman, T. J., Pearce, F., Raychaudhury, S., & Hartley, W. 2007, MNRAS, 962
- Díaz-Giménez et al. (2008) Díaz-Giménez, E., Muriel, H., & Mendes de Oliveira, C. 2008, A&A, 490, 965
- D’Onghia & Lake (2004) D’Onghia, E., Lake, G. 2004, ApJ, 612, 628
- D’Onghia et al. (2005) D’Onghia, E., Sommer-Larsen, J., Romeo, A. D., Burkert, A., Pedersen, K., Portinari, L., & Rasmussen, J. 2005, ApJ, 630, L109
- Dupke (1999) Dupke, R. A., 1998, PhD Thesis, University of Alabama
- Dupke & Arnaud, K. (2001) Dupke, R. A. & Arnaud, K. 2001, ApJ, 548, 141
- Dupke & White, R. III (2000) Dupke, R. A. & White, R. E. III 2000a, ApJ, 537, 123
- Dupke & White, R. III (2000) Dupke, R. A. & White, R. E. III 2000b, ApJ, 528, 139
- Dupke, Mendes de Oliveira & Sodré (2009) Dupke, R. A., Mendes de Oliveira, C. 2009, & Sodré Jr., L. ApJ, submitted
- Evrard, et al. (1996) Evrard, A. E., Metzler, C. A., & Navarro, J. F. 1996, ApJ 469, 494
- Finoguenov, A., David, L. & Ponman (2000) Finoguenov et al. 2000, ApJ544, 188
- Fukazawa, A. et al. (1998) Fukazawa, Y., Makishima, K., Tamura, T., Ezawa, H., Xu, H., Ikebe, Y., Kikuchi, K., & Ohashi, T. 1998, PASJ 50, 187 Ichikawa(1995)]fukugita95 Fukugita, M., T. 1995, PASP, 107, 945
- Fukugita et al. (1995) Fukugita, M., Shimasaku, K., & Ichikawa, T. 1995, PASP, 107, 945
- Fukugita et al. (1996) Fukugita, M., Ichikawa, T., Gunn, J. E., Doi, M., Shimasaku, K. & Schneider, D. P. 1996, AJ, 111, 1748
- Girardi & Mezzeti (2001) Girardi, M. & Mezzeti, M. 2001, ApJ, 548, 79
- Heisler et al. (1985) Heisler, J.. Tremaine, S.. Bahcall, J. N. 1985, ApJ, 298, 8
- Hook et al. (2002) Hook, Isobel, Allington-Smith, J. R., Beard, S. et al. 2002, SPIE, 4841, Power Telescopes and Instrumentation into the New Millennium
- Heckman et al. (1990) Heckman, T. M., Armus, L., & Miley, G. K. 1990, ApJS, 74, 833
- Iglesias-Páramo et al. (2003) Iglesias-Páramo, J., Boselli, A., Gavazzi, G., Cortese, L., & Vílchez, J. M. 2003, A&A, 397, 421
- Jones et al. (2000) Jones, L. R., Ponman, T. J., Forbes, Duncan A. 2000, MNRAS, 312, 139
- Jones et al. (2003) Jones, L. R., Ponman, T. J., Horton, A., Babul, A., Ebeling, H., Burke, D. J. 2003, MNRAS, 343, 627
- Khochfar, S. & Burkett, A. (2005) Khochfar, S. & Burkett, A. 2005, MNRAS, 359, 1379
- Khosroshahi et al (2004) Khosroshahi, Habib G., Jones, Laurence R., Ponman, Trevor J. 2004, MNRAS, 349, 1240
- Khosroshahi et al. (2006) Khosroshahi, H. G., Maughan, B. J., Ponman, T. J., & Jones, L. R. 2006, MNRAS, 369, 1211
- Khosroshahi et al. (2006) Khosroshahi, Habib G., Ponman, Trevor J., & Jones, Laurence R., 2006, MNRAS, 372, L68
- Khosroshahi et al (2007) Khosroshahi, Habib G., Ponman, Trevor J., & Jones, Laurence R., 2007, MNRAS, 377, 595
- Kurtz & Mink (1998) Kurtz, M. J. & Mink, D. J. 1998, PASP, 110
- Mahdavi & Geller (2001) Mahdavi, A., Geller, M.J. 2001, ApJ, 554, 129
- Mendes de Oliveira et al. (2006) Mendes de Oliveira, C. L., Cypriano, E. S., Sodré Jr., L. 2006, AJ, 131, 158
- Mendes de Oliveira & Carrasco (2007) Mendes de Oliveira, C. L., & Carrasco, E. R. 2007, ApJ, 670, L93
- Mushotzky, R. F. et al. (1996) Mushotzky, R., Loewenstein, M., Arnaud, K. A., Tamura, T., Fukazawa, Y., Matsushita, K., Kikuchi, K., & Hatsukade, I. ApJ, 466, 686
- Ponman et al. (1994) Ponman, T. J., Allan, D. J., Jones, L. R., Merrifield, M., McHardy, I. M., Lehto, H. J., Luppino, G. A. 1994, Nature, 369, 462
- Popesso et al. (2005) Popesso, P., Böhringer, H., Romaniello, M., Voges, W. 2005, A&A, 433, 415
- de Propris et al. (2003) De Propris, R. et al. 2003, MNRAS, 342, 725
- Rines & Geller (2008) Rines, K. & Geller, M. J. 2008, AJ, 135, 1837
- Sales et al. (2007) Sales, L. V., Navarro, J. F., Lambas, D. G., White, S. D. M., & Croton, D. J. 2007, MNRAS (accepted; arXiv:0706.2009)
- Sanders & Mirabel (1996) Sanders, D. B. & Mirabel, I. F. 1996, ARA&A, 34, 749
- Santos et al. (2007) Santos, W. A., Mendes de Oliveira, C., Sodré Jr., L. 2007, AJ, 134, 155
- Schlegel, Finkbeiner & Davis (1998) Schlegel, S., Finkbeiner, D. P. & Davies, M. 1998, ApJ, 500, 525
- Springel et al. (2005) Springel, V., et al. 2005, Nature, 435, 629
- Sun et al. (2004) Sun, M., Forman, W., Vikhlinin, A., Hornstrup, A., Jones, C., Murray, S. S. 2004, ApJ, 612, 805
- Tonry & Davis (1979) Tonry, J. & Davis, M. 1979, AJ, 84, 1511
- Zibetti et al. (2009) Zibetti, S., Pierini, D., & Pratt, G. W. 2009, MNRAS, 392, 525