Modeling The GRB Host Galaxy Mass Distribution: Are GRBs Unbiased Tracers of Star Formation?
Abstract
We model the mass distribution of long gamma-ray burst (GRB) host galaxies given recent results suggesting that GRBs occur in low metallicity environments. By utilizing measurements of the redshift evolution of the mass-metallicity (M-Z) relationship for galaxies, along with a sharp host metallicity cut-off suggested by Modjaz and collaborators, we estimate an upper limit on the stellar mass of a galaxy that can efficiently produce a GRB as a function of redshift. By employing consistent abundance indicators, we find that sub-solar metallicity cut-offs effectively limit GRBs to low stellar mass spirals and dwarf galaxies at low redshift. At higher redshifts, as the average metallicity of galaxies in the Universe falls, the mass range of galaxies capable of hosting a GRB broadens, with an upper bound approaching the mass of even the largest spiral galaxies. We compare these predicted limits to the growing number of published GRB host masses and find that extremely low metallicity cut-offs of 0.1 to 0.5 are effectively ruled out by a large number of intermediate mass galaxies at low redshift. A mass function that includes a smooth decrease in the efficiency of producing GRBs in galaxies of metallicity above 12+log(O/H)KK04 8.7 can, however, accommodate a majority of the measured host galaxy masses. We find that at , the peak in the observed GRB host mass distribution is inconsistent with the expected peak in the mass of galaxies harboring most of the star formation. This suggests that GRBs are metallicity biased tracers of star formation at low and intermediate redshifts, although our model predicts that this bias should disappear at higher redshifts due to the evolving metallicity content of the universe.
Subject headings:
Gamma-rays: Bursts: GRB host galaxies1. Introduction
The success of NASA’s Swift spacecraft (Gehrels et al., 2004) has resulted in a dramatic increase in the number of X-ray localizations of afterglows associated with long gamma-ray bursts (GRBs). This increase has resulted in a wealth of new information regarding the demographics of GRBs and their host galaxies. Investigating the environments in which these events occur has long been an important path to understanding the nature of GRB progenitors, as different origin models have traditionally predicted distinct GRB host galaxy populations. The connection between GRBs and the death of massive stars is now well-established at low redshift () by the association of GRBs with broad lined SN lc events (for a review, see Woosley & Bloom, 2006).
Recent observations (Castro Cerón et al., 2008; Savaglio et al., 2009) of X-ray localizations by Swift have bolstered previous results showing that GRB host galaxies tend to be bluer, fainter, and more irregular than galaxies at similar redshifts (Fruchter et al., 1999; Chary et al., 2002; Bloom et al., 2002; Le Floc’h et al., 2003; Tanvir et al., 2004; Fruchter et al., 2006; Castro Cerón et al., 2006). They tend to have higher specific star formation than typical star-forming galaxies (Chary et al., 2002; Berger et al., 2003; Christensen et al., 2004) and the peak in their redshift distribution tends to broadly track the peak in the overall cosmic star formation rate of the universe (Bloom, 2003; Firmani et al., 2004; Natarajan et al., 2005; Jakobsson et al., 2006; Kocevski & Liang, 2006; Guetta & Piran, 2007). Only a handful of events have been associated with grand design spirals and no long duration GRB has been associated with an early type galaxy.
A growing body of spectroscopic evidence has also shown that these galaxies tend to be metal poor (Prochaska et al., 2004; Sollerman et al., 2005; Fruchter et al., 2006; Modjaz et al., 2006; Stanek et al., 2006; Thöne et al., 2007; Wiersema et al., 2007; Margutti et al., 2007). Absorption line spectroscopy has revealed that the regions in which GRB afterglows are observed tend to have the low metallicities that are expected from young stellar populations (Fynbo et al., 2003; Savaglio et al., 2003). However, there are a few exceptions (Fynbo et al., 2006; Prochaska et al., 2007; Fynbo et al., 2008; Chen et al., 2008). The high specific star formation rates along with these low metallicities are similar to what are seen in star-bursting Lyman break galaxies at high redshift.
There is ample theoretical justification for the a priori association of GRBs with short-lived, metal poor progenitors. The combination of high angular momentum and high stellar mass at the time of collapse (Woosley, 1993; MacFadyen & Woosley, 1999) is crucial for producing the collimated emission that is required to account for the enormous isotropic-equivelent energy released by these events. Low metallicity progenitors would, in theory, retain more of their mass due to smaller line-driven stellar winds (Kudritzki & Puls, 2000; Vink & de Koter, 2005), and hence preserve their angular momentum (Yoon & Langer, 2005; Woosley & Heger, 2006).
Recently, Modjaz et al. (2008) showed that a sharp delineation may exist between the metallicity at the sites of broad-lined SN Ic that have been associated with GRBs and SN Ic with no detected gamma-ray emission. Using a sample of 12 nearby () broad-lined SN Ic without associated GRBs, they found that the chemical abundance at the sites of known SN-GRBs (at ) were systematically lower than those harboring SN without GRBs, with a boundary between the two samples at an oxygen abundance of roughly 12+log(O/H) in the Kewley & Dopita (2002) scale (see Modjaz et al. 2008 - Figure 5). This trend is independent of choice of the metallicity diagnostic they adopt (see their Figure 6) and the mode of SN survey that found the SN without GRBs.
At the same time, the observed trend that many GRB host galaxies are less luminous, metal poor, irregular dwarf galaxies is in qualitative agreement with the observed trend of decreasing metallicity of galaxies as a function of their stellar mass: the mass-metallicity (M-Z) relationship. Although well established at low redshift (Tremonti et al., 2004), the M-Z relationship has only recently been measured for high redshift galaxies where it has become clear that the overall normalization of the relationship has decreased throughout the history of the universe (Savaglio et al., 2005; Erb et al., 2006).
As a consequence of the M-Z relationship, any bias in the metallicity of the environment that is capable of producing a GRB would likely place severe restrictions on the type of galaxies that can host such events. While earlier studies suggest that the GRB redshift distribution tends to broadly track the overall cosmic star formation rate of the universe, the question remains as to what extent GRB hosts are unbiased tracers of SF in the high redshift universe. In this paper, we use empirical models based on the measurements of the redshift evolution of the M-Z relationship to estimate the upper limit to the stellar mass of a galaxy that can harbor a GRB, and test the suggestion that GRBs preferentially form in low metallicity environments. We detail the prescriptions for our model in and expand upon our results in . We compare our model predictions to published host mass values in and discuss the implications of our results in .
2. Model Prescriptions
To investigate how a potential metallicity cut-off effects the resulting GRB host mass distribution we must first assume an empirical prescription for the relationship between a galaxy’s stellar mass and its level of chemical enrichment. Such a correlation was first observed by Lequeux et al. (1979); a trend between the heavy-element abundance in H II regions and the stellar mass of irregular and blue compact galaxies. More recently, this correlation has been statistically quantified by Tremonti et al. (2004) using of 53,000 galaxies from the Sloan Digital Sky Survey (SDSS). Tremonti et al. (2004) find a tight correlation between galactic stellar mass and gas-phase metallicity that spans 3 orders of magnitude in stellar mass and a factor of 10 in metallicity. They conclude that the galactic metallicity abundance rises steeply for stellar masses between and M⊙, then flattens for galaxies above M⊙.
A basic form of this correlation is a natural consequence of the conversion of gas to stars within star forming galaxies, given a mass dependent star formation efficiency (Schmidt, 1963; Searle & Sargent, 1972). In the context of these simple “closed-box” models, this disparity in the efficiency between high and low mass galaxies is thought to be due to variations in galactic surface densities as a function of mass (Kennicutt, 1998; Martin & Kennicutt, 2001; Dalcanton et al., 2004).
It has now become apparent that the effects of supernovae feedback and the infall of metal-poor gas (Dalcanton, 2007) must also play important roles in shaping the observed mass-metallicity relationship. Galactic winds produced by SNe work to strip galaxies of metal enriched gas, with low mass galaxies being more susceptible to such effects due to their shallower potential wells. Energy injection from SNe also heats interstellar gas, delaying the collapse of otherwise cold gas to produce stars. At the same time, the infall of metal-poor gas acts to dilute the metal content of the ISM. This effect is significant in small galaxies where the infall rate can exceed the total star formation rate, causing an net decrease in the metallically of the ISM with time. The combined result of these mechanisms is that high mass galaxies process their primordial gas faster and more efficiently than low mass galaxies and are more effective at retaining the resulting material against wind induced mass loss, leading to a positive correlation between stellar mass and metallicity.
These explanations for the origin of the M-Z relationship suggest significant evolution of the relationship with redshift. First, one would expect the normalization of the relationship to fall as a function of lookback time as metal abundance becomes less common in all galaxies. Second, the variations in the efficiency of star formation as a function of mass should also change the slope of the M-Z relationship as a function of redshift. Efforts to quantify this evolution have been the focus of several recent observational (Savaglio et al., 2005; Erb et al., 2006; Maiolino et al., 2008) and numerical (de Rossi et al., 2007; Kobayashi et al., 2007; Tassis et al., 2008; Brooks et al., 2007) investigation. In particular, Savaglio et al. (2005) used the Gemini Deep Deep Survey (GDDS) to examine the M-Z relationship at and found clear evidence for an overall decrease in the normalization of the relationship with respect to that found in the local Universe. Likewise, Erb et al. (2006) utilized 87 rest-frame UV selected star forming galaxies to study the nature of the correlation beyond a redshift of 2 and came to similar conclusions.
For our analysis, we have adopted the empirical model put forth by Savaglio et al. (2005) to describe the evolution of the M-Z relationship as a function of redshift. This model was developed using their GDDS sample along with the galaxies presented by Shapley et al. (2004) to extrapolate the shape of the M-Z relationship to higher redshifts. This empirical relationship (Equation 11 in Savaglio et al., 2005) allows for the average metallicity of a galaxy to be estimated as a function of stellar mass at a given redshift and can be stated as:
| (1) |
where is the Hubble time and is the galactic stellar mass. The Savaglio et al. model reproduces several of the predicted M-Z relationship properties at high redshift, including the overall reduction in the M-Z relationship normalization as well as a steeper evolution in the metallicity of low mass galaxies in comparison to their high mass counterparts. Figure 1 shows the metallicity as a function of stellar mass for a variety of redshifts as approximated by the Savaglio et al. model out to . We note that the original data used by Savaglio et al. (2005) was limited to the range of 12+log(O/H) and and hence the curves at lower metallicities and higher redshifts are extrapolations beyond the range of the data used to define the model.
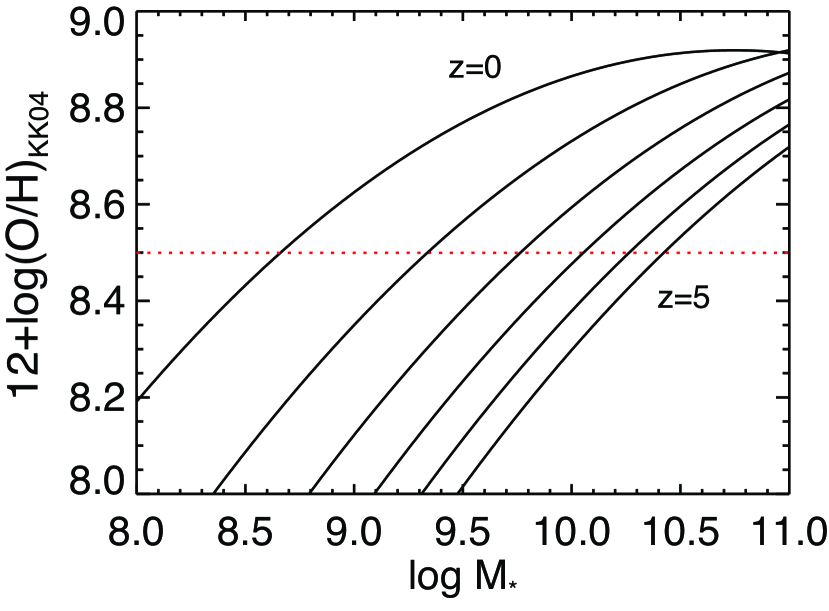
It is important to examine the details of the diagnostics used by Savaglio et al. (2005), as different initial mass functions (IMFs), for example, can yield factor of 2 differences in stellar mass and different metallicity calibrators can likewise result in large discrepancies in abundance estimates. The stellar masses used by Savaglio et al. (2005) to produce their empirical relationship were estimated through SED modeling of multi-band photometry for each galaxy, with an initial mass function derived by Baldry & Glazebrook (2003). Their metallicity values were obtained through nebular oxygen abundance estimates calibrated via stellar population synthesis and photoionization models developed by Kobulnicky & Kewley (2004, hereafter KK04). This metallicity diagnostic, which uses traditional strong emission line ratios, and other commonly used calibrations (e.g., McGaugh 1991, Kewley & Dopita 2002) are discussed in detail in Kewley & Ellison (2008) who quantify the systematic offsets amongst the different calibrations and provide conversion tables.
We also note that the metallicity value for the boundary between hosts that harbor broad-lined SN Ic with associated GRBs and SN Ic with no detected gamma-ray activity reported by Modjaz et al. (2008) was measured using the diagnostic proposed by Kewley & Dopita (2002) (KD02). In order to convert from the KD02 scale to the KK04 scale used by Savaglio et al. (2005), we consulted Kewley & Ellison (2008) for the appropriate metallicity calibration conversion (their table 3). We find that a value of 12+log(O/H) approximately converts to 12+log(O/H), which we quote as the Modjaz et al. (2008) cutoff metallicity for the remainder of the paper.
In addition to understanding how the average metallicity of a galaxy varies as a function of stellar mass, we would also like to know how the number density of galaxies and the number of stars being produced in those galaxies varies with galactic stellar mass. This will allow us to model the effects of a metallicity bias on the overall mass distribution of GRB host galaxies, and eventually compare those models to the unbiased mass distribution of all star-forming galaxies at a given redshift. As with the mass-metallicity relation, both the galactic stellar mass function and the star formation rate as a function of stellar mass are expected to evolve with redshift and quantifying this evolution is crucial to understanding the distribution of galaxies that are capable of harboring a GRB.
The star formation rate as a function of stellar mass (SFRM) in the local universe is well constrained. Using a sample of more than galaxies, Kauffmann et al. (2004) showed that the star formation rate in low mass galaxies scales as a power law to their halo mass, peaking at roughly log , before falling for higher mass galaxies. This transition represents the stellar mass at which the galaxy distribution changes from younger stellar populations and active star forming galaxies to systems with older stellar populations and low star formation activity.
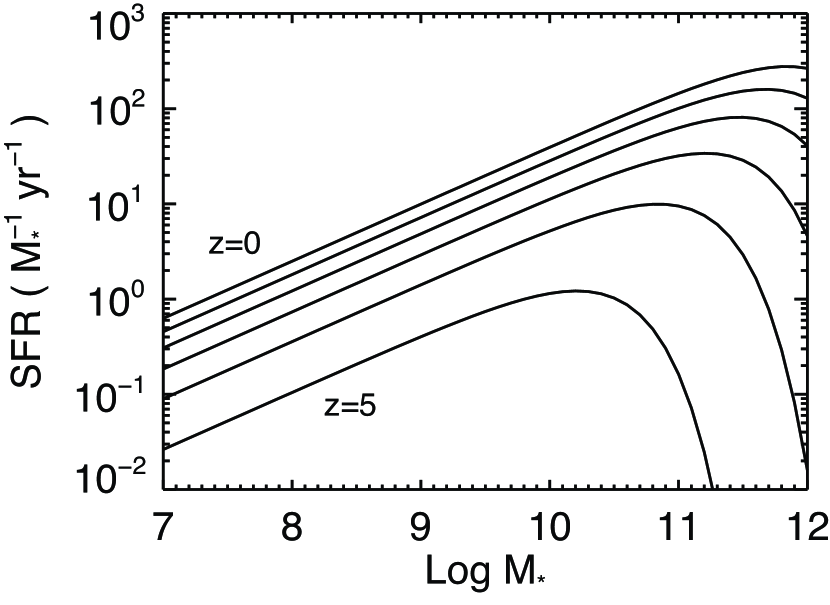
Drory & Alvarez (2008) used the FORS Deep Field survey (Feulner et al., 2005) to quantify this relationship and its evolution with redshift for stellar masses and redshifts spanning log and . They find that the stellar mass at which the star formation rate turns over for high mass galaxies evolves smoothly to higher masses with increasing redshift, until the break mass disappears entirely and the star formation rate as a function of stellar mass can be represented as a single power law. Surprisingly, Drory & Alvarez (2008) find that the power law index representing the low mass region of this relationship remains constant even to the highest redshifts in their sample.
For the purposes of this paper, we have adopted the analytic expression presented by Drory & Alvarez (2008) for the star formation rate as a function of stellar mass given as:
| (2) |
where M represents the break mass at which the star formation rate deviates from a power law. We also use the best fit parameterizations from Drory et al. (2008) for the evolution of the overall normalization and break mass with redshift, given as:
| (3) | |||
| (4) |
Following Drory & Alvarez (2008), we have fixed the power law index to and assume it remains constant at all redshifts under consideration. The star formation rate as a function of stellar mass between , as described by Equations (2)-(4), are shown in Figure 2.
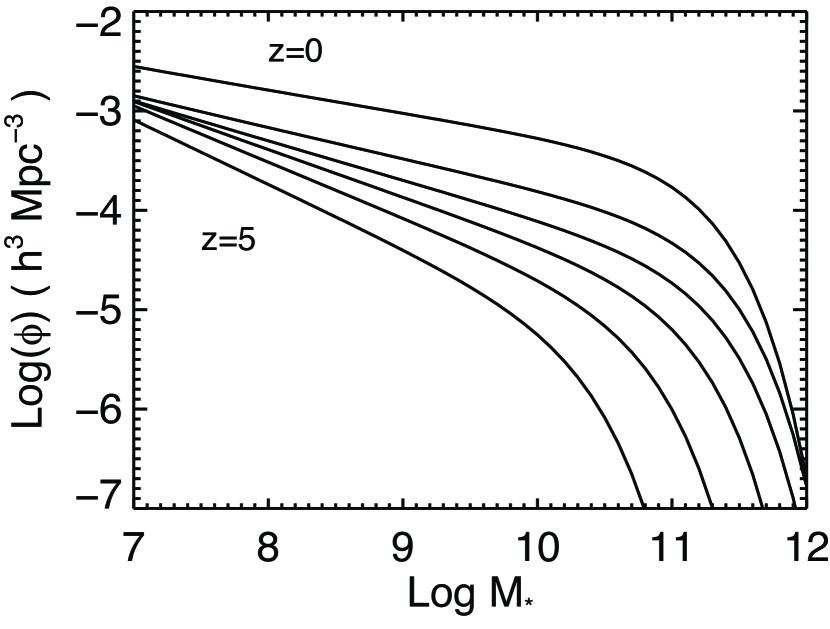
The galactic stellar mass function (GSMF) in the local universe is likewise well understood. It has long been known that dwarf galaxies represent the largest fraction of galaxies in the local universe, with their relative number decreasing as a power law with increasing stellar mass up to some characteristic mass, above which the number of galaxies drops sharply. At low redshift, the 2dF (Cole et al., 2001) and 2MASS-SDSS (Bell et al., 2003; Blanton et al., 2003) surveys constrained the parameters of the Schechter function that is commonly used to describe the distribution of stellar mass in the Universe. The GSMF at high redshift has been explored by Fontana et al. (2004), Drory et al. (2005), Conselice et al. (2005), and Fontana et al. (2006) using a variety of deep surveys, all showing evidence for a distinct evolution of the GSMF with cosmic time. Using the GOODS-MUSIC catalog of over 3000 infrared selected galaxies, Fontana et al. (2006) showed that the number density of high mass galaxies drops with redshift, while the density of low mass galaxies evolves faster than their high mass counterparts out to a redshift of . The net result of this differential evolution is an increasing fraction of low mass dwarf galaxies with respect to higher mass galaxies at higher redshifts.
For the purposes of this paper, we have adopted the analytic model presented by Drory & Alvarez (2008) for the galactic stellar mass function given as:
| (5) |
We have again used their best fit parameterizations for the evolution of normalization of the mass function as well as the characteristic break mass, given as:
| (6) | |||
| (7) |
We further assumed that the power law index below the break mass remains constant at for all redshifts under consideration. The GSMF between , as described by Equations (5)-(7), are shown in Figure 3.
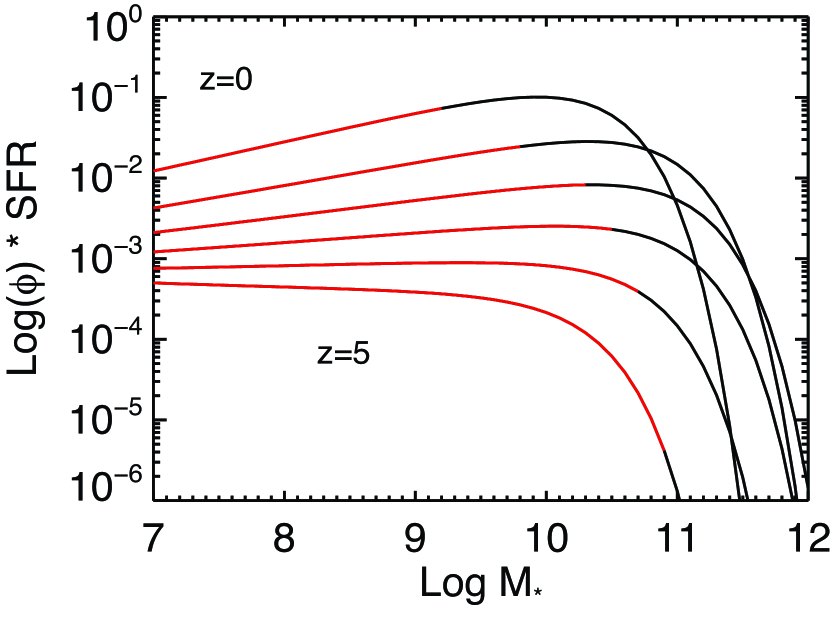
Ultimately, it is important to know the total number of stars being produced as a function of stellar mass. Thus, we also computed the product of the galactic stellar mass function (GSMF) and star formation rate as a function of stellar mass (SFRM). This galaxy weighted star formation rate (WSFR) is shown in Figure 4 at a variety of redshifts. The red lines in Figure 4 represent the metallicity biased WSFR, the details of which we will discuss in the next section. Between roughly , the number density of low mass galaxies outweighs that of their more massive counterparts, but the cosmic star formation rate is largely dominated by these relatively less numerous massive galaxies. The net result is a weighted star formation rate that peaks at intermediate masses, roughly between . At higher redshifts, the drop in the number of high mass galaxies becomes significant and the stellar mass function becomes dominated by low mass galaxies. At the same time the peak in the SFRM decreases smoothly to lower masses with increasing redshift, resulting in a sharp fall in the mass at which the weighted star formation rate peaks for . The mass at which the WSFR peaks is plotted as the long dashed black line in Figure 5. If GRBs are unbiased tracers of star formation in the universe, and if they follow the M-Z relationship (but see Brown et al., 2008), then the peak of their host mass distribution should roughly follow this line. We test this prediction in the following section.
3. Results
Using the empirical M-Z relationship expressed in Equation 1, we estimated the stellar mass of a galaxy of a given metallicity as a function of look back time. The average stellar mass for galaxies with a low oxygen abundance of roughly 1/3 111We assume a solar metallicity of 12+log(O/H) = 8.7 (Asplund, 2005) in the Pettini & Pagel (2004) scale and convert that value to the KK04 scale using Table 3 in Kewley & Ellison (2008) to get ., or 12+log(O/H), is traced as the red line in Figure 5, with the red shaded region surrounding this line representing the uncertainty due to the intrinsic scatter of the M-Z relationship at low redshift. Here we have used the values presented by Tremonti et al. (2004) to estimate the scatter about the M-Z relationship, and hence the resulting stellar mass range, at a redshift of . Unfortunately, such detailed estimates of the scatter associated with the M-Z relationship at high redshift are currently lacking and therefore for our analysis we assume that this scatter is indicative of the scatter at all redshifts under consideration, which is certainly an over-simplification. The region of stellar mass shaded blue and green represent the typical masses for dwarf and spiral galaxies respectively. As expected, the average mass of a galaxy at a given metallicity rises as a function of redshift, a direct effect of the decreasing normalization of the M-Z relationship as a function of look back time. The effects this would have on a metallicity biased GRB host population are immediately apparent. If GRBs are limited to low metallicity environments, then at low redshift they would be relegated to dwarf and low mass spiral galaxies (barring the effects of metallicity gradients, which we will discuss in detail in ”), whereas at high redshift the effective mass limit is raised, allowing GRBs to occur in a much broader range of galaxies. A similar prediction was made by Ramirez-Ruiz et al. (2002) based purely on theoretical grounds.
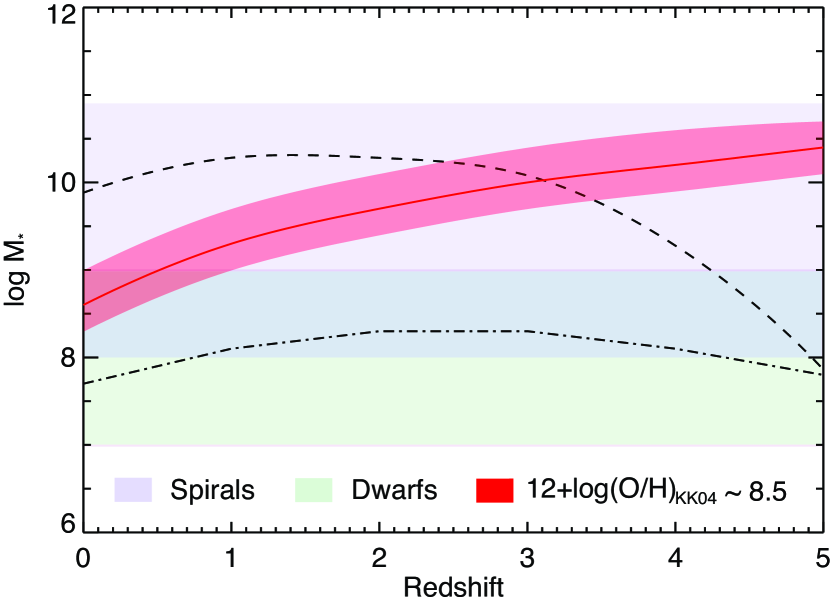
Furthermore, if GRBs are unbiased tracers of star formation throughout the universe, then their observed host mass distribution should cluster about the peak in the WSFR represented by the long dashed line in Figure 5. On the other hand, if they are metallicity biased tracers of star formation, then their host mass distribution should deviate significantly from this curve at low redshifts, peaking instead at the upper mass limit shown in red. At some redshift (roughly for a metallicity cutoff of 12+log(O/H)) the stellar mass at which the WSFR peaks crosses this upper mass limit, after which the peak in the unbiased and biased mass distributions become indistinguishable.
We also quantified the median of the GRB host mass distribution by considering only the product of the GSMF and SFRM below the metallicity imposed upper mass limit to the GRB host population. The red solid lines shown in Figure 4 represent the galaxy masses which fall below the upper limit imposed by a metallicity cut-off of 12+log(O/H) for various redshifts. If GRBs are metallicity biased tracers of the star formation in the universe, then the centroid of this truncated total star formation rate would yield the expected median stellar mass of a GRB host population as a function of redshift. We plot this expected median mass as a dash-dotted black line in Figure 5. Although the upper limit imposed on the mass of a galaxy that can host a GRB increases with redshift, the effects of a galaxy population dominated by low mass galaxies along with the shift in the type of galaxies producing most of the stars in the early universe have the net effect of keeping the median GRB host galaxy mass relatively constant with redshift, at roughly a mass of . Note that this estimate assumes that the fraction of the total star formation that goes into the production of GRB progenitors does not change significantly with redshift, host type, or stellar mass. This assumption breaks down if environmental variables other than metallicity play an important role in the formation of a GRB progenitor. normalization in the GRB host mass distribution, only their relative distribution in stellar galactic mass at a given redshift.
Unfortunately, the predicted median host mass shown by the dash-dotted line if Figure 5 is not currently observable, except for low redshift GRBs, which are rare. Detection effects and Malquist type biases will lead any observational measure of the GRB host mass distribution to be biased towards high mass, high surface brightness, galaxies. This would effectively shift the dash-dotted line in Figure 5 to higher masses with increasing redshift and such completeness considerations have not been incorporated into our model.
4. Comparison to GRB Host Galaxy Observations
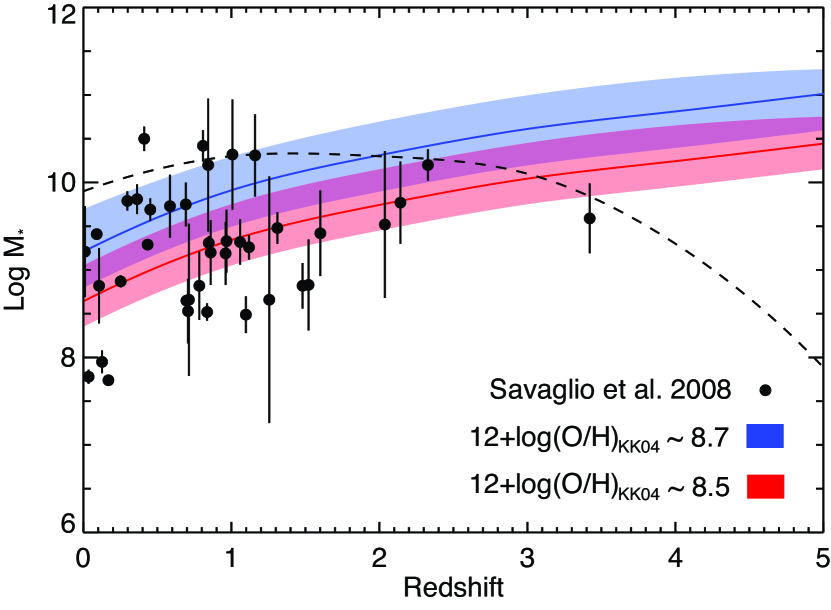
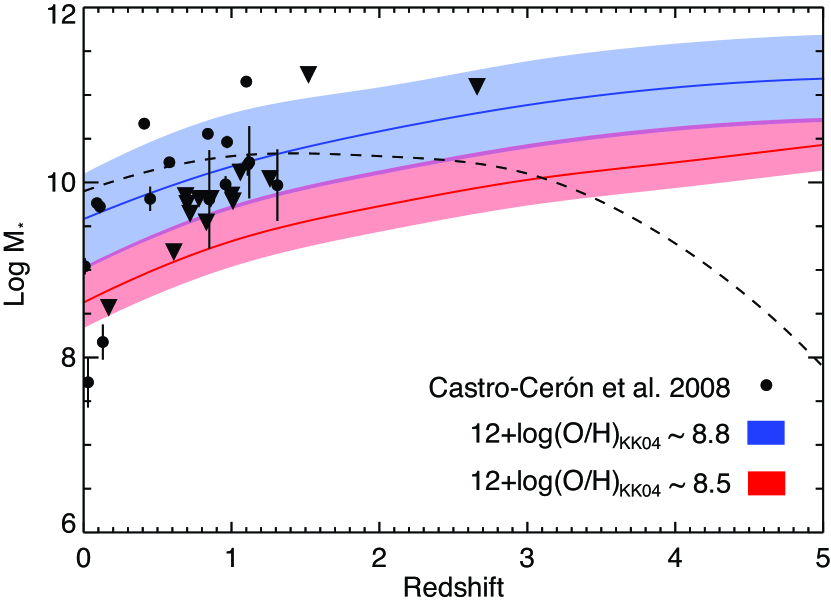
How do the upper mass limits as inferred from the M-Z relationship compare to measured values for the subset of the GRBs with known host associations? To examine this question, we turned to two recent studies by Castro Cerón et al. (2008, hereafter CC08) and Savaglio et al. (2009, hereafter SGB09), which compiled the galactic stellar masses, star formation rates, and dust extinctions for a large sample of GRB host galaxies between . CC08 utilized the rest frame -band flux densities as interpolated from Spitzer’s (Werner et al., 2004) IRAC (Fazio et al., 2004) and additional NIR observations to obtain an estimate of for a sample of 30 long-duration GRBs. SGB09 obtained similar estimates through a combination of optical and NIR observations for a sample of 46 host galaxies. Both groups used photometric observations in conjunction with mass-to-light ratios derived from SED fits to measure the total stellar mass of the hosts in their sample. The two studies assumed slightly different initial mass functions (IMFs) and average mass-to-light ratios, introducing a systematic offset between the estimated mass values derived from the two samples which we discuss in more detail in the next section.
CC08 and SGB09 found that GRB host galaxies exhibit a wide range of stellar mass and star formation rates, although as a whole they tend towards low , relatively dim, high specific star-forming systems, confirming previous observations (Fruchter et al., 1999; Le Floc’h et al., 2003; Chary et al., 2002; Berger et al., 2003). The values from the CC08 and SGB09 papers are shown in Figures 6 and 7 respectively, with upper limits represented by triangular symbols. As in Figure 5, the red shaded region in both plots represents the upper limit on the stellar mass of a galaxy capable of hosting a GRB as imposed by the M-Z relationship and its associated scatter with a metallicity cut-off of 12+log(O/H) It is clear from Figures 6 and 7 that a significant fraction of observed host galaxies have values that are greater than the predicted upper limit to the GRB host mass distribution for such a low metallicity cutoff value. Most of these host galaxies can be accommodated if the metallicity cut-off is increased to 12+log(O/H) for the SGB09 sample and 12+log(O/H) for the CC08 sample. Note that the resulting spread in the predicted mass range is significantly wider for 12+log(O/H) due to the shallower slope of the shallower M-Z relationship at this metallicity. Even at this relatively high metallicity cut-off, with its larger intrinsic spread, three hosts in the CC08 sample are still above the predicted mass limit, although metallicity gradients within these high-mass hosts may explain the existence of these hosts in the GRB sample.
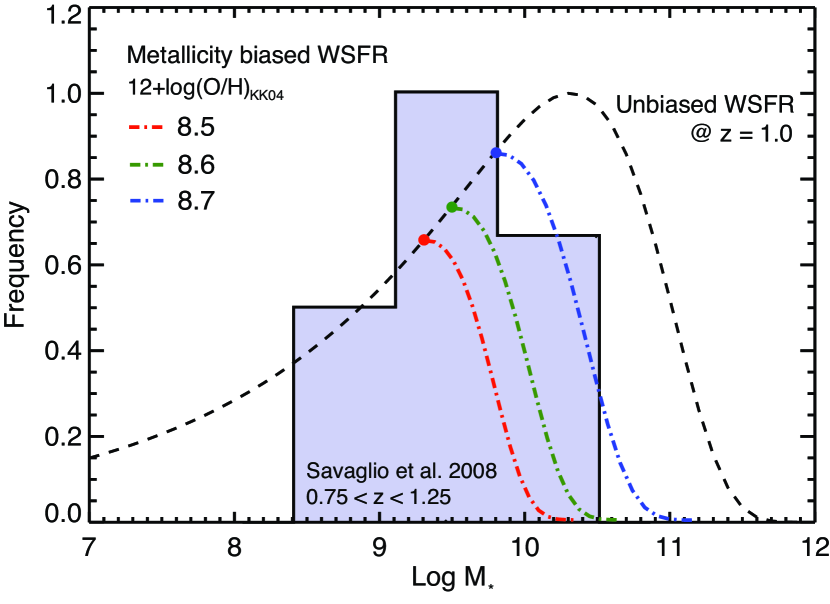
SGB09 and CC08 found median masses of and respectively, far greater than the median host mass predicted by simply looking at the truncated distribution of total star formation as a function of (The dash-dotted line in Figure 5). This direct comparison between the expectation peak of the WSFR and the median values for the two samples is problematic, as detection effects biasing against low mass galaxies will heavily influence the observed median mass. We can however compare the observed host mass distribution to the high end of the expected mass distribution of all star formating galaxies at a given redshift, as detection effects should not effect this region of the observed distribution. We address this question in Figures 8 and 9, where we plot the SGB09 and CC08 host mass distributions for galaxies between along with the expected unbiased WSFR as a function stellar mass at a (dashed line). The normalization of the distributions in these plots is arbitrary, with the peak of the predicted WSFR and the observed host mass distributions both being set to 1. The bracketed arrows in Figure 9 represent galaxies for which CC08 were unable to make firm estimates on the galactic stellar mass, resulting only in upper limits accompanied with very conservative lower limits.
It is quite clear that the SGB09 sample is not well described by the expected host mass distribution of unbiased star forming galaxies at . Although the SGB09 distribution can be expected to artificially fall off at low due to observational biases, the same cannot be said for the lack of high galaxies, pointing to an intrinsic decline in the GRB host population. The case for the CC08 sample is less clear. Their median stellar mass between of is much more consistent with the peak of the unbiased WSFR distribution, which at peaks at . This median of the CC08 sample does not include the values for which only limits exist, which work to broaden the distribution to lower values, making it less consistent with the model distribution.
We can statistically compare the two observed distributions to the model distribution by drawing a random set of values from the WSFR distribution, equal in size to the observed samples, to which we can perform a two-sided Kolmogorov-Smirnov analysis. We perform this comparison for 1000 trails, using a random realization of the WSFR mass distribution in each iteration, while measuring the median probability that the model distribution and the SGB09 and CC08 samples are drawn from the same parent populations. For both the SGB09 and CC08 samples, the probability that they are randomly drawn from the unbiased WSFR distribution is quite low, and respectively. Unfortunately, the observational biases discussed above leads to the lack of completeness at low for both samples making the use of a traditional K-S analysis questionable. The median WSFR mass will be heavily weighted by low mass galaxies, the smallest of which are likely not present in the SGB09 and CC08 samples because of detection effects.
At present, without an understanding of the completeness of the GRB host samples, we can only compare the peaks and the high end behavior of the mass distributions which we believe should not be effected by observational biases. In both cases, the SGB09 and CC08 samples peak below the unbaised peak in the galaxy weighted star formation rate as a function of stellar mass, although the discrepancy is much greater when considering the SGB09 sample.
5. Discussion
The comparison between the stellar mass limits imposed by metallicity cut-offs to the measured values in the SGB09 and CC08 samples is quite telling. A low metallicity cut-off of 12+log(O/H) is disfavored by current measurements of the stellar masses of GRB host galaxies at low and intermediate redshifts. However, a comparison of observed GRB host masses still appears to favor a metallicity biased mass distribution rather than one based solely on the mass distribution of all star formation galaxies at similar redshifts. Increasing the metallicity cut-off to 12+log(O/H) allows for the accommodation of most of measured host masses, when factoring in the intrinsic spread of the M-Z relationship. This is in rough agreement with the metallicity cutoff found by Modjaz et al. (2008) of roughly 12+log(O/H) at low redshift (). This result is also in general agreement with the results presented by Nuza et al. (2007) who find a comparable metallicity bias through the use of hydrodynamical cosmological simulations in conjunction with assumptions of the collapsar event rate. They conclude that the observed properties of GRB host galaxies are reproduced if long GRBs are limited to low-metallicity progenitors.
In a similar investigation, Wolf & Podsiadlowski (2007) used the luminosity-metallicity () relation for galaxies to compare the host galaxy luminosity distributions between CC SNe and long GRB host galaxies to the expected luminosity function of all star forming galaxies at a given redshift. They found that although their ultraviolet based SFR estimates reproduced the CC SNe host luminosity distribution extremely well, the same was not true for the GRB host population. They found that their model SFR estimates would have to exclude luminous, and hence high metallicity, galaxies in order to match the observed GRB host distribution. They concluded that a metallicity bias with a cutoff of roughly 12+log(O/H) would be sufficient to reproduce the observed distribution, although they stressed that they could not distinguish between a sharp cutoff or a decreasing efficiency at producing GRBs as a function of decreasing host metallicity with their current data. This decreasing efficiency is more realistic than a sharp efficiency cutoff and, combined with the spread in the M-Z relationship, could explain the existence of outliers in Figures 6 and 7.
Metallicity gradients within galaxies also work to dilute observable evidence for a sharp metallicity cut-off in the galaxies that can harbor GRBs. The metallicities within disk galaxies tend to fall as a function of radius from the core (e.g. Kewley et al., 2005, and references therein) and as such the host integrated light represents an upper limit to the metallicity at the GRB location. The nearby galaxies that most closely resemble a typical GRB host galaxy at low for which we have spatially resolved spectroscopy are the Large and Small Magellanic Clouds, both of which have small internal dispersions of order 0.1 dex in oxygen abundance (Russell & Dopita, 1992). This value is common for star forming dwarf irregular galaxies in which metallicity gradients are rather negligible, although the internal dispersion as measured from HII regions in larger galaxies such as the Milky Way can be as high as 0.3 dex (Carigi et al., 2005; Esteban et al., 2005).
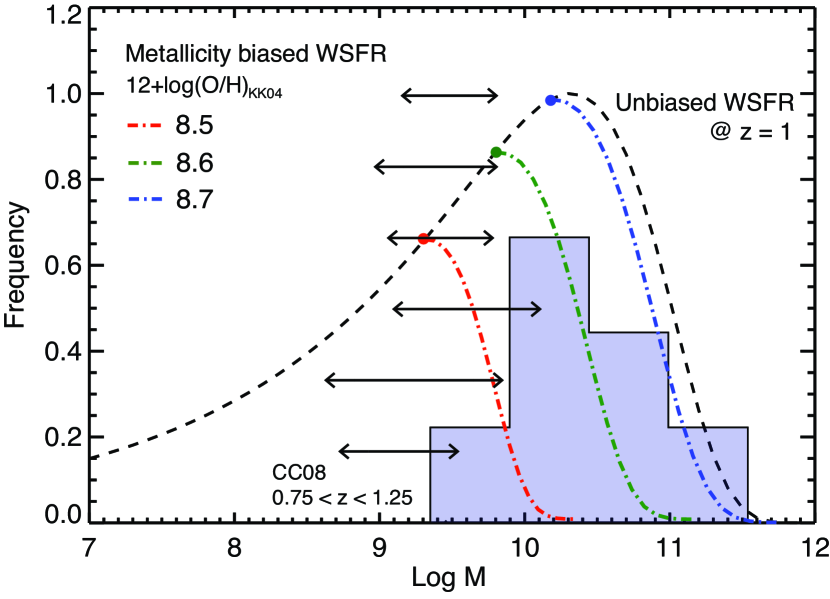
The combined effects of a smooth efficiency cutoff and this relatively small expected metallicity gradient on the GRB mass distribution are shown as dash-dotted lines in Figures 8 and 9. The upper mass limits due to sharp metallicity cut-offs are marked by the filled red, green, and blue dots as labeled. The dash-dotted lines proceeding each limit represents the unbiased WSFR distribution convolved with a smoothly broken power law decline in the efficiency of producing a GRB at a given metallicity, and hence stellar mass. Any effect of a metallicity gradient in a typical host galaxy would work to extend the peak of the Z-biased mass distribution to higher masses. We assumed that at low values, the cutoff efficiency is 1, transitioning sharply as to a power law decline of index . We believe that such a power-law index can accommodate the spread in allowable metallicities from both the effects of a declining efficiency and the small metallicity dispersion expected in GRB host galaxies.
In the context of these two effects, the resulting now can be understood as the peak in the predicted GRB host mass distribution at low redshift and not a sharp upper limit. As such, this smooth decrease in efficiency can accommodate host galaxies of much higher stellar mass than the scatter in the M-Z relationship alone. At a metallicity cut-off of 12+log(O/H), for example, galaxies of are permitted by the model (in relative abundance) whereas the scatter in the M-Z relationship with a sharp efficiency cut-off would strictly exclude galaxies above at a .
A cut-off of 12+log(O/H), or 1/2 , does contain most of the CC08 sample, although the low mass location of the peak in the SGB09 sample points to a systematic difference between the two samples. The two host samples have a total of 25 overlapping objects and CC08 discussed the differences between the two studies in some detail. They concluded that the higher median mass in their sample reflects a lower mass-to-light ratio obtained from the subset of galaxies for which they performed SED fits, compared to the average value obtained by SGB09 through SED fitting to their entire host sample. They also added that the use of optical-NIR SEDs by SGB09 may underestimate the effects of dust extinction for obscured galaxies, giving rise to further discrepancies.
We also note that CC08 used a traditional Salpeter IMF (Salpeter, 1955) to estimate the relative number of low mass, and hence undetected, stars within a galaxy, whereas SGB09 utilized a modified Salpeter IMF presented by Baldry & Glazebrook (2003). The host masses derived through the use of these two IMFs can differ substantially, as the traditional Salpeter IMF tends to overestimate the number of low-mass dwarf stars compared to updated models presented by Baldry & Glazebrook (2003), Kroupa (2001), and Bochanski (2008). We estimated that masses derived through the use of a Baldry Glazebrook IMF are systematically lower by roughly compared to those found through the use of a Salpeter IMF for a given mass-to-light ratio. This combined with the lower effective mass-to-light ratio used by SGB09 may explain the discrepancies between the two samples. It is important to note that Savaglio et al. (2005) explicitly used the Baldry Glazebrook IMF to obtain the M-Z relationship parameterization that we use in Equation 2, therefore their sample makes for a more meaningful comparisons to our model.
The effects of a metallicity bias in the GRB progenitor population combined with an evolving M-Z relationship would suggest that afterglow associations with massive galaxies of should be limited to high redshifts events. Unfortunately, very few host galaxies have measured masses above to test this directly, despite the median redshift of Swift detected GRBs of , highlighting the difficulty in observing many of these high redshift hosts. Despite this increase with redshift in the upper limit in the mass of galaxies capable of harboring a GRB, we find that an evolving galaxy populations in which dwarf galaxies represent a larger fraction of the star forming galaxies in the distance universe results in a median GRB host mass that remains fairly constant between Above , we see this upper limit fall sharply, implying that a large fraction of GRBs at high redshift will still occur in low mass galaxies.
Finally, if the normalization of the M-Z relationship for galaxies decreases as a function of lookback time, then there should be some redshift at which a metallicity biased galaxy populations would become indistinguishable from the star-forming field galaxy population. For a metallicity cutoff of 12+log(O/H), we find that the peak in the stellar mass distributions between these two populations should become equal at a redshift of , with the biased and unbiased populations becoming less distinguishable at higher redshifts. The greatest discrepancy between a metallicity biased host population at that of the population of all star forming field galaxies would occur at low to intermediate redshifts. This may explain the discrepancy between high redshift host properties reported by Chen et al. (2008) and Fynbo et al. (2008) and the properties reported by Wolf & Podsiadlowski (2007) for hosts at intermediate redshifts. Chen et al. (2008) found that the UV luminosity distribution of long GRB hosts is largely consistent with their being drawn from a UV luminosity weighted random galaxy population at similar redshifts. Fynbo et al. (2008) reported on similar agreements when comparing the luminosity and metallicity distributions of GRB hosts to UV-selected star forming galaxies at . This is in stark disagreement with the conclusions reported by Wolf & Podsiadlowski (2007) who find that a metallicity truncated field population is required to match the luminosity distribution of GRB host galaxies at redshifts of . This dichotomy between the high redshift and low redshift comparisons would be expected, if at some point, the two populations become indistinguishable as the average metallicity of the field galaxies falls with increasing lookback time.
6. Conclusions
We find that dearth of massive GRB host galaxies at low and intermediate redshifts exceeds that expected from the decline in the predicted number of massive star forming galaxies at similar redshifts. We therefore conclude that there is sufficient evidence to indicate that GRB host galaxies are metallically biased tracers of star formation at low and intermediate redshifts and suggest that this bias should disappear at higher redshifts due to the evolving metallicity content of the early universe. We find that a galaxy mass function that includes a smooth decrease in the efficiency of producing GRBs in galaxies of metallicity above 12+log(O/H)KK04 = 8.7 accommodates a majority of the measured host masses. This is in rough agreement with the metallicity cutoff found by Modjaz et al. (2008) of roughly 12+log(O/H) at low redshift (). Throughout our analysis, the modeling and subsequent metallicity comparisons have been performed in the same, consistent fashion and in the same metallicity calibration scale, in order to avoid any systematic differences between the various metallicity diagnostics used in the literature.
For a metallicity cut-off of 12+log(O/H), the predicted peak in the GRB host mass distribution and the stellar mass at which the weighted star formation rate peaks become equal at , with higher values of 12+log(O/H)cutoff pushing this intersection to lower redshift. This limits the redshift range in which the differences between a metallicity biased GRB host population and that of unbiased star forming galaxies can be tested through direct luminosity or mass distribution comparisons. Therefore, comparisons of these distributions at low and intermediate redshifts will be crucial to further inquires into the nature of the metallicity bias in the GRB host population.
References
- Asplund (2005) Asplund, M. 2005, ARA&A, 43, 481
- Baldry & Glazebrook (2003) Baldry, I. K., & Glazebrook, K. 2003, ApJ, 593, 258
- Bell et al. (2003) Bell, E. F., McIntosh, D. H., Katz, N., & Weinberg, M. D. 2003, ApJS, 149, 289
- Berger et al. (2003) Berger, E., Cowie, L. L., Kulkarni, S. R., Frail, D. A., Aussel, H., & Barger, A. J. 2003, ApJ, 588, 99
- Blanton et al. (2003) Blanton, M. R., Hogg, D. W., Bahcall, N. A., Brinkmann, J., Britton, M., Connolly, A. J., Csabai, I., Fukugita, M., Loveday, J., Meiksin, A., Munn, J. A., Nichol, R. C., Okamura, S., Quinn, T., Schneider, D. P., Shimasaku, K., Strauss, M. A., Tegmark, M., Vogeley, M. S., & Weinberg, D. H. 2003, ApJ, 592, 819
- Bloom (2003) Bloom, J. S. 2003, AJ, 125, 2865
- Bloom et al. (2002) Bloom, J. S., Kulkarni, S. R., & Djorgovski, S. G. 2002, AJ, 123, 1111
- Bochanski (2008) Bochanski, Jr., J. J. 2008, PhD thesis, University of Washington
- Brooks et al. (2007) Brooks, A. M., Governato, F., Booth, C. M., Willman, B., Gardner, J. P., Wadsley, J., Stinson, G., & Quinn, T. 2007, ApJ, 655, L17
- Brown et al. (2008) Brown, W. R., Kewley, L. J., & Geller, M. J. 2008, AJ, 135, 92
- Carigi et al. (2005) Carigi, L., Peimbert, M., Esteban, C., & García-Rojas, J. 2005, ApJ, 623, 213
- Castro Cerón et al. (2008) Castro Cerón, J. M., Michałowski, M. J., Hjorth, J., Malesani, D., Gorosabel, J., Watson, D., & Fynbo, J. P. U. 2008, ArXiv e-prints, 803
- Castro Cerón et al. (2006) Castro Cerón, J. M., Michałowski, M. J., Hjorth, J., Watson, D., Fynbo, J. P. U., & Gorosabel, J. 2006, ApJ, 653, L85
- Chary et al. (2002) Chary, R., Becklin, E. E., & Armus, L. 2002, ApJ, 566, 229
- Chen et al. (2008) Chen, H.-W., Perley, D. A., Pollack, L. K., Prochaska, J. X., Bloom, J. S., Dessauges-Zavadsky, M., Pettini, M., Lopez, S., Dall’Aglio, A., & Becker, G. D. 2008, ArXiv e-prints
- Christensen et al. (2004) Christensen, L., Hjorth, J., & Gorosabel, J. 2004, A&A, 425, 913
- Cole et al. (2001) Cole, S., Norberg, P., Baugh, C. M., Frenk, C. S., Bland-Hawthorn, J., Bridges, T., Cannon, R., Colless, M., Collins, C., Couch, W., Cross, N., Dalton, G., De Propris, R., Driver, S. P., Efstathiou, G., Ellis, R. S., Glazebrook, K., Jackson, C., Lahav, O., Lewis, I., Lumsden, S., Maddox, S., Madgwick, D., Peacock, J. A., Peterson, B. A., Sutherland, W., & Taylor, K. 2001, MNRAS, 326, 255
- Conselice et al. (2005) Conselice, C. J., Blackburne, J. A., & Papovich, C. 2005, ApJ, 620, 564
- Dalcanton (2007) Dalcanton, J. J. 2007, ApJ, 658, 941
- Dalcanton et al. (2004) Dalcanton, J. J., Yoachim, P., & Bernstein, R. A. 2004, ApJ, 608, 189
- de Rossi et al. (2007) de Rossi, M. E., Tissera, P. B., & Scannapieco, C. 2007, MNRAS, 374, 323
- Drory & Alvarez (2008) Drory, N., & Alvarez, M. 2008, ApJ, 680, 41
- Drory et al. (2005) Drory, N., Salvato, M., Gabasch, A., Bender, R., Hopp, U., Feulner, G., & Pannella, M. 2005, ApJ, 619, L131
- Erb et al. (2006) Erb, D. K., Shapley, A. E., Pettini, M., Steidel, C. C., Reddy, N. A., & Adelberger, K. L. 2006, ApJ, 644, 813
- Esteban et al. (2005) Esteban, C., García-Rojas, J., Peimbert, M., Peimbert, A., Ruiz, M. T., Rodríguez, M., & Carigi, L. 2005, ApJ, 618, L95
- Fazio et al. (2004) Fazio, G. G., Hora, J. L., Allen, L. E., Ashby, M. L. N., Barmby, P., Deutsch, L. K., Huang, J.-S., Kleiner, S., Marengo, M., Megeath, S. T., Melnick, G. J., Pahre, M. A., Patten, B. M., Polizotti, J., Smith, H. A., Taylor, R. S., Wang, Z., Willner, S. P., Hoffmann, W. F., Pipher, J. L., Forrest, W. J., McMurty, C. W., McCreight, C. R., McKelvey, M. E., McMurray, R. E., Koch, D. G., Moseley, S. H., Arendt, R. G., Mentzell, J. E., Marx, C. T., Losch, P., Mayman, P., Eichhorn, W., Krebs, D., Jhabvala, M., Gezari, D. Y., Fixsen, D. J., Flores, J., Shakoorzadeh, K., Jungo, R., Hakun, C., Workman, L., Karpati, G., Kichak, R., Whitley, R., Mann, S., Tollestrup, E. V., Eisenhardt, P., Stern, D., Gorjian, V., Bhattacharya, B., Carey, S., Nelson, B. O., Glaccum, W. J., Lacy, M., Lowrance, P. J., Laine, S., Reach, W. T., Stauffer, J. A., Surace, J. A., Wilson, G., Wright, E. L., Hoffman, A., Domingo, G., & Cohen, M. 2004, ApJS, 154, 10
- Feulner et al. (2005) Feulner, G., Gabasch, A., Salvato, M., Drory, N., Hopp, U., & Bender, R. 2005, ApJ, 633, L9
- Firmani et al. (2004) Firmani, C., Avila-Reese, V., Ghisellini, G., & Tutukov, A. V. 2004, ApJ, 611, 1033
- Fontana et al. (2004) Fontana, A., Pozzetti, L., Donnarumma, I., Renzini, A., Cimatti, A., Zamorani, G., Menci, N., Daddi, E., Giallongo, E., Mignoli, M., Perna, C., Salimbeni, S., Saracco, P., Broadhurst, T., Cristiani, S., D’Odorico, S., & Gilmozzi, R. 2004, A&A, 424, 23
- Fontana et al. (2006) Fontana, A., Salimbeni, S., Grazian, A., Giallongo, E., Pentericci, L., Nonino, M., Fontanot, F., Menci, N., Monaco, P., Cristiani, S., Vanzella, E., de Santis, C., & Gallozzi, S. 2006, A&A, 459, 745
- Fruchter et al. (2006) Fruchter, A. S., Levan, A. J., Strolger, L., Vreeswijk, P. M., Thorsett, S. E., Bersier, D., Burud, I., Castro Cerón, J. M., Castro-Tirado, A. J., Conselice, C., Dahlen, T., Ferguson, H. C., Fynbo, J. P. U., Garnavich, P. M., Gibbons, R. A., Gorosabel, J., Gull, T. R., Hjorth, J., Holland, S. T., Kouveliotou, C., Levay, Z., Livio, M., Metzger, M. R., Nugent, P. E., Petro, L., Pian, E., Rhoads, J. E., Riess, A. G., Sahu, K. C., Smette, A., Tanvir, N. R., Wijers, R. A. M. J., & Woosley, S. E. 2006, Nature, 441, 463
- Fruchter et al. (1999) Fruchter, A. S., Thorsett, S. E., Metzger, M. R., Sahu, K. C., Petro, L., Livio, M., Ferguson, H., Pian, E., Hogg, D. W., Galama, T., Gull, T. R., Kouveliotou, C., Macchetto, D., van Paradijs, J., Pedersen, H., & Smette, A. 1999, ApJ, 519, L13
- Fynbo et al. (2003) Fynbo, J. P. U., Jakobsson, P., Möller, P., Hjorth, J., Thomsen, B., Andersen, M. I., Fruchter, A. S., Gorosabel, J., Holland, S. T., Ledoux, C., Pedersen, H., Rhoads, J., Weidinger, M., & Wijers, R. A. M. J. 2003, A&A, 406, L63
- Fynbo et al. (2008) Fynbo, J. P. U., Prochaska, J. X., Sommer-Larsen, J., Dessauges-Zavadsky, M., & Møller, P. 2008, ApJ, 683, 321
- Fynbo et al. (2006) Fynbo, J. P. U., Starling, R. L. C., Ledoux, C., Wiersema, K., Thöne, C. C., Sollerman, J., Jakobsson, P., Hjorth, J., Watson, D., Vreeswijk, P. M., Møller, P., Rol, E., Gorosabel, J., Näränen, J., Wijers, R. A. M. J., Björnsson, G., Castro Cerón, J. M., Curran, P., Hartmann, D. H., Holland, S. T., Jensen, B. L., Levan, A. J., Limousin, M., Kouveliotou, C., Nelemans, G., Pedersen, K., Priddey, R. S., & Tanvir, N. R. 2006, A&A, 451, L47
- Gehrels et al. (2004) Gehrels, N., Chincarini, G., Giommi, P., Mason, K. O., Nousek, J. A., Wells, A. A., White, N. E., Barthelmy, S. D., Burrows, D. N., Cominsky, L. R., Hurley, K. C., Marshall, F. E., Mészáros, P., Roming, P. W. A., Angelini, L., Barbier, L. M., Belloni, T., Campana, S., Caraveo, P. A., Chester, M. M., Citterio, O., Cline, T. L., Cropper, M. S., Cummings, J. R., Dean, A. J., Feigelson, E. D., Fenimore, E. E., Frail, D. A., Fruchter, A. S., Garmire, G. P., Gendreau, K., Ghisellini, G., Greiner, J., Hill, J. E., Hunsberger, S. D., Krimm, H. A., Kulkarni, S. R., Kumar, P., Lebrun, F., Lloyd-Ronning, N. M., Markwardt, C. B., Mattson, B. J., Mushotzky, R. F., Norris, J. P., Osborne, J., Paczynski, B., Palmer, D. M., Park, H.-S., Parsons, A. M., Paul, J., Rees, M. J., Reynolds, C. S., Rhoads, J. E., Sasseen, T. P., Schaefer, B. E., Short, A. T., Smale, A. P., Smith, I. A., Stella, L., Tagliaferri, G., Takahashi, T., Tashiro, M., Townsley, L. K., Tueller, J., Turner, M. J. L., Vietri, M., Voges, W., Ward, M. J., Willingale, R., Zerbi, F. M., & Zhang, W. W. 2004, ApJ, 611, 1005
- Guetta & Piran (2007) Guetta, D., & Piran, T. 2007, Journal of Cosmology and Astro-Particle Physics, 7, 3
- Jakobsson et al. (2006) Jakobsson, P., Levan, A., Fynbo, J. P. U., Priddey, R., Hjorth, J., Tanvir, N., Watson, D., Jensen, B. L., Sollerman, J., Natarajan, P., Gorosabel, J., Castro Cerón, J. M., & Pedersen, K. 2006, in American Institute of Physics Conference Series, Vol. 836, Gamma-Ray Bursts in the Swift Era, ed. S. S. Holt, N. Gehrels, & J. A. Nousek, 552–557
- Kauffmann et al. (2004) Kauffmann, G., White, S. D. M., Heckman, T. M., Ménard, B., Brinchmann, J., Charlot, S., Tremonti, C., & Brinkmann, J. 2004, MNRAS, 353, 713
- Kennicutt (1998) Kennicutt, Jr., R. C. 1998, ApJ, 498, 541
- Kewley & Dopita (2002) Kewley, L. J., & Dopita, M. A. 2002, ApJS, 142, 35
- Kewley & Ellison (2008) Kewley, L. J., & Ellison, S. L. 2008, ApJ, 681, 1183
- Kewley et al. (2005) Kewley, L. J., Jansen, R. A., & Geller, M. J. 2005, PASP, 117, 227
- Kobayashi et al. (2007) Kobayashi, C., Springel, V., & White, S. D. M. 2007, MNRAS, 376, 1465
- Kobulnicky & Kewley (2004) Kobulnicky, H. A., & Kewley, L. J. 2004, ApJ, 617, 240
- Kocevski & Liang (2006) Kocevski, D., & Liang, E. 2006, ApJ, 642, 371
- Kroupa (2001) Kroupa, P. 2001, MNRAS, 322, 231
- Kudritzki & Puls (2000) Kudritzki, R.-P., & Puls, J. 2000, ARA&A, 38, 613
- Le Floc’h et al. (2003) Le Floc’h, E., Duc, P.-A., Mirabel, I. F., Sanders, D. B., Bosch, G., Diaz, R. J., Donzelli, C. J., Rodrigues, I., Courvoisier, T. J.-L., Greiner, J., Mereghetti, S., Melnick, J., Maza, J., & Minniti, D. 2003, A&A, 400, 499
- MacFadyen & Woosley (1999) MacFadyen, A. I., & Woosley, S. E. 1999, ApJ, 524, 262
- Maiolino et al. (2008) Maiolino, R., Nagao, T., Grazian, A., Cocchia, F., Marconi, A., Mannucci, F., Cimatti, A., Pipino, A., Ballero, S., Calura, F., Chiappini, C., Fontana, A., Granato, G. L., Matteucci, F., Pastorini, G., Pentericci, L., Risaliti, G., Salvati, M., & Silva, L. 2008, ArXiv e-prints, 806
- Margutti et al. (2007) Margutti, R., Chincarini, G., Covino, S., Tagliaferri, G., Campana, S., Della Valle, M., Filippenko, A. V., Fiore, F., Foley, R., Fugazza, D., Giommi, P., Malesani, D., Moretti, A., & Stella, L. 2007, A&A, 474, 815
- Martin & Kennicutt (2001) Martin, C. L., & Kennicutt, Jr., R. C. 2001, ApJ, 555, 301
- McGaugh (1991) McGaugh, S. S. 1991, ApJ, 380, 140
- Modjaz et al. (2008) Modjaz, M., Kewley, L., Kirshner, R. P., Stanek, K. Z., Challis, P., Garnavich, P. M., Greene, J. E., Kelly, P. L., & Prieto, J. L. 2008, AJ, 135, 1136
- Modjaz et al. (2006) Modjaz, M., Stanek, K. Z., Garnavich, P. M., Berlind, P., Blondin, S., Brown, W., Calkins, M., Challis, P., Diamond-Stanic, A. M., Hao, H., Hicken, M., Kirshner, R. P., & Prieto, J. L. 2006, ApJ, 645, L21
- Natarajan et al. (2005) Natarajan, P., Albanna, B., Hjorth, J., Ramirez-Ruiz, E., Tanvir, N., & Wijers, R. 2005, MNRAS, 364, L8
- Nuza et al. (2007) Nuza, S. E., Tissera, P. B., Pellizza, L. J., Lambas, D. G., Scannapieco, C., & de Rossi, M. E. 2007, MNRAS, 375, 665
- Pettini & Pagel (2004) Pettini, M., & Pagel, B. E. J. 2004, MNRAS, 348, L59
- Prochaska et al. (2004) Prochaska, J. X., Bloom, J. S., Chen, H.-W., Hurley, K. C., Melbourne, J., Dressler, A., Graham, J. R., Osip, D. J., & Vacca, W. D. 2004, ApJ, 611, 200
- Prochaska et al. (2007) Prochaska, J. X., Chen, H.-W., Dessauges-Zavadsky, M., & Bloom, J. S. 2007, ApJ, 666, 267
- Ramirez-Ruiz et al. (2002) Ramirez-Ruiz, E., Lazzati, D., & Blain, A. W. 2002, ApJ, 565, L9
- Russell & Dopita (1992) Russell, S. C., & Dopita, M. A. 1992, ApJ, 384, 508
- Salpeter (1955) Salpeter, E. E. 1955, ApJ, 121, 161
- Savaglio et al. (2003) Savaglio, S., Fall, S. M., & Fiore, F. 2003, ApJ, 585, 638
- Savaglio et al. (2005) Savaglio, S., Glazebrook, K., Le Borgne, D., Juneau, S., Abraham, R. G., Chen, H.-W., Crampton, D., McCarthy, P. J., Carlberg, R. G., Marzke, R. O., Roth, K., Jørgensen, I., & Murowinski, R. 2005, ApJ, 635, 260
- Savaglio et al. (2009) Savaglio, S., Glazebrook, K., & LeBorgne, D. 2009, ApJ, 691, 182
- Schmidt (1963) Schmidt, M. 1963, ApJ, 137, 758
- Searle & Sargent (1972) Searle, L., & Sargent, W. L. W. 1972, ApJ, 173, 25
- Shapley et al. (2004) Shapley, A. E., Erb, D. K., Pettini, M., Steidel, C. C., & Adelberger, K. L. 2004, ApJ, 612, 108
- Sollerman et al. (2005) Sollerman, J., Östlin, G., Fynbo, J. P. U., Hjorth, J., Fruchter, A., & Pedersen, K. 2005, New Astronomy, 11, 103
- Stanek et al. (2006) Stanek, K. Z., Gnedin, O. Y., Beacom, J. F., Gould, A. P., Johnson, J. A., Kollmeier, J. A., Modjaz, M., Pinsonneault, M. H., Pogge, R., & Weinberg, D. H. 2006, Acta Astronomica, 56, 333
- Tanvir et al. (2004) Tanvir, N. R., Barnard, V. E., Blain, A. W., Fruchter, A. S., Kouveliotou, C., Natarajan, P., Ramirez-Ruiz, E., Rol, E., Smith, I. A., Tilanus, R. P. J., & Wijers, R. A. M. J. 2004, MNRAS, 352, 1073
- Tassis et al. (2008) Tassis, K., Kravtsov, A. V., & Gnedin, N. Y. 2008, ApJ, 672, 888
- Thöne et al. (2007) Thöne, C. C., Greiner, J., Savaglio, S., & Jehin, E. 2007, ApJ, 671, 628
- Tremonti et al. (2004) Tremonti, C. A., Heckman, T. M., Kauffmann, G., Brinchmann, J., Charlot, S., White, S. D. M., Seibert, M., Peng, E. W., Schlegel, D. J., Uomoto, A., Fukugita, M., & Brinkmann, J. 2004, ApJ, 613, 898
- Vink & de Koter (2005) Vink, J. S., & de Koter, A. 2005, A&A, 442, 587
- Werner et al. (2004) Werner, M. W., Roellig, T. L., Low, F. J., Rieke, G. H., Rieke, M., Hoffmann, W. F., Young, E., Houck, J. R., Brandl, B., Fazio, G. G., Hora, J. L., Gehrz, R. D., Helou, G., Soifer, B. T., Stauffer, J., Keene, J., Eisenhardt, P., Gallagher, D., Gautier, T. N., Irace, W., Lawrence, C. R., Simmons, L., Van Cleve, J. E., Jura, M., Wright, E. L., & Cruikshank, D. P. 2004, ApJS, 154, 1
- Wiersema et al. (2007) Wiersema, K., Savaglio, S., Vreeswijk, P. M., Ellison, S. L., Ledoux, C., Yoon, S.-C., Møller, P., Sollerman, J., Fynbo, J. P. U., Pian, E., Starling, R. L. C., & Wijers, R. A. M. J. 2007, A&A, 464, 529
- Wolf & Podsiadlowski (2007) Wolf, C., & Podsiadlowski, P. 2007, MNRAS, 375, 1049
- Woosley (1993) Woosley, S. E. 1993, ApJ, 405, 273
- Woosley & Bloom (2006) Woosley, S. E., & Bloom, J. S. 2006, ARA&A, 44, 507
- Woosley & Heger (2006) Woosley, S. E., & Heger, A. 2006, ApJ, 637, 914
- Yoon & Langer (2005) Yoon, S.-C., & Langer, N. 2005, A&A, 443, 643