present address: ]Laboratoire de Sciences et Génie des Matériaux et de Métallurgie, UMR 7584 CNRS-INPL, Ecole des Mines, Parc de Saurupt 54042 Nancy Cedex, France
Magnetic and Electrical Properties of DHCP NpPd3 and (U1-xNpx)Pd3
Abstract
We have made an extensive study of the magnetic and electrical properties of double-hexagonal close-packed (DHCP) NpPd3 and a range of (U1-xNpx)Pd3 compounds with and using magnetisation, magnetic susceptibility, electrical resistivity and heat capacity measurements on polycrystalline samples, performed in the temperature range K and in magnetic fields up to 9 T. Two transitions are observed in NpPd3 at K and 30 K. Dilute Np samples () exhibit quadrupolar transitions, with the transition temperatures reduced from those of pure UPd3.
pacs:
75.30.-m, 75.40.Cx, 75.50.-y, 75.50.EeI Introduction
The magnetism of (lanthanide) metallic systems has been studied extensively for several decades. The standard localised moment model of rare earth magnetism, as expounded by Jensen and MackintoshJensen and Mackintosh (1991), remains the foundation for explaining the magnetic and electrical properties of almost all such materials, with the exception of cerium and its compounds, where band and hybridisation effects play a crucial role. In (actinide) metallic systems, the -electron wave functions are distinctly more extended than in the corresponding systems, leading to a more itinerant-like nature as manifested by their magnetic and electrical behaviour. Actinide systems display a unique complexity within the periodic table, exhibiting a rich variety of phenomena such as heavy-fermion and non-Fermi liquid behaviour, and unconventional superconductivity. Most uranium metallic compounds have the U3+ configuration and exhibit itinerant-like properties. In contrast, UPd3 shows the U4+ configuration, and is a rare example of a localised moment uranium intermetallic compound. In this context, we recall Zwicknagl and Fulde’s theoryZwicknagl and Fulde (2003) of the dual nature of -electrons in uranium compounds: they interpret the behaviour of systems such as UPt3 in terms of two electrons being localised and one being itinerant.
Due to the inherent difficulties in handling neptunium, relatively few neptunium compounds have been studied. A principal motivation for the work presented in this paper has been to explore the magnetic and electrical properties of NpPd3 with the aim of comparing them with those of UPd3, and to examine the effect of a dilute substitution of U by Np on the unusual behaviour of UPd3.
Numerous studies of UPd3, both macroscopic (heat capacity Zochowski et al. (1995); Tokiwa et al. (2001), susceptibilityMcEwen et al. (2003), thermal expansionZochowski and McEwen (1994), ultrasonicsLingg et al. (1999)) and microscopic (neutronMcEwen et al. (1998) and X-ray diffractionMcMorrow et al. (2001)), indicate 4 phase transitions below K. These have been attributed to a series of antiferroquadrupolar (AFQ) orderings of the U electrons. However, a detailed understanding of the origin of these transitions has been a challenge for many years, but a new proposed crystal field scheme McEwen et al. (2003) has been able to explain the existence of the 4 transitions and new X-ray resonant scattering experiments have revealed the order parameters of one of the AFQ phases Walker et al. (2006); McEwen et al. (2007). In comparison very little has been published on the neptunium analogue DHCP . Its magnetic properties were first examined 30 years ago by Nellis et al. Nellis et al. (1974), but several questions remain unanswered in relation to the nature of the ordering. As far as the present authors are aware, there has been no further research until our own work, and we report here a systematic study of the magnetisation, magnetic susceptibility, electrical resistivity and heat capacity of NpPd3. Given the very similar lattice parameters between the isostructural U and Np compounds we have anticipated complete solid solubility from UPd3 to NpPd3, and the very small difference in ionic radii should lead to little induced strain. This has enabled us to investigate the perturbation of the quadrupolar structures of UPd3 by substitution of Np on some U sites, whilst looking to explain the nature of the ordering previously observed in NpPd3.
II Experimental Details
Polycrystalline samples of DHCP (U1-xNpx)Pd3 with , 0.01, 0.02, 0.05, 0.50 and 1 were prepared at the Institute for Transuranium Elements, by arc melting stoichiometric amounts of the constituent elements in a high purity argon environment on a water cooled copper hearth using a Zr getter. We used Pd of purity, whilst our U and Np was of purity. Quantitative analysis of the impurities, including the oxygen content, was not available to us. The resultant ingots were repeatedly turned and remelted, before they were annealed at C for one week to ensure phase homogeneity. This is important as pure NpPd3 is known to exist in two phases: DHCP and cubic with the AuCu3-type structure Nellis et al. (1974); the latter allotrope orders antiferromagnetically at K. No weight losses were observed during the arc melting and annealing processes, and given the low vapour pressures of U, Np and Pd metals, the error bars on the sample compositions are very small and correspond to the precision of the balance used in the element weighing procedure, e.g. an error of 3/1000 in weight and hence 4/1000 in atomic percent. The phase purity of the samples was checked using room temperature X-ray powder diffraction (Cu radiation) on a Bragg-Brentano D-500 diffractometer. A Rietveld-type full refinement of the data proves that all the samples have the DHCP structure. The lattice parameters of all the compounds are given in Table 1, and the cell volume and c-axis parameter of (U1-xNpx)Pd3 as a function of are plotted in Figure 1. Interestingly, the cell volume rapidly increases with the addition of just neptunium before decreasing with further neptunium doping. This is not the standard behaviour and violates Vegard’s law Vegard (1921).
| Compound | Unit cell dimensions in Å (esd) | Cell Volume in Å3 | |||
|---|---|---|---|---|---|
| a | c | c/a | |||
| UPd3 | 5.765 | 9.545 | 1.656 | 274.7 | This work |
| 5.775 | 9.654 | 1.672 | 278.8 | U rich Kleykamp and Kang (1991) | |
| 5.763 | 9.542 | 1.656 | 274.5 | Pd rich Kleykamp and Kang (1991) | |
| 5.757 | 9.621 | 1.671 | 276.1 | Heal & WilliamsHeal and Williams (1955) | |
| 5.769 | 9.652 | 1.673 | 278.2 | McEwen et al.McEwen et al. (1988) | |
| 1%Np | 5.769 | 9.635 | 1.670 | 277.7 | |
| 2%Np | 5.768 | 9.631 | 1.670 | 277.5 | |
| 5%Np | 5.766 | 9.623 | 1.669 | 277.1 | |
| 50%Np | 5.774 | 9.576 | 1.658 | 276.4 | |
| NpPd3 | 5.765 | 9.545 | 1.656 | 274.7 | This work |
| 5.767 | 9.544 | 1.655 | 274.9 | Nellis et al.Nellis et al. (1974) | |
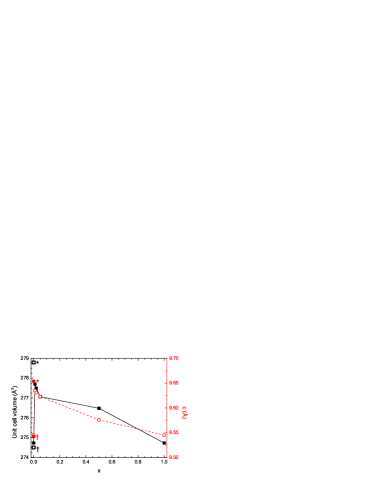
Also given in Table 1 are additional values for the lattice parameters of UPd3 from the literature, reflecting the observation of a homogeneity range around the exact UPd3 composition: to atomic percent uranium Kleykamp and Kang (1991), which affects the lattice parameters significantly. Based on these measurements it could appear that our UPd3 sample is slightly palladium rich. However, since the mixed actinide samples were synthesised using the UPd3 and NpPd3 samples as starting materials, in the correct stoichiometric ratios, any uranium deficiency affecting the UPd3 lattice parameters should be preserved through the different composition samples. The sharp deviation from a linear trend at low neptunium concentrations may be possible evidence of a change in the valence state of uranium.
X-ray powder diffraction is unable, however, to show how the dopant atoms sit within the host crystal structure. We therefore do not know whether the Np atoms in (U1-xNpx)Pd3 are randomly distributed over the two U sites (one locally hexagonal and the other quasi-cubic) or whether they are located preferentially on one of the symmetry type sites. An X-ray absorption spectroscopy experiment is planned to look at the local configuration of the Np atoms.
Measurements were made on encapsulated samples at ITU. Magnetic studies were carried out for K and in fields up to 7 T using a superconducting quantum interference device (SQUID) magnetometer (Quantum Design MPMS-7). 4-point (pressure contacts) AC probe electrical resistivity measurements were made using a Quantum Design PPMS-9 for K in a range of fields up to 9 T. Additional low temperature measurements were obtained using 2 coupled cryopump devices (3HeHe). Self heating effects make it difficult to cool samples containing neptunium below 400 mK. Heat capacity measurements were made also using the PPMS-9 via the hybrid adiabatic relaxation method on both the (U1-xNpx)Pd3 samples and a sample of ThPd3, to be used as an isostructural phonon blank. Using a 3He refrigeration insert, measurements could be made over a range of K, in fields up to 9 T. Contributions to the measured heat capacity from the sample platform including the grease were measured separately and subtracted from the total. The heat capacity of the sample coating, stycast 2850 FT, is well known Javorský et al. (2005) and was subtracted off from the total heat capacity.
Hereafter the solid solutions investigated in this paper will be identified, for ease and clarity, by the percentage neptunium doping, for example 25%Np would refer to (U0.75Np0.25)Pd3.
III Magnetic Properties
III.1 NpPd3
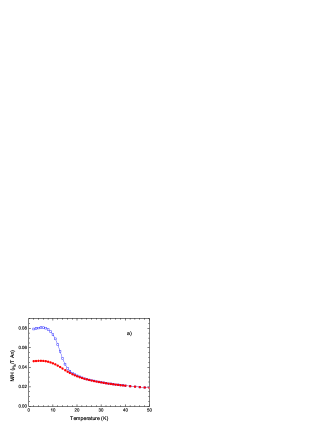
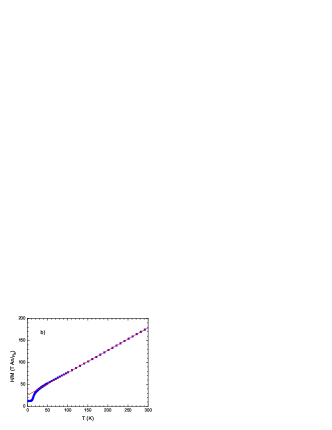
In NpPd3, in low applied magnetic fields: 0.03 T and 1.1 T, (defined here for convenience as the magnetic susceptibility) shows a sharp increase below 35 K to a broad maximum centred at 20 K, as previously reported Nellis et al. (1974). However, in addition we observe a shoulder at 10 K. In higher fields of 4 T and 7 T, the form of changes such that the 10 K feature becomes more pronounced, see Figure 2.
The 10 and 30 K anomalies could be attributed to two antiferromagnetic transitions; these might occur separately on the locally hexagonal and quasi-cubic sites, similar to the transitions observed in neodymium Roberts et al. (1999), or successively on only one of the site types, as in praseodymium McEwen and Stirling (1981). Whilst an increase of may be indicative of a ferromagnetic component, it is not inconsistent with the increases in seen at the successive antiferroquadrupolar transitions in UPd3 McEwen et al. (2007). Interestingly, no difference was seen in the neutron diffraction patterns measured for dhcp NpPd3 at K and K Nellis et al. (1974), which could be consistent with the higher temperature transition being to a quadrupolar phase. This would result in a relatively high quadrupolar temperature, considerably higher than those in UPd3, but comparable to that for DyB2C2: KYamauchi et al. (1999) and for NpO2: KPaixão et al. (2002); com . However, the observed absence of magnetic Bragg peaks at 4.2 K suggested that there is no long range magnetic order, which is inconsistent with our proposed antiferromagnetic transition at 10 K.
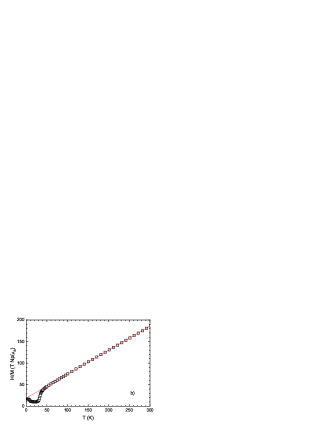
The transition at K is seen more clearly in the inverse susceptibility, see Fig. 2 . Above K the inverse susceptibility follows a Curie-Weiss law, with an effective magnetic moment of per Np atom deduced from a series of measurements made in 1.1 T and 4 T. This suggests that Np is trivalent in this compound, since in the Russell-Saunders coupling scheme the moment value one would expect for a electron configuration is , whereas if Np was tetravalent, as U is in UPd3, the expected moment would be . Within the intermediate coupling scheme, which given the high atomic mass of the neptunium may be more appropriate, the expected moment for trivalent Np is 2.755 /Np ion, and tetravalent Np is 3.682 /Np ion Fournier (1985), which again supports our conclusion that Np is trivalent in NpPd3.
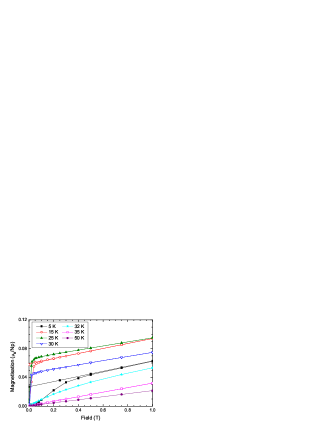
The isothermal magnetization, Figure 3, measured after cooling the sample in zero field, below 30 K increases rapidly in low fields before increasing more slowly and linearly. On reducing the field, hysteresis is observed below T, with a maximum residual ferromagnetic moment of /Np atom at K. Below the 10 K transition, hysteresis is observed up to 0.5 T but with a reduced residual ferromagnetic moment. At 7 T the maximum moment was per Np atom. The absence of saturation in 7 T and the low remanent magnetisation, if intrinsic properties, may indicate that the structure below 30 K contains a small ferrimagnetic moment. An alternative explanation is the presence of some ferromagnetic impurity phase, but the measurements made in constant applied magnetic field appear to rule out either carbides or nitrides, commonly occurring ferromagnetic impurities in other systems, and the X-ray powder diffraction data shows the high purity of the sample phase. Nevertheless, a impurity of an unidentified neptunium compound with a moment of 3 /Np would produce such a residual moment, and our X-ray powder diffraction measurements cannot preclude such a possibility. However, we note that no other Np-Pd binary compound has yet been reported.
Since neptunium is Mössbauer active one might envisage measuring the Mössbauer spectra to learn more about the magnetic properties of NpPd3. However, the data from previous experimentsNellis et al. (1974); Gal et al. (1973) have proved difficult to interpret. Although paramagnetic line broadening was observed below the 30 K transition, at 4.2 K the data could not be fitted, even using two hyperfine patterns taking into account the two inequivalent neptunium sites.
III.2 (U0.5Np0.5)Pd3
The 50%Np data, Figure 4 qualitatively resembles that for pure NpPd3 shifted down in temperature, such that there is a sharp rise below 15 K to a broad maximum centred at K. In the data the transition is seen clearly at 15 K, while above the transition the data is linear exhibiting Curie-Weiss behaviour, Figure 4. Curie-Weiss fits to a series of data sets measured in 1.1 T and 4 T give an effective paramagnetic moment of per actinide ion. Hysteresis is observed in magnetisation measurements as a function of applied magnetic field while saturation is absent. Below 15 K the field below which hysteresis is observed increases with decreasing temperature to 1 T at 2 K. The maximum residual ferromagnetic moment is /An. Again we have not been able to distinguish whether it is an intrinsic ferrimagnetic effect or if it is due to a very small quantity of an impurity phase with a large ferromagnetic moment. However, if it is assumed that the residual ferromagnetic moment measured from the NpPd3 sample was the result of a 2% unidentifed magnetic impurity phase, in this 50%Np sample, which was produced using the NpPd3 sample, the impurity phase should only make up 1% of the total mass, and therefore one would have expected the residual ferromagnetic moment to have halved, instead of only being reduced by a sixth.
III.3 Dilute Np samples,
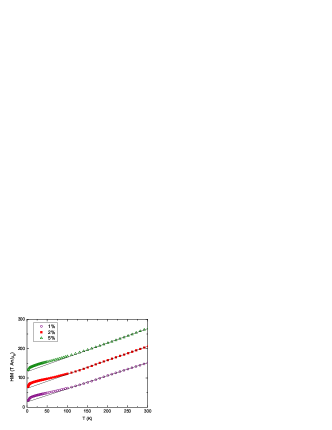
The 5, 2 and 1%Np magnetic measurements show no clear evidence of a magnetic transition, and there is no evidence of hysteresis in the isothermal magnetisation data. Above 100 K, follows a modified Curie-Weiss law for the 5%Np sample, possibly indicative of a singlet ground state with a large energy gap to the first excited state, giving an effective paramagnetic moment of per actinide ion. Fits to a Curie-Weiss law for the 2% and 1%Np samples above 100 and 150 K give effective paramagnetic moments of and per actinide ion respectively, and are shown in Figure 5.
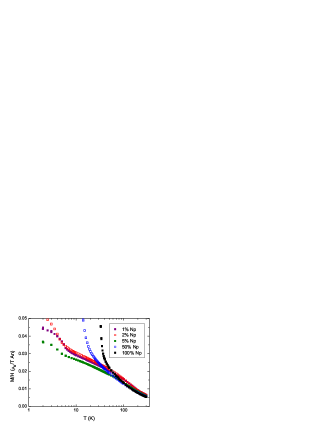
Plotting the data for all the different samples: NpPd3, 50%Np, 5%Np, 2%Np and 1%Np, as a function of temperature on a logarithmic plot, Figure 6, shows that the 5%Np data approximately follows a negative logarithmic trend. This can be characteristic of non-Fermi Liquid behaviour. It is also interesting to note that the value of at K is a minimum for , with the value increasing as a function of moving away from this composition towards both the more dilute and more concentrated regions of the phase diagram.
| Compound | Magnetic ordering temperatures (K) | (/An ion) | (K) |
|---|---|---|---|
| UPd3 | - | ||
| 1%Np | - | ||
| 2%Np | - | ||
| 5%Np | - | ||
| 50%Np | (12) | ||
| NpPd3 | 10 (30) |
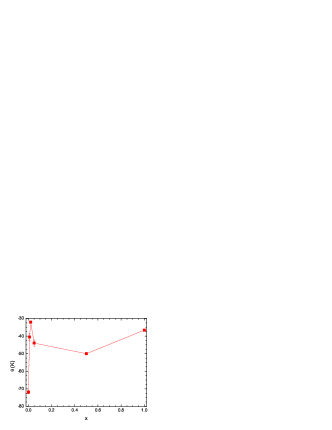
Figure 7 shows how the Curie-Weiss temperature , obtained from Curie-Weiss fits to the high temperature data and tabulated in Table 2, varies as a function of the neptunium concentration in (U1-xNpx)Pd3. The data point for was obtained from an appropriate average () of the single crystal data McEwen et al. (2003). The sharp change in with low neptunium doping is very unusual. The behaviour may be associated with the dramatic change in the lattice parameters, Figure 1. One possibility is that the addition of a small quantity of Np leads to a sharp change in the cohesive energy, and hence the lattice constants, and the exchange interaction, which is dependent on the conduction electrons, may be very sensitive to the lattice spacing due to changing bands near the Fermi level.
IV Electrical Resistivity
IV.1 NpPd3
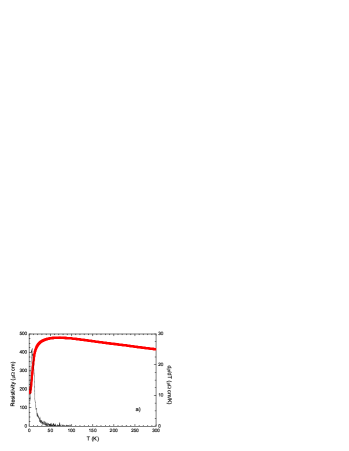
In NpPd3 in zero field the electrical resistivity shows two anomalies, at K and 30 K, corresponding to the transitions seen in the magnetisation data. Below 300 K the resistivity increases with decreasing temperature, see Figure 8, following a Kondo-like behaviour:
| (1) |
until 30 K, when it drops dramatically with the onset of coherent scattering. In heavy fermion materials Kondo behaviour is commonly observed in the form of a maximum in the resistivity at a temperature , which is a function of the Kondo temperature and the mean RKKY interaction strength between the magnetic ionsSchilling (1986), rather than as a low temperature resistivity minimum. For example, the resistivity of NpRu2Si2 is similar to that of NpPd3 displaying a logarithmic variation with T above the ordering temperature, 27.5 K, and a precipitous drop below understood as a huge magnetic contribution of an energy gap antiferromagnetWastin et al. (1997). It is interesting that the higher temperature transition observed in magnetisation measurements should coincide with .

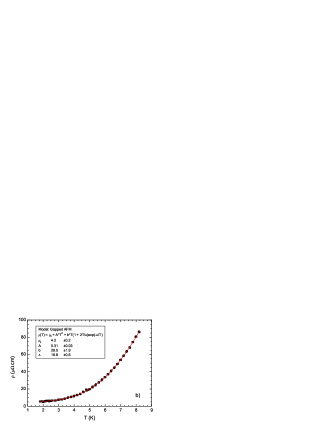
The low temperature resistivity below 10 K does not vary as a simple Fermi Liquid , but instead behaves as an antiferromagnet with an energy gap :
| (2) |
see Figure 8. The fit to the T data indicates K. The residual resistivity ratio given by is , showing the high quality of the sample.
When a 9 T field is applied, the feature associated with the higher temperature transition is smoothed away, while that of the lower transition becomes more pronounced and shifts down in temperature, consistent with an antiferromagnetic transition, see Figure 9. Below the transition the 9 T data still behaves as a gapped antiferromagnet but the parameters given by the fit are modified to cm/K2 and K.
IV.2 (U0.5Np0.5)Pd3
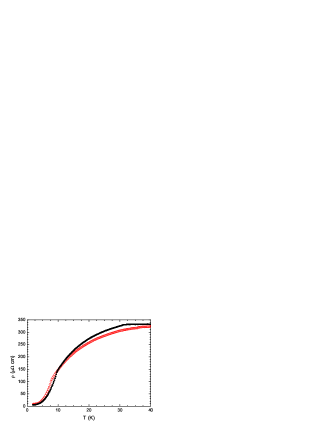
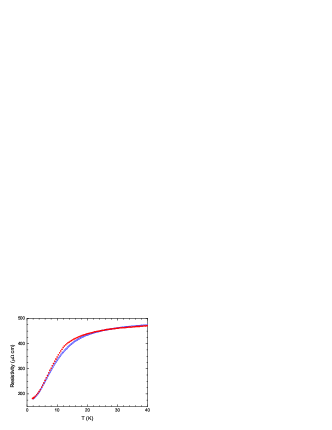
Again, for the 50%Np sample, the high temperature resistance has a negative gradient, displaying a Kondo-like behaviour, Figure 10. However the onset of coherence is not so sharp, varying over a broader range of temperatures, and is not associated with a transition temperature deduced from the magnetic measurements. The low temperature resistivity varies as , with a residual resistivity of , Figure 10. This is some two orders of magnitude larger than in pure NpPd3, which we attribute to the statistical disorder introduced with the uranium atoms. As shown in Figure 11, a kink is observed in the zero field resistivity at K, which is smoothed away in a 9 T field.
IV.3 (U0.95Np0.05)Pd3
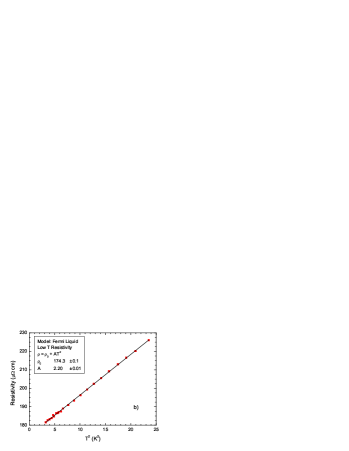
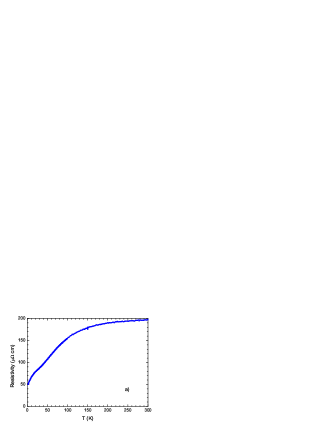
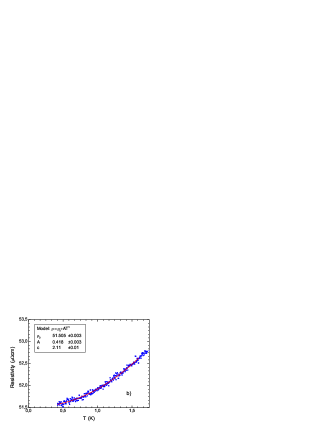
The electrical resistivity of the 5%Np sample is markedly different from the 50% and 100%Np samples showing no Kondo-like behaviour at high temperatures, Figure 12. This raises the possibility that the degree of electron localisation is varying as we move across the phase diagram as a function of neptunium concentration. Application of a 9 T field has little effect on the resistivity. Initial resistivity measurements performed down to 2 K suggested a linear temperature dependence for K. However, when we extended these measurements to lower temperatures using the coupled cryopump system, a fit to the data indicated that below 1.6 K the resistivity is quadratic in temperature, Figure 12, indicating that at the lowest temperatures (U0.95Np0.05)Pd3 is a Fermi liquid.
V Heat Capacity
V.1 NpPd3
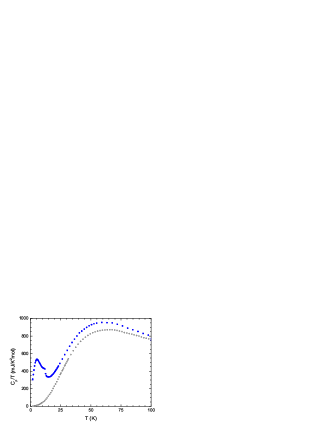
In zero field, heat capacity measurements of NpPd3 reveal two clear lambda anomalies at and 30 K, Figure 13. Making a fit to the low temperature data gives the electronic heat capacity, mJK-2mol-1, and hence a Kadowaki-Woods Ratio of cm(molK/mJ)2, indicating that NpPd3 is possibly a moderately heavy Fermion material. However, estimating is complicated by the significant curvature due to the lambda feature at 10 K, such that this value for the electronic heat capacity corresponds to a fit: which gives a value for such that the Debye temperature would be 61 K, which is clearly too low.
In increasing applied magnetic fields the anomaly associated with the 10 K transition shifts down in temperature, in agreement with the behaviour expected from an antiferromagnetic transition. The feature also decreases in size until T after which it sharpens and increases in magnitude, behaviour which is as yet not explained. The application of a 1 T field broadens the higher temperature transition feature and shifts it up in temperature by K, while in fields greater than 4 T the feature has been smoothed away. These are not the characteristics of an antiferromagnetic phase transition, however this could be consistent with a quadrupolar transition.
We have measured the heat capacity of ThPd3 under identical experimental conditions. Using this isostructural non-magnetic compound as a phonon blank, the magnetic entropy of NpPd3 has been calculated. It reaches at 40 K, which suggests low lying excited doublet crystal field states above ground state doublets on both the locally hexagonal and quasi-cubic sites.
V.2 (U0.5Np0.5)Pd3
The heat capacity data for 50%Np shows no lambda-like anomalies. Instead, inspection of Figure 14 reveals a shoulder kink at 12 K in zero field in , corresponding to the temperature at which features are observed in the magnetisation and resistivity measurements, and a broad peak centred on 5 K. No features are seen at 5 K in the susceptibility or resistivity measurements in this composition. This may be the Schottky peak arising from the splitting of the ground state doublet in the molecular field below the 12 K ordering temperature. Application of a 2 T field smoothes away the 12 K feature, while fields up to 9 T make the 5 K peak slightly narrower, but it does not change in magnitude.
The curvature of down to 2 K is such that it is very difficult to make an estimate for the electronic heat capacity. It is quite possible that there is another transition below 2 K, but neglecting this possibility and extrapolating the data down to zero temperature suggests that is in the region of mJK-2mol-1, considerably larger than that for NpPd3 or UPd3. This results in a value of cm(molK/mJ)2, which may indicate that 50% Np is another heavy fermion material. A possible explanation is that the Np doping induces a valence change on the U ions leading to a lowering of the Fermi Energy closer to the f bands, resulting in a greater deal of hybridization and hence heavy fermion behaviour. Without an accurate estimate for it is not possible to calculate accurately the magnetic entropy of the sample.
V.3 (U0.95Np0.05)Pd3
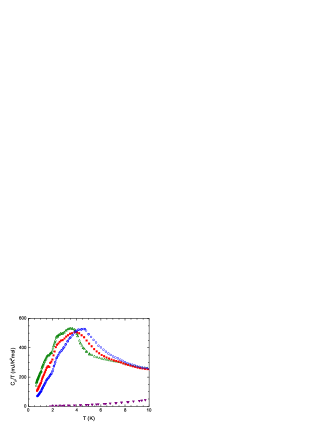
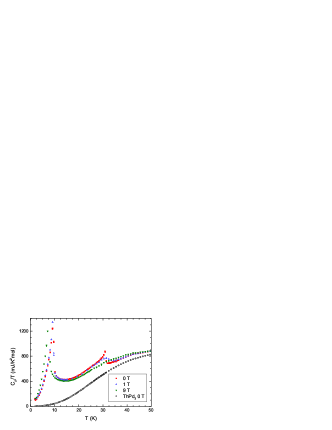
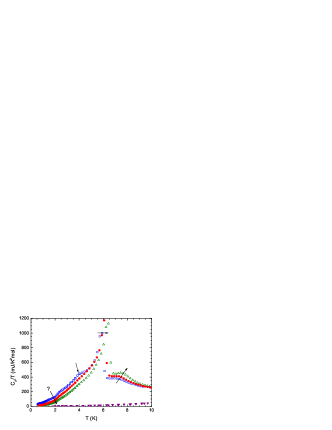
Initial measurements of 5%Np in zero field showed a broad rounded peak centred on 3.5 K with a value of mJK-2mol-1 at 2 K. The significant curvature at this temperature made extrapolating back to K very difficult. So to determine whether there are additional transitions which lead to a reduced estimate for , or whether this is another heavy fermion, as might be associated with proximity to a quantum critical point due to the suppression of a quadrupolar transition to zero temperature, additional measurements were performed using a 3He insert. These revealed the existence of more features in the data at 2.5 K and 1.5 K, which may be associated with further transitions, see Figure 15. The presence of the transitions at such low temperatures makes estimating very difficult, but assuming there are no further transitions and continuing the trend in gives an estimate of mJ/K2mol. This results in a Kadowaki-Woods ratio of cm.(mol.K/mJ)2, indicating that the compound may also be a heavy fermion. Application of increasing magnetic fields results in the features shifting up in temperature. Such behaviour is either indicative of ferromagnetic transitions, in which field reinforces the magnetic structure, or quadrupolar transitions. Since no hysteresis is seen in the magnetisation down to 2 K, ferromagnetism has been excluded as a possible explanation.
V.4 (U1-xNpx)Pd3,
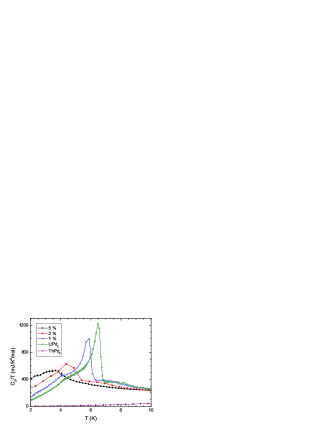
As one can see in Figure 16, the heat capacity of 2%Np and 1%Np shows strong similarities to the data for UPd3 Walker et al. (2006). This observation is difficult to reconcile with the hypothesis that the uranium valence is changing with low neptunium doping, as postulated from the anomalous behaviour of the lattice parameters as shown in Figure 1 and discussed in Section II. It is also clear that the heat capacity of ThPd3 below 10 K is much less than in the analogues. The 2%Np data have a peak at K and a shoulder at 7 K, features qualitatively similar to those at 6.5 and 7.8 K in polycrystalline UPd3, though the peak is approximately half the size in 2%Np. When a field is applied the features relating to the transitions shift up in temperature, such that in T the peak is at 5.5 K. In addition the shoulder becomes more pronounced with increasing field. The 1%Np data, including additional measurements made using a 3He insert, is shown in more detail in Figure 17, revealing transitions at 4, 6 and 7.3 K, which may be labelled as , and using the nomenclature for UPd3 Walker et al. (2006). There is another feature in the data at 2 K, which remains almost unchanged with increasing applied magnetic field. The origin of this feature is as yet unresolved. As for the 5%Np sample, the positive shift of features in temperature with field for 1% and 2%Np samples without hysteresis observed in magnetisation measurements, in combination with their qualitative resemblance to those in UPd3, leads us to believe that these are transitions to quadrupolar phases.
VI Conclusions
In conclusion, magnetisation, electrical resistivity and heat capacity measurements reveal two transitions in dhcp NpPd3 at K and K. The in-field behaviour of the features associated with the transition in different measurements indicates that it is most probably an antiferromagnetic transition. The transition is that which was observed in the previous experiments by Nellis et al., Nellis et al. (1974) but unattributed. It has proved more difficult using the current polycrystalline bulk property experimental data to assign the nature of this transition. Initially, based on the magnetisation data, was also assessed as being an antiferromagnetic transition Walker et al. (2005); however, the in-field behaviour seen in resistivity and heat capacity results is inconsistent with such a conclusion. The smoothing away of the features with increasing field is more reminiscent of a quadrupolar transition. Interestingly the transition is at in the resistivity data, which shows high temperature Kondo behaviour.
We plan to use neutron scattering to try to determine the nature of the two transitions. The previous diffraction experiment Nellis et al. (1974) observed no additional peaks at 4.2 K. However, the experiment was performed on a very small quantity of polycrystalline NpPd3 with poor instrumental flux and resolution. With the immense improvements in neutron sources and instrumentation that have taken place over the past thirty years we are confident that new diffraction data below 10 K will provide information about the ordering vector of the antiferromagnetic phase. Measurements in the phase between the two transitions at K and 30 K will be particularly interesting, since the absence of magnetic Bragg peaks would point to a non-magnetic origin for the transition at 30 K. Neutrons do not couple directly to quadrupole moments, but instead we may observe a lattice modulation vector associated with an induced lattice distortion as is seen in UPd3. Polarised neutron diffraction techniques may be used to follow the individual susceptibilities of the hexagonal and quasi-cubic sites to distinguish between magnetic moments ordering on the different site types successively or simultaneously.
Our magnetic susceptibility measurements have demonstrated that neptunium is trivalent in NpPd3 in contrast to uranium which is tetravalent in UPd3, indicating a valence transition moving across the phase diagram. This underlines the unusual properties of UPd3 since uranium is most commonly trivalent and raises the possibility of a tendency towards a valence instability, such that a critical percentage neptunium doping could induce a valence change on the uranium ion.
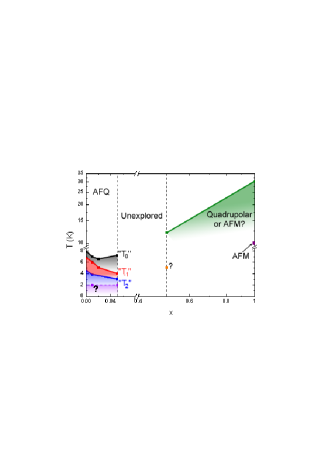
The results relating to all the different measurements performed on polycrystalline samples of (U1-xNpx)Pd3 can be summarised in the phase diagram in Figure 18. In the dilute Np region of the phase diagram quadrupolar order is observed. The dominant feature in the heat capacity of UPd3 is the lambda anomaly at , and so the evolution of this feature is the easiest to follow with increasing Np doping. The “” feature moves to lower temperatures as is increased to , suggesting the possibility that at some critical doping concentration this transition may be suppressed to zero temperature leading to a quantum critical point of quadrupolar origin.
Proximity to a quantum critical point at could be consistent with the apparent heavy fermion and possible non-Fermi liquid behaviours at this composition observed in the bulk thermodynamic measurements. It would be very interesting to discover a QCP due to the suppression of quadrupolar order, but one has to query the nature of any critical fluctuations with which it would be associated. The possibility of scaling in samples close to criticality may be investigated using inelastic neutron scattering.
Further investigation of the location of the dopant Np ions in dilute (U1-xNpx)Pd3 is desirable to determine wheter or not they are distributed randomly over the two sites of the dhcp structure.
The results presented in this paper provide an extensive survey of the bulk magnetic and electrical properties of dhcp NpPd3 and a preliminary characterisation of the new and interesting mixed actinide system (U,Np)Pd3. Clearly there is considerable scope for further experimental investigation.
Acknowledgements.
H.C.W. thanks EPSRC for a research studentship and the Actinide User Lab at ITU. We acknowledge the financial support to users provided by the European Commission, DG-JRC within its “Actinide User Laboratory” programme, and the European Community-Access to Research Infrastructures action of the Improving Human Potential Programme (IHP), contract HPRI-CT-2001-00118, and contract RITA-CT-2006-026176. We would like to acknowledge helpful discussions with G.H. Lander. The high purity Np metal used in this work was made available through a loan agreement between Lawrence Livermore National Laboratory and ITU, in the frame of a collaboration involving LLNL, Los Alamos National Laboratory and the US Department of Energy.References
- Jensen and Mackintosh (1991) J. Jensen and A. R. Mackintosh, Rare Earth Magnetism: Structures and Excitations (Clarendon Press, 1991).
- Zwicknagl and Fulde (2003) G. Zwicknagl and P. Fulde, J. Phys. Condens. Matter 15, S1911 (2003).
- Zochowski et al. (1995) S. W. Zochowski, M. de Podesta, C. Lester, and K. A. McEwen, Physica B 206/207, 489 (1995).
- Tokiwa et al. (2001) Y. Tokiwa, K. Sugiyama, T. Takeuchi, M. Nakashima, R. Settai, Y. Inada, Y. Haga, E. Yamamoto, K. Kindo, H. Harima, et al., J. Phys. Soc. Japan 70, 1731 (2001).
- McEwen et al. (2003) K. A. McEwen, J.-G. Park, A. J. Gipson, and G. A. Gehring, J. Phys. Condens. Matter 15, S1923 (2003).
- Zochowski and McEwen (1994) S. W. Zochowski and K. A. McEwen, Physica B 199/200, 416 (1994).
- Lingg et al. (1999) N. Lingg, D. Maurer, V. Müller, and K. A. McEwen, Phys. Rev. B 60, R8430 (1999).
- McEwen et al. (1998) K. A. McEwen, U. Steigenberger, K. N. Clausen, J.-G. P. J. Kulda, and M. B. Walker, J. Magn. Magn. Mater. 177-181, 37 (1998).
- McMorrow et al. (2001) D. F. McMorrow, K. A. McEwen, U. Steigenberger, H. M. Rønnow, and F. Yakhou, Phys. Rev. Lett. 87, 057201 (2001).
- Walker et al. (2006) H. C. Walker, K. A. McEwen, D. F. McMorrow, S. B. Wilkins, F. Wastin, E. Colineau, and D. Fort, Phys. Rev. Lett. 97, 137203 (2006).
- McEwen et al. (2007) K. A. McEwen, H. C. Walker, M. D. Le, D. F. McMorrow, E. Colineau, F. Wastin, S. B. Wilkins, J.-G. Park, R. I. Bewley, and D. Fort, J. Magn. Magn. Mater. 310, 718 (2007).
- Nellis et al. (1974) W. J. Nellis, A. R. Harvey, G. H. Lander, B. D. Dunlap, M. B. Brodsky, M. H. Mueller, J. F. Reddy, and G. R. Davidson, Phys. Rev. B 9, 1041 (1974).
- Vegard (1921) L. Vegard, Z. Phys. 5, 17 (1921).
- Kleykamp and Kang (1991) H. Kleykamp and S. G. Kang, Z. Metallkunde 82, 544 (1991).
- Heal and Williams (1955) T. J. Heal and G. I. Williams, Acta Cryst. 8, 494 (1955).
- McEwen et al. (1988) K. A. McEwen, W. G. Stirling, C. K. Loong, G. H. Lander, and D. Fort, J. Magn. Magn. Mater. 76-77, 426 (1988).
- Javorský et al. (2005) P. Javorský, F. Wastin, E. Colineau, J. Rebizant, P. Boulet, and G. Stewart, J. Nucl. Mat. 344, 50 (2005).
- Roberts et al. (1999) T. W. Roberts, S. W. Zochowski, F. Tasset, and K. A. McEwen, Physica B 267-268, 243 (1999).
- McEwen and Stirling (1981) K. A. McEwen and W. G. Stirling, J. Phys. C 14, 157 (1981).
- Yamauchi et al. (1999) H. Yamauchi, H. Onodera, K. Ohoyama, T. Onimaru, M. Kosaka, M. Ohashi, and Y. Yamaguchi, J. Phys. Soc. Jpn 68, 2057 (1999).
- Paixão et al. (2002) J. A. Paixão, C. Detlefs, M. J. Longfield, R. Caciuffo, P. Santini, N. Bernhoeft, J. Rebizant, and G. H. Lander, Phys. Rev. Lett. 89, 187202 (2002).
- (22) The authors note that the most recent theory regarding NpO2 suggests that the primary order parameter is not provided by octupoles, as usually assumed, but rather by the rank-5 triakontadipoles, see P. Santini, S. Carretta, N. Magnani, G. Amoretti and R. Caciuffo, Phys. Rev. Lett. 97, 207203 (2006).
- Fournier (1985) J. M. Fournier, Structure and Bonding (Springer-Verlag, Berlin, 1985), vol. 59/60, pp. 127–196.
- Gal et al. (1973) J. Gal, Z. Hadari, E. R. Bauminger, I. Nowik, and S. Ofer, Solid State Communications 13, 647 (1973).
- Schilling (1986) J. S. Schilling, Phys. Rev. B 33, 1667 (1986).
- Wastin et al. (1997) F. Wastin, E. Bednarczyk, J. Rebizant, S. Zwirner, and G. H. Lander, J. Alloys Comp. 262-263, 124 (1997).
- Andersen (1980) N. H. Andersen, Crystalline Electric Field and Structural Effects in f-electron Systems (Plenum, New York, 1980), p. 373.
- Walker et al. (2005) H. C. Walker, K. McEwen, P. Boulet, E. Colineau, and F. Wastin, Physica B 359-361, 1156 (2005).