A new look on the nature of high-spin to low-spin transition in Fe2O3
Abstract
Iron sesquioxide (Fe2O3) displays pressure and temperature induced spin and structural transitions. Our calculations show that, density functional theory (DFT), in the generalized gradient approximation (GGA) scheme, is capable of capturing both the transitions. The ambient pressure corundum type phase (hematite or –Fe2O3), having symmetry, gets distorted by the application of pressure and transforms to a distorted corundum type or Rh2O3(II) phase with symmetry, in agreement with recent experiments. GGA + calculations show the same trend but shift the transition pressures to higher values. Experimentally, the onset of the structural transition begins in the vicinity of the spin transition pressure and whether the system undergoes spin transition in the corundum type (HP1) or in the Rh2O3(II) type (HP2) phase, is still a controversial issue. With a relatively simple, but general, octahedral structural parameter, (the octahedral volume around iron ions), we show that in order to acquire a low spin (LS) state from a high spin (HS) one, the system does not necessarily need to change the crystal structure. Rather, the spin transition is a phenomenon that concerns the cation octahedra and the spin state of the system depends mainly on the value of , which is governed by two distinct equations of state, separated by a well defined volume gap, for the HS and LS states respectively. Analysis of the results on the basis of octahedral volume allows to sum up and bridge the gap between two experimental results and thus provides a better description of the system in the region of interest.
I INTRODUCTION
Spin crossover or electronic transition is a phenomenon commonly encountered among (transition) metal complexes, in particular under octahedral coordination Takemoto-ic73 ; Gutlich-sb81 ; Konig-pic87 ; Konno-bcsj91 ; Moliner-ica99 ; Guionneau-jmc99 ; Marchivie-ac03 . Under the influence of the ligand field the metal orbitals are split into two sets: a level with a 3-fold degeneracy and a 2-fold degenerate level. The closer the ligand is to the metal ion, the greater is the influence of the ligand-field strength. When this ligand-field energy dominates over electron-pairing or exchange energy the metal ion adopts the low-spin configuration. A high-spin configuration is instead favored when the exchange energy is greater than the ligand-field energy.
Hematite, -Fe2O3, is a rhombohedrally structured wide-gap antiferromagnetic insulatorHubbard64 at ambient conditions. It becomes weakly ferromagnetic between MorinMorin-pr50 temperature, TM (=260 K), and Néel temperature, TN (= 955 K), as a result of the canting of the spins of the two sublattices Searle-prb70 ; Levinson-prb71 ; Chow-prb74 ; Sandratskii-epl96 . In this structure, the Fe3+ ions, sitting in octahedral cages, display a high spin (HS) to low spin (LS) transition under external influences such as, temperature, pressure, etc. Sequential or concomitant pressure and/or temperature induced structural phase transitions, in addition to the spin one, increase the complexity of the system, making its in-depth understanding a challenge.
Significant continuous attention by the scientific community, for more than forty years, has brought in many intuitive ideas and counter-ideasReid-jgr69 ; Mcqueen-gsa66 ; Shannon-jssc70 ; Yagi-capj82 . The existence of residual magnetism after a volume collapse of 10 % and concurrent onset of the structural phase transition led to the issue of one–type or two–type cationic picture for the high pressure phase Suzuki-ktksp85 ; Syono-ssc84 ; Nasu-hi86 ; Olsen-ps91 . To resolve this issue and correlate/separate the spin and structural transitions a number of investigations have been performed in more recent years. Of them, X-ray diffraction (XRD), Mössbauer spectroscopy (MS) at 300K and electrical resistivity measurements by Pasternak et. al.Pasternak-prl99 assigned a nonmagnetic distorted corundum or Rh2O3(II) type structure as the high pressure phase. The intermediate region between the insulating and metallic regions in the electrical resistivity data was qualitatively explained by the coexistence of an insulating magnetic phase with a metallic nonmagnetic one.
Another XRD and X-ray emission spectroscopy (XES) experiment by Badro et. al.Badro-prl02 could separate the electronic transition from the crystallographic one. From the XES data these authors concluded that a high-spin state could be stabilized in the high-pressure structural phase at low temperatures while at high temperatures a low-spin state was stable. This high temperature LS state was found to be still weakly paramagnetic as evidenced by the presence of a satellite (K) in the XES spectraBadro-prl02 , in contrast with the non-magnetic state suggested by the authors of Ref. Pasternak-prl99, . The structural transition shows a sluggish behavior, as reported in room temperature Raman spectroscopy studies by Shim and DuffyShim-am02 and angle-resolved XRD studies by Rozenberg et. al.Rozenberg-prb02 . Moreover, high temperature heating might have a role to play in controlling the transition pressure as shown in the XRD experiments by Ono et. al.Ono-jpcs04 ; Ono-jpcm05 .
Hence, in spite of significant experimental efforts devoted to this system, some still controversial and unresolved issues remain: (i) how does the spin state of the system evolve with pressure ? (ii) what is the correlation between the spin and the structural transition, if there is any? In this study we will show that spin transition is a general phenomenon, depending on a simple structural parameter, the octahedral volume around Fe ions, and thus largely uncorrelated to the structural transition occurring in the same pressure range. The apparent contradiction between experimental results reported in Ref. Pasternak-prl99, and Badro-prl02, will also be resolved.
II METHODS AND RESULTS
Extensive first-principles density functional calculations of the spin and structural transitions in Fe2O3 have been performed. Variable-cell-shape molecular dynamicsWentzcovitch-prb91 has been used for the full structural optimization at arbitrary pressures. Eight-electron (3d74s1) and six-electron (2s22p4) ultrasoft pseudopotentials Vanderbilt-prb90 were used to describe Fe and O atomspseudo . The electron–electron correlation energy was treated within the PBEPerdew-prl96 generalized gradient approximation (GGA). GGA+U calculations were performed to supplement and compare with the results obtained within GGA. In these cases, the U values have been calculated self-consistently within the methodology described in Ref.[Cococcioni-prb05, ]. All calculations presented in this work have been performed with the Quantum-ESPRESSOQE package.
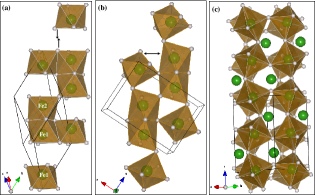
To understand the evolution of the spin and structural transition in the system we have considered three possible structural phases, starting from ambient to high pressure. Fig. 1(a) refer to the rhombohedrally structured corundum-type Fe2O3, where the four Fe atoms are arranged linearly along the rhombohedral axis in the unit cell. The two possible candidate structures at elevated pressure are Rh2O3(II)-type and orthorhombic-perovskite (opv) type Fe2O3, as shown respectively, in Fig. 1(b) and Fig. 1(c) and contain four formula units per unit cell. For each of the above mentioned structures there can be a few anti-ferromagnetic configurations in addition to the ferromagnetic one, depending on the spin orientations.
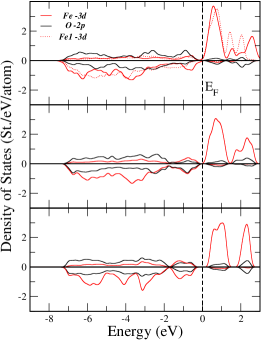
To start with we present the density of states (DOS) for each of the abovesaid three structures for their most stable ambient-pressure magnetic state. As can be seen from the lower panel of Fig. 2, DFT at the GGA level correctly describes the insulating nature of hematite. However, there is, as typical of LDA/GGA calculations, an underestimation of the band gap. Rh2O3(II)-type Fe2O3 also shows the same behavior, but with a much diminished magnitude of the band gap, as shown in the middle panel of Fig. 2. In both cases the valence band top edge is equally populated by Fe– and O– states. However, DOS for the opv-type Fe2O3, shown in the upper panel of Fig. 2, displays a very poor metallic tendency with Fe– dominated valence edge. This could be due to the underestimation of correlation effects by GGA. However, this issue is not relevant here since the latter structure is never the most stable one in the pressure range of interest, as will be shown below.
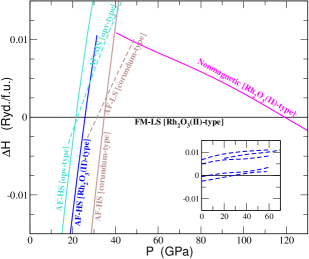
The calculated relative enthalpy curves of Fe2O3 for corundum-type, Rh2O3(II)-type and opv-type structures in different magnetic configurations are reported in Fig. 3. As can be seen, the ambient-pressure antiferromagnetic corundum-type phase, having a single kind of polyhedral arrangement, is the most stable structure up to a pressure of about 34 GPa. Starting from this pressure the distorted corundum or Rh2O3(II)-type phase in the LS ferromagnetic configuration is the thermodynamically stable phase. Several LS antiferromagnetic configurations are present a few mRy above the FM ground state in the LS pressure range (see inset of Fig. 3), supporting the conclusion that the system is above its magnetic ordering transition at the room temperature used in the MS experimentsPasternak-prl99 . In our calculations, opv-type Fe2O3, often considered to be another possible candidate structure for the high pressure phase, is never the most stable one in this pressure range.
| BLmax | BLmin | Voct | |||||
|---|---|---|---|---|---|---|---|
| (Å) | (Å) | ||||||
| Corundum-type: | |||||||
| AF1(GGA) | 0.0427 - 0.0248 | 77.8 - 34.0 | 2.012 - 1.912 | 1.848 - 1.820 | 1.360 - 1.422 | 9.28 - 8.56 | |
| AF2(GGA) | 0.0298 - 0.0234 | 85.2 - 36.5 | 2.056 - 1.931 | 1.888 - 1.838 | 1.330 - 1.407 | 9.71 - 8.78 | |
| AF3(GGA) | 0.0480 - 0.0246 | 81.0 - 35.8 | 2.036 - 1.936 | 1.917 - 1.848 | 1.311 - 1.401 | 9.96 - 8.91 | |
| AF1(U=3.3 eV) | 0.0419 - 0.0202 | 107.1 - 44.1 | 1.994 - 1.874 | 1.835 - 1.801 | 1.380 - 1.461 | 8.91 - 8.14 | |
| AF1(U=5.6 eV) | 0.0388 - 0.0196 | 120.0 - 53.2 | 1.984 - 1.864 | 1.838 - 1.794 | 1.382 - 1.470 | 8.81 - 7.99 | |
| Rh2O3-type: | |||||||
| AF(GGA) | 0.0375 - 0.0202 | 129.3 - 101.5 | 2.111 - 1.928 | 1.874 - 1.823 | 1.338 - 1.410 | 9.60 - 8.65 | |
| FM(U=3.3 eV) | 0.0245 - 0.0184 | 133.0 - 110.3 | 2.096 - 1.935 | 1.947 - 1.825 | 1.290 - 1.401 | 10.04 - 8.55 | |
| FM(U=5.6 eV) | 0.0226 - 0.0180 | 134.2 - 111.7 | 2.060 - 1.913 | 1.924 - 1.805 | 1.317 - 1.427 | 9.73 - 8.24 | |
| opv-type: | |||||||
| AF(GGA) | 0.0363 - 0.0116 | 20.5 - 3.5 | 2.045 - 1.900 | 1.883 - 1.841 | 1.350 - 1.422 | 9.75 - 8.76 | |
| overall | 0.035(8) - 0.020(1) | 98.(67) - 58.(95) | 2.04(4) - 1.91(0) | 1.88(4) - 1.82(2) | 1.33(9) - 1.42(4) | 9.5(3) - 8.5(1) |
All the magnetic configurations, in all investigated structures, show a spin collapse from 3.8 /Fe atom to 1 /Fe atom at some critical pressure. In hematite, the crossover from the HS to LS occurs at around 20, 25 and 36 GPa for the three different antiferromagnetic structures consistent with the elemental unit cell in Fig. 1(a), while for the ferromagnetic one it occurs at 5 GPa. This value is 30 GPa for the Rh2O3(II) type Fe2O3 in the most stable magnetic (antiferromagnetic) configuration. Also opv-type Fe2O3 displays a sharp spin transition as a function of pressure. In this structure there are two types of polyhedral cages (with 6-fold and 8-fold coordination) surrounding the cations and while Fe ions in 8-fold coordinated polyhedra loose their spin gradually, Fe ions in the octahedral cages display a sudden drop from HS to LS at 21 GPa. In all cases a volume collapse of about 7 – 10 % at the spin transition is found, consistent with a first order transition and in agreement with experimental evidence. Hence, regardless of the considered crystal structures, the Fe atoms sitting in octahedral cages display a HS to LS transition under pressure.
From the experimental point of view it is still controversial whether the spin transition occurs in the high-pressure or low-pressure structural phase. We believe that this spread in experimental results reflects the fact that spin transition is a general phenomenon occurring in all relevant structures and with a simple common origin as shown below.
III LOCAL STRUCTURE
In order to clarify the interplay between spin and structural transitions, we want to identify a few structural indicators that could be used to characterize the HS to LS transition and, as in previous studies,Takemoto-ic73 ; Gutlich-sb81 ; Konig-pic87 ; Konno-bcsj91 ; Moliner-ica99 ; Guionneau-jmc99 ; Marchivie-ac03 we will concentrate on the Fe coordination sphere. Pressure and/or temperature induced (anisotropic) strain causes deformation of the octahedra, which can be quantified by parameters such as the Fe–O bond-length distortion, , where D is the average octahedral Fe–O bond-length and is the deviation of the i-th Fe–O bond-length from the average, and the octahedral angle variance,Robinson-science71 given by , where is the j-th O–Fe–O angle whose ideal value is 90∘.
In all structures, the octahedra become more regular at the transition as can be inferred from the sudden jump of both parameters, from higher to lower values, reported in Table 1. However, and display very different values for different structures and hence these parameters alone are not suitable as a quantitative fingerprint of the occurrence of the spin transition.
Other octahedral structural parameters can be defined such as the maximum (BLmax) and minimum (BLmin) Fe–O bond-lengths, the octahedral volume (Voct) and a parameter measuring the nearest-neighbor interaction, defined as , where = 1.3 Å is of the order of the Oxygen ionic radius and ’s are the Fe–O bond lengths. As can be seen in Table 1, BLmax, BLmin and Voct show jumps to lower values across the transition. Moreover they present very similar values in all structures, both just before but especially just after the transition when the spread of these parameters in different structures is of the order of a few percent. Similarly, the interaction parameter, , also show a jump, this time from a lower to a larger value, again with a spread of a few percent.
It is worth stressing that, in spite of the fact that the HS to LS transition occurs at different pressures in different structures, and the results accumulated contain both GGA and GGA + calculations, for all the structural parameters considered here, the spread in their calculated values, just before and especially just after the transition, is smaller than the jump they experience across the transition, thus revealing the common mechanism operating in the different structures. All the above three structural parameters are therefore good indicators that could be used to monitor the approaching of a system to its critical pressure.
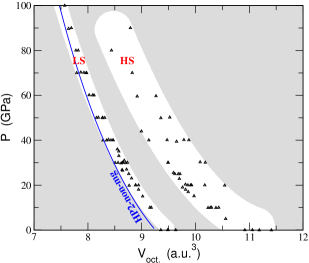
The octahedral volume is possibly the most fundamental one and in Fig. 4 we report the evolution under pressure of the octahedral volumes of the different structural phases in the HS and LS states. The data include corundum-type, Rh2O3(II)-type and opv-type in the GGA scheme and, for corundum-type and Rh2O3(II)-type, in the GGA+U scheme (=3.3 and 5.6 eV, respectively, as calculated according to Ref. Cococcioni-prb05, ). The transition pressuresnote-on HS to LS with GGA+U range from 0 GPa to 70 GPa and the crystal packing is different for different structures. In spite of all the above differences, the HS and LS octahedral volumes follow two well defined equations of state. The gap between these two equations of state corresponds to the octahedral volume collapse at the transition. This gap is larger at lower pressures and slowly decreases with pressure. The finite width of these two equation of states can be attributed to the fact that different structure display different inter-polyhedral surroundings, which are known to play some role in controlling the spin transition,Guionneau-jmc99 ; Marchivie-ac03 as well as the fact that the results from different DFT scheme (GGA and GGA+U) are collected together. Yet, it is remarkable that the finite width in the equation of states for the octahedral volume is only about 9% for the HS state and just 3% in the LS one.
A possible explanation for the larger uncertainty displayed in the HS equation of state lays in the fact that in this state, owing to larger Fe–O bonds and angular distortions (see table 1), the influence of the surroundings on the octahedra is more significant thus inducing larger spread in the octahedral volume. On the contrary, in the denser LS phase the octahedra become more regular (table 1) and the increased Fe–O bond strength, , reduces the relative influence of the surroundings, thus contributing to a smaller spread in the equation of state.
Based on the above two regions in Fig. 4 it might also be possible to estimate the amount of volume collapse or the spin transition pressure at 0K for similar kind of materials, provided any one of the quantities is known. Temperature effects on the transition pressure are however dramatic and are presently beyond our understanding.
IV DISCUSSION
Given a reliable and consistent structural parameter to characterize the spin transition, let us now turn to an analysis of the main experimental facts involved in its interplay with the structural one. The co-existence of both low- and high-pressure structural phases over a finite width of pressure/temperature has already been pointed out by a number of studies Pasternak-prl99 ; Rozenberg-prb02 ; Shim-am02 . Some controversy still exists Pasternak-prl99 ; Badro-prl02 on the nature of the intervening phases. The resistivity profile in [Pasternak-prl99, ] clearly identifies three pressure regions: a magnetic insulating phase at lower pressure, a nonmagnetic metallic phase at very high pressure and a mixture of them in between. In particular the nonmagnetic nature of the metallic phase in the intermediate region was assigned on the basis of the assignment of a doublet in the Mössbauer spectra as arising from nonmagnetic Fe atoms. We notice however that this assignment is not completely compelling since also a para-magnetic phase, above its ordering transition-temperature, would contribute a doublet in MS. This interpretation would be consistent with the small energy spread between the different ferromagnetic configurations found in our calculations and reported in the inset of Fig. 3. Indeed, the x-ray K emission spectra in [Badro-prl02, ] showed evidence of (para-)magnetism, although very weak. This study did not address the conductivity of the various phases.
The picture arising from our calculations agrees with all the experimental evidence and helps clarifying the situation. As can be seen from Fig. 3, the system has three broad regions in terms of magnetic states: a HS region at low pressure (R-I), a LS, but still (para-)magnetic, phase at intermediate pressure (R-II) and a nonmagnetic phase at very high pressure(R-III). While the HS phase is insulating, both corundum-type and Rh2O3(II)-type LS phases as well as the nonmagnetic phases are metallic. The HS insulating phase is followed by the LS metallic phase in either of the structural phasesnote-on-HP1-metallic-phase , HP1 or HP2, and we believe it is not constrained by any sharp boundary. In this crossover region, for a finite width on the pressure scale, the HS LS transformation occurs in any particular octahedron depending on the volume that the particular octahedron acquires in that condition. Our explanation for the spin transition goes as follows: for a particular octahedron, the Fe–O bond lengths and the octahedral volume decreases gradually with increasing pressure; at a certain point in the pressure scale, when the minimum Fe–O bond length (see Table 1) in that particular octahedron reaches a value for which the octahedral crystal field dominates over the exchange energy, that particular octahedron acquires a new spin state switching from its state to , resulting in the collapse of the octahedral volume. Similar octahedra with equivalent surroundings will experience this transition at the same pressure. While the transition pressure will vary for structures with different crystal packing.
Our observation that HS LS transformation depends on a local property, the octahedral volume, is in agreement with and explains the observed sluggishness of the structural transitionRozenberg-prb02 ; Shim-am02 . Inhomogeneity in the experimental pressure and temperature fields, the presence of defects and impurities in the experimental samples locally affect the octahedral volume around Fe ions and therefore upon increasing pressure the HS to LS transition will occur at different pressures in different octahedra depending on when the critical octahedral volume we have identified is reached. The local volume-collapse associated with spin transition will contribute to enhance the inhomogeneity of the pressure-field in the sample and the transition will proceed gradually in a nucleation-and-growth way.
In the same pressure range also the structural transition occurs. Minor crystallographic changes, brought about by the alteration of one of the coordinating oxygen atoms, lead to distorted corundum type or Rh2O3(II) type from the corundum type structure. An important issue is whether spin and structural transitions are strongly inter-dependent or not. Our results indicate that the two type of transitions are not strongly dependent, rather the HS to LS transition is a general phenomenon occurring in all structural phases. This conclusion is in agreement with experimental evidence. Badro et. al.Badro-prl02 has indeed shown that the spin transition is not necessary for the structural transition to occur, and vice versa. Hence, based on our results and experimental findings, one can qualitatively conclude that the spin and structural transitions are independent phenomena, in the case of Fe2O3, at least.
The HS LS and HP1 HP2 transition are completed by the upper bound of the intermediate region (R-II), which then progresses slowly to the nonmagnetic HP2 phase. Our calculated boundary for LS HP2 nonmagnetic HP2 is 120 GPa at zero temperature, which is rather far from the room temperature experimental value of 72 GPa [Pasternak-prl99, ]. Even assuming an, expected, strong temperature effect the discrepancy remains large. Still, accepting the inadequacy of DFT in predicting the numerical value of the transition pressures, we stress that DFT at the GGA level predicts correctly the sequence and details of the transitions. Taken together, our DFT results and the two main experimental works Pasternak-prl99 ; Badro-prl02 provide a clearer picture of the pressure evolution of the system across three regions: a HS magnetic phase (R-I), a LS, but still (para-)magnetic, phase at intermediate pressure (R-II) and a nonmagnetic phase at very high pressure(R-III).
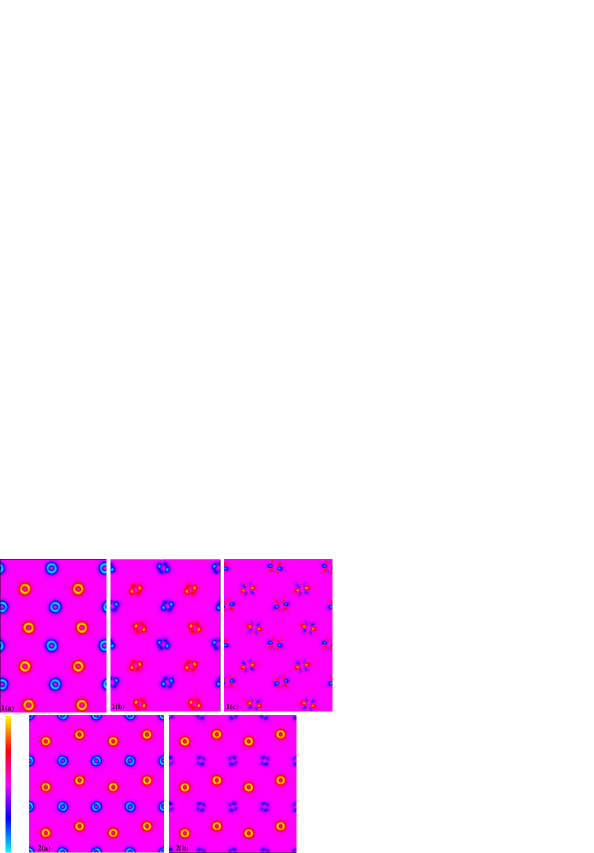
To further elucidate the evolution of the system across the spin transition and display the common mechanism that drives it in different crystal structures we present in Fig. 5 spin-density difference plots for HP2 (upper panels) and opv (lower panels). Before the spin transition (see 1(a) and 2(a)) all Fe atoms are characterized by spherical spin-density difference contour plots, corresponding to the fact that the level occupation is for HS. Just after the spin transition (see 1(b) and 2(b)) Fe atoms in octahedral coordination sites switch to the LS state. Their spin-density difference is characterized by four-lobe, due to the local level occupation. Notice that in panel 2(b) only the spin-density difference of the octahedral sites has changed nature; Fe atoms in the 8-fold coordinated sites remain HS. Finally panel 1(c) shows the spin density difference plot of HP2 when the system looses its spin completely and becomes nonmagnetic. On each site the averaged spin density vanish. The increased proximity of Fe and O atoms with increasing pressure enhances further the splitting of the orbitals along with the pressure induced broadening of the states and a simultaneous transfer of some charge from O– to Fe–. This eventually leads to a spin state characterized by level occupation. The similarity in the spin-density difference obtained in corresponding sites in different structures clearly show the common mechanism at work.
V CONCLUSIONS
In conclusion, we have shown that, in spite of the generally believed intricate relations with different structural parameters, the phenomenon of spin transition can well be described by a rather simple local structural parameter, i.e., the octahedral volume, at least in Fe2O3, if not in general. The HS and LS octahedral volumes, separated by a well defined volume gap, are governed by two distinct equations of state. For different structural phases, density functional theory, both at the GGA and GGA+U levels, reproduces this spin transition at a critical value of the octahedral volume. Analysis of our calculations suggests that at intermediate pressures the system is in a LS paramagnetic phase, thus clarifying some experimental controversy.
Acknowledgements.
Calculations were performed at SISSA and at the CINECA computing center, also thanks to INFM computing grants.References
- (1) J.H. Takemoto, and B. Hutchinson, Inorg. Chem. 12, 705 (1973);
- (2) P. Gütlich, Struct. Bonding, 44, 83 (1981);
- (3) E. König, Prog. Inorg. Chem. 35, 527 (1987);
- (4) M. Konno, and M. Mikami-kido, Bull. Chem. Soc. Jpn. 64, 339 (1991);
- (5) N. Moliner, M.C. Munoz, S. Letard, J.-F. Letard, X. Solans, R. Burriel, M. Castro, O. Kahn, and J.-A. Real, Inorg. Chem. Acta 291, 279 (1999).
- (6) P. Guionneau, J.-F. L etard, D.S. Yufit, D. Chasseau, G. Bravic, A.E. Goeta, J.A.K. Howard, and O. Kahn, J. Mater. Chem. 9, 985 (1999).
- (7) M. Marchivie, P. Guionneau, J.-F. L etard and D. Chasseau, Acta. Cryst. B59, 479 (2003).
- (8) J. Hubbard, Proc. R. Soc. London A 277, 237 (1964).
- (9) F.J. Morin, Phys. Rev. 78, 819 (1950).
- (10) C.W. Searle and G.W. Dean, Phys. Rev. B 1, 4337 (1970).
- (11) L.M. Levinson, Phys. Rev. B 3, 3965 (1971).
- (12) H. Chow and F. Keffer, Phys. Rev. B 10, 243 (1974).
- (13) L.M. Sandratskii and J. Kub̈ler, Europhys. Lett. 33, 447 (1996).
- (14) A.F. Reid and A.E. Ringwood, J. Geophys. Res. 74, 3238 (1969).
- (15) R.G. McQueen and S.P. Marsh, in Handbook in Physical Constants, edited by S.P. Clark, Memoir 97 of the Geological Society of America, Inc. (Geological Society of America, New York, 1966), revised ed., p. 153.
- (16) R.D. Shannon and C.T. Prewitt, J. Solid State Chem. 2, 134 (1970).
- (17) T. Yagi and S. Akimoto, in High Pressure Research in Geophysics, edited by S. Akimoto and M.H. Manghnani (Center Acad. Publ. Japan, Tokyo, 1982), p. 81.
- (18) T. Suzuki, T. Yagi, A. Akimoto, A. Ito, S. Morimoto, and S. Syono, in Solid State Physics under Pressure, edited by S. Minomura (KTK Scientific Publishers, Tokyo, 1985), p. 149.
- (19) S. Nasu, K. Kurimoto, S. Nagatomo, S. Endo, and F.E. Fujita, Hyperfine Interact. 29, 1583 (1986).
- (20) Y. Syono, A. Ito, S. Morimoto, S. Suzuki, T. Yagi, and S. Akimoto, Solid State Commun. 50, 97 (1984).
- (21) J. Staun Olsen, C.S G. Cousins, L. Gerward, H. Jhans, and B.J. Sheldon, Phys. Scr. 43, 327 (1991).
- (22) M.P. Pasternak, G.Kh. Rozenberg, G.Y. Machavariani, O. Naaman, R.D. Taylor, and R. Jeanloz, Phys. Rev. Lett. 82, 4663 (1999).
- (23) J. Badro, G. Fiquet, V.V. Struzhkin, M. Somayazulu, H.-K. Mao, G. Shen, and T. LeBihan, Phys. Rev. Lett. 89, 205504 (2002).
- (24) S.-H. Shim and T.S. Duffy, Am. Miner. 87, 318 (2002).
- (25) G.Kh. Rozenberg, L.S. Dubrovinsky, M.P. Pasternak, O. Naaman, T. Le Bihan, and R. Ahuja, Phys. Rev. B 65, 064112 (2002).
- (26) S. Ono, T. Kikegawa, and Y. Ohishi, J. Phys. Chem. Solids 65, 1527 (2004);
- (27) S. Ono, K. Funakoshi, Y. Ohishi, and E. Takahashi, J. Phys.: Condens. Matter 17, 269 (2005).
- (28) R.M. Wentzcovitch, Phys. Rev. B 44, 2358 (1991).
- (29) D. Vanderbilt, Phys. Rev. B 41, 7892 (1990).
- (30) We used the pseudopotentials Fe.pbe-nd-rrkjus.UPF and O.pbe-rrkjus.UPF from the Quantum-ESPRESSO distribution. See http://www.quantum-espresso.org
- (31) J.P. Perdew, K. Burke, and M. Ernzerhof, Phys. Rev. Lett. 77, 3865 (1996).
- (32) M. Cococcioni and S. de Gironcoli, Phys. Rev. B 71, 035105 (2005).
- (33) Quantum-ESPRESSO is a community project for high-quality quantum-simulation software, based on density-functional theory, and coordinated by Paolo Giannozzi. See http://www.quantum-espresso.org.
- (34) K. Robinson, G.V. Gibbs, and P.H. Ribbe, Science 172, 567 (1971).
- (35) In Ref.[Rollmann-prb04, ] no spin transition was found within GGA+U in the corundum-type phase. Our calculations, however, do find an HS to LS transition even in this structure, although at an higher pressure than in GGA.
- (36) G. Rollmann, A. Rohrbach, P. Entel, and J. Hafner, Phys. Rev. B 69, 165107 (2004).
- (37) LS HP1 metallic phase is only metastable in the stability region of LS HP2 metallic phase. Also our calculations doesn’t favor the nonmagnetic HP1 phase with respect to the LS HP1 phase upto about 150 GPa.