The gravitationally lensed, luminous infrared galaxy IRAS F10214+4724 observed with XMM-Newton
Abstract
We report on a short XMM-Newton observation of the gravitationally-lensed, luminous infrared galaxy IRAS F10214+4724 at . A faint X-ray source is detected at . The observed 0.5-2 keV (1.7-6.6 keV in the rest-frame) flux is erg cm-2 s-1and the spectral slope in the rest-frame 1-10 keV band is . These results agree with those obtained from the Chandra X-ray Observatory, given the large uncertainties in both measurements. While possible evidence for excess emission above 5 keV is seen, we suspect this excess might be either spurious or not related to the infrared galaxy.
keywords:
Galaxies: active , Galaxies:individual (IRAS F10214+4724) , X-rays: galaxies 95.55.Nv , 98.54.-h , 98.54.Ep1 Introduction
IRAS F10214+4724 is an IRAS source identified with an emission-line galaxy at (e.g., Rowan-Robinson et al 1991; Soifer et al 1991). The extremely large infrared luminosity is partly due to the amplification of gravitational lensing by an intervening galaxy or a group of galaxies at (Broadhurst & Lehar 1995; Goodrich et al 1996; Lacy, Rawlings & Serjeant 1998). The amplification factor appears to have wavelength dependency and estimated to be in the range of 10-100 (Broadhurst & Lehar 1995; Downes et al 1995; Eisenhardt et al 1996; Evans et al 1999; Graham & Liu 1995; Serjeant et al 1995; Trentham 1995; ).
The presence of an active nucleus in this galaxy was already clear from the optical emission-line spectrum of Seyfert 2 (Elston et al 1994; Soifer et al 1995) and the detection of polarised broad emission (Goodrich et al 1996) suggested that the nucleus is obscured from the direct view. The Spitzer IRS spectrum, however, shows a silicate feature in emission, in contrast to other obscured objects, of which the mid-infrared spectra generally show the silicate features in absorption (Teplitz et al 2006). The PAH features are weak or absent, indicating the mid-infrared light may be dominated by AGN (discussion on the PAH features in ULIRGs and PG quasar host galaxies can be found in Schweitzer et al 2006; Shi et al 2007; Armus et al 2007).
A large resevoir of molecular gas (, Brown & Van den Bout 1992; Radford, Brown & Van den Bout 1993; Radford et al 1996; Scoville et al 1995; Wagg et al 2006) has been inferred from CO observations. Strong star formation could, in principle, take place there, and the large far-infrared excess due to cold dust may originate from this. If this region has a large optical depth, mid-infrared emission from the starburst could be suppressed. In modelling the infrared energy distribution, Efstathiou (2006) attributes a deeply buried starburst to the far-infrared to sub-millimetre emission while the Seyfert 2 nucleus to the emission at shorter wavelengths (also offers an explanation for the silicate emission).
A 20-ks Chandra observation has detected 14 counts from a faint X-ray source associated with this object (Alexander et al 2005). We have also obtained the position of the Chandra X-ray source using the latest calibration: (RA, Dec.)), which is 0.4 arcsec to the north of the position reported previously but in a good agreement with the position of the millimetre continuum source measured with IRAM (beam size of arcsec, Ao et al 2008). With the positional uncertainty within 0.5 arcsec, the association of the X-ray source with the infrared galaxy is secure, as discussed in Alexander et al (2005). Here, we report an update on the X-ray source, obtained from a short XMM-Newton observation111Since this XMM observation was approved in the same period as for the Chandra observation, we had no prior knowledge of the X-ray brightness of this object, apart from the upper limits from ROSAT (Lawrence et al 1994) and ASCA (Iwasawa 2001).. The cosmological parameters used for calculating the source luminosity are the Hubble constant km s-1 Mpc-1, , and .
2 XMM-Newton Observation
IRAS F10214+4724 was observed with XMM-Newton on 2004 October 22-23 (Observation ID: 0201040101). The observation with the EPIC (one pn and two MOS) cameras, which are used for the analysis presented in this paper, was performed in the Imaging Full-Window mode with Thin Filter for the pn and Medium Filter for the MOS cameras. A significant fraction of the observation with the nominal 50 ks duration was lost by strong flares of the particle background. The useful exposure times for the scientific analysis, taken from periods of quiescent background, are 20.2 ks for the pn and 33.8 ks for the MOS data. The source counts were collected from a circular region with a radius of 12.5 arcsec, centred on the optical position, and the background data were taken locally from a source-free region on the same detector. The data reduction and analysis were carried out using the software packages of SAS 8.0.1 and HEASoft 6.6.1.
3 Results
The background-corrected counts in the 0.4-9 keV band are from the pn and from the two MOS cameras. Expected source counts from the count rate detected with Chandra, assuming the power-law slope of (the effective Chandra slope based on the hardness ratio, Alexander et al 2005) modified by the Galactic absorption cm-2 (Kalberla et al 2005), are 24 for the pn and 22 for the two MOS added at the respective exposure times. The MOS counts are in good agreements. The pn counts are per cent smaller than expected, but given the uncertainty of the pn counts and that the Chandra counts are only 14 with an approximately 30 per cent error, they are consistent within the uncertainties.
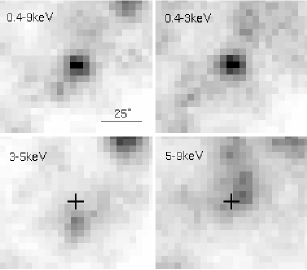
The X-ray images in the 0.4-9 keV band and the three sub-divided bands (0.4-3 keV, 3-5 keV, and 5-9 keV), obtained by adding the three EPIC cameras, are shown in Fig. 1. A source is detected at the optical position of IRAS F10214+4724. The detection is at in the soft (0.4-3 keV) band, which corresponds to the rest-frame 1.3-10 keV. There is no detection in the 3-5 keV, while the 5-9 keV band shows a excess at the position of the galaxy. This possible 5-9 keV excess is seen both in the pn and MOS data. However, on inspecting the 5-9 keV image, this excess could be due to a contamination from a nearby source or more likely, just noise due to background uncertainty, as no clear source peak can be seen at the expected position as seen in the soft band (Fig. 1). No other X-ray source is seen in the Chandra image within the XMM-Newton aperture.
If this were a real detection, it could be due to a strongly absorbed component appearing above 15 keV. This energy of absorption cut-off represents a column density of cm-2. However, at such a high column density, the corresponding large Thomson depth means that multiple Compton down-scattering would suppress high-energy photons and no large excess at high energies would be expected. Therefore, together with the small significance of the excess counts, we do not consider the 5-9 keV excess to be a reliable detection for the object of our interest. This also applies to the 5-9 keV data point of the spectrum (Fig. 2).
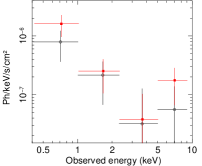

Given the limited source counts, only a coarse spectrum with four spectral channels is constructed for a rough estimate of the spectral shape, by combining the pn and MOS data. The pn and MOS spectra were corrected for the background and the detector response curve individually, and verified to be in a good agreement in their shapes (Fig. 2, left). As reported above for the count rate, the normalisation of the pn spectrum is per cent lower than the MOS spectrum. The four-channel flux spectrum (equivalent to ) as a function of rest-frame energies is shown in Fig. 2 (right). When the unreliable 5-9 keV data point is excluded, fitting with a power-law modified by the Galactic absorption gives (a fit of the individual pn and MOS spectra gives the same result). No clear evidence for a hard X-ray excess due to an absorbed AGN component can be found. The observed flux estimated from the power-law model is erg cm-2 s-1 in the 0.5-2 keV band, and erg cm-2 s-1 in the 2-5 keV band. Note that these fluxes are the mean of the pn and MOS data. The rest-frame 2-10 keV luminosity of the intrinsic X-ray source is estimated to be erg s-1, where is the lensing amplification factor (see Introduction).
4 Discussion
The XMM-Newton data give slightly lower flux and steeper spectral slope than those from the Chandra observation, but they agree within the uncertainty. The apparent spectral shape with in the rest 1.3-10 keV band is consistent with an unobscured AGN, which is not in agreement with the hidden AGN suggested e.g., by the spectropolarimetry (Goodrich et al 1996), unless the X-ray absorption is only moderate with cm-2 (e.g., Severgnini et al 2006), in which case the absorption cut-off would fall below the bandpass in this high redshift object. There is also a possibility that extended soft X-ray emission, e.g., from a starburst, could mask the absorbed contniuum of the AGN to mimic the steep spectrum in a low resolution spectrum. Given the small number of detected counts, no meaningful constraint on the Fe K line, hence on a possible presence of heavily obscured (Compton-thick) active nucleus, can be obtained.
In a strongly gravitationally lensed system, the amplification due to the lens can vary significantly between emission regions, e.g., infrared emitting dust region versus an X-ray emitting nucleus. This effect results in a distortion of the spectral energy distribution over a wide wavelength range to an observer on the Earth. This means that a direct comparison of the X-ray luminosity and the infrared luminosity (which is the bulk of the bolometric luminosity) may not provide a reliable measure of the AGN contribution to the bolometric luminosity. In IRAS F10214+4724, although the detail of the lensing configuration is still highly model dependent, the extended galaxy emission is considered to lie closer to the lensing caustic than the nuclear emission, resulting in the stellar and extended dust emission being more amplified than the active nuclues (Evans et al 1999, but see also Teplitz et al 2006). If the observed X-ray emission is assumed to be due entirely to an unobscured or moderately obscured AGN, a straight conversion from the 2-10 keV luminoisity to the bolometric luminosity, even with a large bolometric correction , appropriate for luminous quasars (e.g., Marconi et al 2006), would fall orders of magnitude below the far infrared luminosity. This X-ray quietness may point to an unfavourable lensing configuration for the innermost part of the accretion disk where the primary X-rays are produced, or alternatively, the faint X-ray emission in IRAS F10214+4724 being only reflected light from a heavily obscured AGN (see Alexander et al 2005 for details).
An assessment of the AGN contribution to the bolometric luminosity and the lensing amplification factor could only be possible once the origin of the observed X-ray emission has been identified either with, e.g., direct light from the active nucleus, reflected light of a Compton-thick AGN, or thermal emission from a starburst. The X-ray amplification factor should differ accordingly, as the physical scale of the respective origins is vastly different. The primary X-ray emitting region would be at pc, where is the black hole mass, is the size of the X-ray production region in unit of the gravitational radius, . X-ray reflection from a Compton thick AGN is expected to occur at the inner surface of the torus at pc, if its optical depth there is large enough, or possibly a more extended region of dense molecular gas where the CO observations probed. Starburst related emission would come from a range of radii, depending on the energy, but primarily from a similar region to where the FIR-submillimetre emission arises. A sufficiently deep X-ray observation would be necessary to identify the origin of the X-ray emission.
We thank D.M. Alexander for useful discussion. This paper is based on observations obtained with XMM-Newton, an ESA science mission with instruments and contributions directly funded by ESA Member States and NASA.
References
- Alexander et al [2005] Alexander, D. M., Chartas, G., Bauer, F. E., Brandt, W. N., Simpson, C., & Vignali, C. 2005, MNRAS, 357, L16
- [2] Ao Y., Weiß A., Downes D., Walter F., Henkel C., Menten K. M., 2008, A&A, 491, 747
- [3] Armus L., et al., 2007, ApJ, 659, 148
- [4] Barvainis, R., Antonucci, R., Hurt, T., Coleman, P., & Reuter, H.-P. 1995, ApJ, 451, L9
- [5] Broadhurst, T., & Lehar, J. 1995, ApJ, 450, L41
- [6] Brown, R. L., Van den Bout, P. A., 1992, ApJ, 397, L19
- [7] Downes, D., Solomon, P. M., & Radford, S. J. E. 1995, ApJ, 453, L65
- [8] Efstathiou A., 2006, MNRAS, 371, L70
- [9] Eisenhardt, P. R., Armus, L., Hogg, D. W., Soifer, B. T., Neugebauer, G., & Werner, M. W. 1996, ApJ, 461, 72
- [10] Elston, R., McCarthy, P. J., Eisenhardt, P., Dickinson, M., Spinrad, H., Januzzi, B. T., & Maloney, P. 1994, AJ, 107, 910
- [11] Evans, A. S., Scoville, N. Z., Dinshaw, N., Armus, L., Soifer, B. T., Neugebauer, G., & Rieke, M. 1999, ApJ, 518, 145
- [12] Goodrich, R. W., Miller, J. S., Martel, A., Cohen, M. H., Tran, H. D., Ogle, P. M., & Vermeulen, R. C. 1996, ApJ, 456, L9
- [13] Graham, J. R., & Liu, M. C. 1995, ApJ, 449, L29
- [14] Iwasawa, K. 2001, X-ray Astronomy: Stellar Endpoints, AGN, and the Diffuse X-ray Background, 599, 169
- [15] Kalberla, P. M. W., Burton, W. B., Hartmann, D., Arnal, E. M., Bajaja, E., Morras, R., Poumlppel, W. G. L. 2005, A&A, 440, 775
- [16] Lacy, M., Rawlings, S., & Serjeant, S. 1998, MNRAS, 299, 1220
- [17] Lawrence, A., Rigopoulou, D., Rowan-Robinson, M., McMahon, R. G., Broadhurst, T., & Lonsdale, C. J. 1994, MNRAS, 266, L41
- [18] Marconi, A., Risaliti, G., Gilli, R., Hunt, L. K., Maiolino, R., & Salvati, M. 2004, MNRAS, 351, 169
- [19] Radford, S. J. E., Brown R. L., Van den Bout, P. A., 1993, A&A, 271, L21
- [20] Radford, S. J. E., Downes, D., Solomon, P. M., Barrett, J., & Sage, L. J. 1996, AJ, 111, 1021
- [21] Rowan-Robinson, M., et al. 1991, Nat, 351, 719
- [22] Schweitzer, M., et al., 2006, ApJ, 649, 79
- [23] Scoville, N. Z., Yun, M. S., Brown, R. L., & Vanden Bout, P. A. 1995, ApJ, 449, L109
- [24] Severgnini, P., et al. 2006, A&A, 451, 859
- [25] Serjeant, S., Lacy, M., Rawlings, S., King, L. J., & Clements, D. L. 1995, MNRAS, 276, L31
- [26] Shi, Y., et al., 2007, ApJ, 669, 841
- [27] Soifer, B. T., et al. 1991, ApJ, 381, L55
- [28] Soifer, B. T., Cohen, J. G., Armus, L., Matthews, K., Neugebauer, G., & Oke, J. B. 1995, ApJ, 443, L65
- [29] Teplitz, H.I., et al. 2006, ApJ, 638, L1
- [30] Trentham, N. 1995, MNRAS, 277, 616
- [31] Wagg, J., Wilner, D. J., Neri, R., Downes, D., & Wiklind, T. 2006, ApJ, 651, 46