Timing Behavior of the Magnetically Active Rotation-Powered Pulsar in the Supernova Remnant Kesteven 75
Abstract
We report a large spin-up glitch in PSR J18460258 which coincided with the onset of magnetar-like behavior on 2006 May 31. We show that the pulsar experienced an unusually large glitch recovery, with a recovery fraction of , resulting in a net decrease of the pulse frequency. Such a glitch recovery has never before been observed in a rotation-powered pulsar, however, similar but smaller glitch over-recovery has been recently reported in the magnetar AXP 4U 0142+61 and may have occurred in the SGR 1900+14. We also report a large increase in the timing noise of the source. We discuss the implications of the unusual timing behavior in PSR J18460258 on its status as the first identified magnetically active rotation-powered pulsar.
1 Introduction
PSR J18460258 is a young (800 yr), 326 ms pulsar, discovered in 2000 with the Rossi X-ray Timing Explorer (RXTE; Gotthelf et al., 2000). No radio pulsations have been detected despite deep searches (Kaspi et al., 1996; Archibald et al., 2008). PSR J18460258 has a large inferred magnetic field of G, above the quantum critical limit, and a braking index of (Livingstone et al., 2006, hereafter LKGK06). The pulsar was therefore believed to be simply a high-magnetic field rotation-powered pulsar (RPP), with radio pulsations that do not cross our line of sight. However, in 2006 May, the source experienced a series of X-ray bursts and a sudden increase in X-ray flux, which strongly suggest magnetic activity (Gavriil et al., 2008). The source also showed spectral variations and changes in the surrounding nebula (Gavriil et al., 2008; Kumar & Safi-Harb, 2008; Ng et al., 2008).
A magnetar is a neutron star whose magnetic energy powers the bulk of its emission (Thompson & Duncan, 1995), while a RPP produces radiation via the loss of rotational kinetic energy (e.g., Manchester & Taylor, 1977). PSR J18460258 is a unique transition object between these two source classes. The X-ray luminosity of PSR J18460258 can be entirely accounted for by the spin-down power of the pulsar, however, the observed X-ray bursts and flux flare are phenomena only seen thus far from magnetars (Gavriil et al., 2008).
A neutron star glitch is defined as a sudden, usually unresolved, increase in spin frequency, . Glitches are often accompanied by an increase in the frequency derivative, , and are sometimes followed by an exponential decay on timescale , where some of the initial jump in is recovered. In general, a glitch at time can be modeled as:
| (1) |
where is the frequency of the pulsar prior to the glitch and is the initial frequency jump, which can be decomposed into the part of the glitch that is permanent, , and that which decays, . The recovery fraction is defined as . The variety of observed pulsar glitches is interesting. The fractional magnitude of the observed change in ranges over 6 orders of magnitude from (Lyne et al., 2000; Janssen & Stappers, 2006; Hobbs et al., 2002). Some glitches are characterized only by a increase (e.g., PSR B175823; Shemar & Lyne, 1996), while some glitches (typically in young pulsars) are dominated by an increase in the magnitude of (e.g., the Crab pulsar; Wong et al., 2001). Some glitches decay on timescales of days (e.g., Flanagan, 1990), while others display very long decay time scales ( hundreds of days; Wang et al., 2000). The fraction of the glitch that decays is also highly variable. In older pulsars the amount of glitch recovery is typically small (, Shemar & Lyne, 1996) while in the Crab pulsar the recovery can be nearly complete (e.g., , Lohsen, 1981). However, in many glitches, no recovery is detected.
Glitches are now known to be ubiquitous in magnetars as well as rotation-powered pulsars (Kaspi et al., 2000; Kaspi & Gavriil, 2003; Dall’Osso et al., 2003; Dib et al., 2008; Gavriil et al., 2009). What remains to be seen is whether glitches have the same physical origin in both types of objects, or if the super-critical magnetic fields of magnetars are responsible for different glitch origins and evolutions. While some magnetar glitches are indistinguishable from those observed in RPPs, others occur contemporaneously with radiative changes such as bursts, flux enhancements, and spectral or pulse profile variations, such as in the Anomalous X-ray Pulsar (AXP) 1E 2259+586 (Kaspi et al., 2003). No radiative changes have been observed with RPP glitches (e.g., Helfand et al., 2001). RPP glitches are believed to arise from a sudden unpinning of vortices in the superfluid interior crust of the pulsar (e.g., Alpar et al., 1993). Magnetar glitches, on the other hand, may be triggered by strong internal magnetic fields as the crust is deformed, either plastically or cracked violently (Thompson & Duncan, 1996).
In this paper, we discuss the timing behavior of PSR J18460258 prior to, during, and following the period of magnetic activity observed in 2006. We show that a large glitch occurred contemporaneous with the X-ray bursts and onset of the flux flare, accompanied by an unusual increase in the timing noise of the pulsar. We show that the glitch recovery is very unusual for a RPP but is reminiscent of timing behavior observed from magnetars and is further evidence of magnetic activity in PSR J18460258.
2 RXTE Observations and Analysis
Observations of PSR J18460258 were made using the Proportional Counter Array (PCA; Jahoda et al., 1996, 2006) on board RXTE. The PCA consists of an array of five collimated xenon/methane multi-anode proportional counter units (PCUs) operating in the 2 – 60 keV range, with a total effective area of approximately and a field of view of FWHM.
Our entire RXTE data set spans 9.7 yr from 1999 April 18 through 2008 December 10 (MJD 51286 – 54810). Data from 2000 January 31 - 2005 July 27 (MJD 51574 – 53578) were reduced and analyzed previously and details can be found in LKGK06. Eleven observations taken in 1999 April 18-21 are of limited use for the current analysis since they cannot be unambiguously phase connected to the rest of the data. Analysis of data spanning 2005 July 27 - 2008 December 10 (MJD 53578 – 54810) is presented here. Data were collected in “GoodXenon” mode, which records the arrival time (with 1-s resolution) and energy (256 channel resolution) of every unrejected event. Typically, two to three PCUs were operational during an observation. We used the first Xenon layer of each operational PCU and extracted events in channels 4 – 48 (approximately 2 – 20 kev), as this maximizes the signal-to-noise ratio for this source.
Observations were downloaded from the HEASARC archive111http://heasarc.gsfc.nasa.gov/docs/archive.html and data from each active PCU were merged and binned at (1/1024) s resolution. Photon arrival times were converted to barycentric dynamical time (TDB) at the solar system barycenter using the J2000 source position RA = , Decl (Helfand et al., 2003) and the JPL DE200 solar system ephemeris.
The known ephemeris from LKGK06 was used to fold each time series with 16 phase bins. Resulting profiles were cross-correlated in the Fourier domain with a high signal-to-noise ratio template created by adding phase-aligned profiles from all observations. The cross-correlation process assumes that the pulse profile is stable; indeed, we found no evidence for variability that could bias TOA measurement, as shown in Figure 1, and confirmed by Kuiper & Hermsen (2009). The figure shows average profiles from before, after, and throughout the outburst and unusual timing behavior. For each individual observation, the cross-correlation yielded the time of arrival (TOA) of phase-zero of the average pulse profile at the fold epoch. The TOAs were fitted to a timing model (see Section 3) using the pulsar timing software package TEMPO222http://www.atnf.csiro.au/research/pulsar/tempo. After phase-connecting the data, we merged observations occurring on a single day and used the ephemeris to re-fold the data in order to obtain more precise TOAs. This process produced 199 TOAs with a typical uncertainty 9 ms (2.7% of the pulse period). Further details of the observation and analysis are given in LKGK06.

3 Timing Analysis and Results
Phase-coherent timing is a powerful method for obtaining accurate pulsar parameters, but can only be used when timing noise and glitches are relatively small (e.g., Livingstone et al., 2005). To obtain a phase-coherent timing solution, each turn of the pulsar is accounted for by fitting TOAs with a Taylor expansion of the pulse phase (Lyne & Smith, 2005).
Phase-coherent timing for PSR J18460258 spanning 2000 January 1 – 2005 July 27 (MJD 51574–53578) is discussed in LKGK06. Phase coherence was maintained for the next 308 days without incident. Phase coherence was lost with the observation occurring on 2006 May 31 (MJD 53886) which contained 4 X-ray bursts and a pulse flux increase (Gavriil et al., 2008). For the following 32 observations spanning 192 days, no unambiguous phase coherent timing solution was possible. Instead, we performed periodograms to determine the pulse frequency. Uncertainties were determined from a Monte Carlo simulation, where noise was added to simulated sinusoidal pulses and the frequency for each trial was determined in the same way as for the real data (see LKGK06 for further details). Phase coherence was once again obtained starting 2007 January 26 (MJD 54126) with closely spaced bootstrapping observations after the source reappeared from behind the Sun after 48 days. A single phase coherent timing solution was obtained spanning 2007 January 26 – 2008 December 10 (MJD 54126–54810). This timing solution is severely contaminated by long-term glitch recovery and timing noise, so the fitted parameters for the global solution are of limited value.
To analyze the long-term rotational behavior of the pulsar, we created short phase-coherent timing solutions from 2000 until the onset of bursts, and from 2007 and 2008. Each timing solution included only and , and included as much data as possible while requiring the reduced value of the fit to be 1. This resulted in 11 measurements of and pre-glitch and 11 measurements post-glitch. In order to better utilize the available data in the post-glitch period, we created short overlapping timing solutions, each of which uses approximately half the data from two of the above described short data subsets, and has the same fitted parameters and requirements. This can be useful because the short coherent timing solutions result in parameter fits that are dominated by the end points, which can be problematic when is varying rapidly from glitch recovery as in this case, or when timing noise is a significant effect. This produces an additional 9 post-glitch measurements of and . Coherent frequency measurements (crosses), overlapping frequency measurements (filled circles) and frequency measurements obtained via periodograms (open circles), are plotted in the top panel of Figure 2, with the pre-burst , , and removed. The middle panel of Figure 2 shows measurements of from the short coherent timing solutions as crosses, with the overlapping measurements in filled circles. In addition, open circles show three measurements of that are calculated from weighted least-squares fits to nine periodogram measurements of .
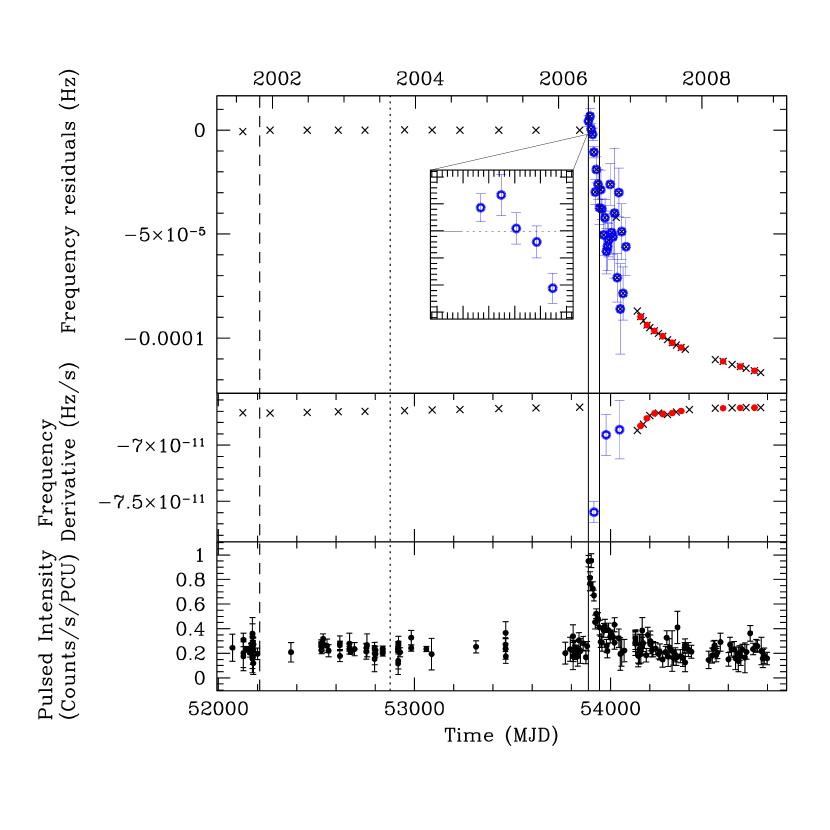
A frequency increase is apparent in the frequency residual plot (top panel and inset, Figure 2), indicating that a glitch occurred (also noted by Kuiper & Hermsen, 2009). Two measurements of are larger than the pre-glitch predicted value. We calculated the average at MJD 53890 (4 – 11 days after the glitch occurred). The initial value of at the time of the glitch was presumably larger than this value, as indicated by the exponential fit to the data discussed below.
We fitted the measured frequencies of PSR J18460258 (fitting only 3 pre-glitch values) with an exponential recovery glitch model (Eq. 1), the results of which are shown in Figure 3. The top panel of the Figure shows frequency measurements with the pre-glitch ephemeris (, and ) removed (as in Figure 2), while the bottom panel shows residuals from the glitch fit. The uncertainties from the periodogram measurements of are orders of magnitude larger than those from short coherent fits to the data and thus contribute minimally to the overall value. Thus the glitch residuals (bottom panel, Figure 3) are shown to highlight the deviation from the fit of the coherent frequencies, which dominate the .

Significant deviations from the fit can be seen during the period of glitch recovery, giving rise to a large reduced value of for 45 degrees of freedom for the best fit (bottom panel, Figure 3).
Given the poor fit, the formal uncertainties underestimate the true values. To determine more reasonable uncertainties on the glitch parameters, we multiplied the uncertainties on the coherent measurements by a factor until the reduced of the fit . We applied a multiplicative factor only to the phase coherent measurements because these uncertainties were orders of magnitude smaller than those from periodogram measurements, determined in a different way, and the contribution to was mainly from the coherent values. Quoted uncertainties on the glitch parameters are from contours from the fit with multiplied uncertainties. The fitted value of the initial fractional frequency increase is , very large for such a young pulsar, where a typical value is . More remarkable yet, however, is the amount by which the frequency recovers. We find , corresponding to a net decrease in frequency of Hz. All fitted glitch parameters are given in Table 1.
While the deviation from the exponential fit is very significant for several months (bottom panel, Figure 3) the overall evolution after the glitch is dominated by the exponential recovery: the deviation from the fit is 2 orders of magnitude smaller than the overall post-glitch decrease in . The deviation from exponential recovery may well have been larger in the period just following the glitch, however, the large uncertainties on the periodogram measurements of ( Hz) prevent any firm conclusion. However, since the corresponding pulse TOAs cannot be unambiguously phase-connected, it is likely that large variations in and occurred during the 240-day period between the glitch epoch and when we regained phase-coherence. It is also possible that a second, smaller glitch () occurred during this period. The observed deviation from the exponential recovery decreases as the glitch recovers. Thus, in the closing months of 2008, the pulsar was rotating very regularly again, similar to its pre-glitch behavior.
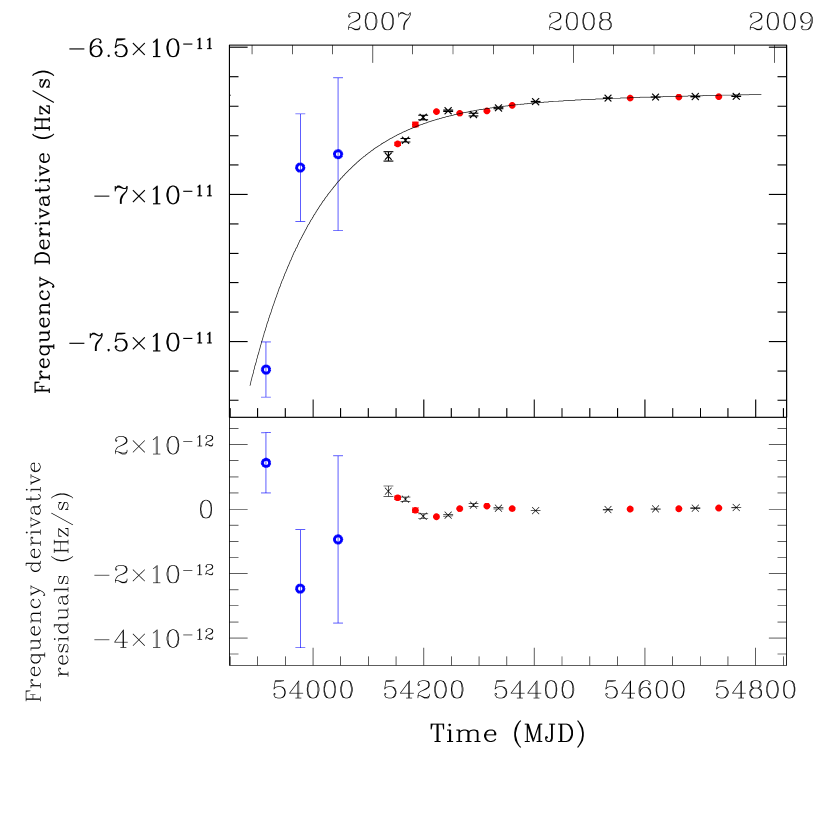
Figure 4 shows post-glitch phase-coherent measurements of (a subset of the measurements shown in the middle panel of Figure 2). The pre-glitch measurements are excluded here for clarity. The solid line is the derivative of the glitch model fitted to the measurements, clearly showing that there is significant deviation. The overall effect of the glitch recovery on is clear, however, from MJD 54100-54300 the measurements deviate from the exponential recovery by %. The effect of this anomalous change in is not directly evident in the measurements of (which are dominated by the exponential recovery) but does help explain why the exponential glitch fit is not a satisfactory description of the data, and is clear in the residuals of the glitch fit in the bottom panel of Figure 2.
4 Bursts and pulsed flux
The glitch during PSR J18460258’s outburst was accompanied by a major pulsed flux enhancement (Gavriil et al., 2008). In order to quantify the radiative properties of the source during the glitch recovery, we extracted its pulsed flux using all available RXTE observations. First, we generated separate event lists for each PCU in FITS333http://fits.gsfc.nasa.gov format using the standard FTOOLS444http://heasarc.gsfc.nasa.gov/docs/software/ftools/. We then filtered our event lists such that we only preserved photons in the 2 – 20 keV band, from the first Xenon layer. The photon arrival times were then barycented using the source position and the JPL DE200 solar system ephemeris. We folded the filtered barycented photon arrival times using the ephemeris determined in our phase-coherent timing analysis using 16 phase bins. Using the folded profiles, we calculated the RMS pulsed flux in each PCU using the Fourier method described by Woods et al. (2004) keeping only the contribution from the 1st harmonic given the source’s roughly sinusoidal profile. Not all the observations were pointed at PSR J18460258, therefore we corrected for the reduced efficiency in each PCU due to the offset pointing using the collimator response of each PCU and the instrument attitude files. Finally, we averaged the pulsed flux in each PCU weighted by the fractional exposure of each PCU. We excluded the contribution from PCU 0 because of the loss of its propane layer and the numerous detector breakdown events. Our pulsed flux time series is presented in the bottom panel of Figure 2. The event lists for each PCU created for the pulsed flux analysis were binned into 31.25 ms lightcurves and were searched for bursts using the burst search algorithm introduced in Gavriil et al. (2002). No additional bursts were found other than the 5 reported in Gavriil et al. (2008).
We checked for a correlation between torque and pulsed flux by plotting the pulsed flux against the spin frequency derivative in log-log space, shown in Figure 5. All measurements of before and after the glitch and bursts are shown, including 3 measurements of obtained from weighted least-squares fits to measurements obtained from periodograms. These 3 measurements have uncertainties orders of magnitude larger than those for measurements from coherent timing.

The plot shows a possible correlation between flux and torque when both parameters are extreme. Fitting a power law to the data gives a power law index of 8. However, this value is constrained by a single measurement of when the flux, and timing noise, are both very large. Excluding this point, there is no significant correlation between flux and . The observed variations in during the later phase connected period, are at the level, while the variation in immediately following the glitch are at the level (Figure 4). Correspondingly small fluctuations in pulsed flux are not detectable in these data.
5 Discussion
5.1 Glitch properties
Four X-ray bursts in PSR J18460258 coincided with the onset of a flux flare on 2006 May 31 (MJD 53886). The pulsed flux decayed over 2 months and reached quiescence around the time of the fifth burst on 2006 July 27 (MJD 53943) (Gavriil et al., 2008). Significant spectral changes also occurred (Gavriil et al., 2008; Kumar & Safi-Harb, 2008; Kuiper & Hermsen, 2009) and flux enhancement up to 300 keV was observed (Kuiper & Hermsen, 2009). Contemporaneous with the sudden change in the X-ray emission from PSR J18460258, we observed a large glitch with an initial frequency increase of . The glitch decayed over days, with a recovery fraction of , resulting in a net decrease of the pulse frequency of Hz. Furthermore, the timing behavior during the period of recovery is not well modeled by a simple exponential function and measurements of in particular are suggestive of a high level of timing noise for several hundred days following the glitch.
This glitch and subsequent recovery reinforces that PSR J18460258 underwent a period of magnetic activity in 2006. This glitch is entirely different from the previous glitch in this source, which was radiatively silent, small in magnitude (), dominated by a change in (), and had no measurable recovery (LKGK06). This small glitch is similar to those observed in the Crab pulsar (e.g., Wong et al., 2001) and other very young rotation-powered pulsars such as PSR B054069 (Livingstone et al., 2005). It is unusual to have two such disparate initial magnitudes in the same source, particularly in such a young pulsar, though this has been seen in some older pulsars such as PSR B173730, which has glitch magnitudes spanning four orders of magnitude (Lyne et al., 2000; Janssen & Stappers, 2006). In fact, the glitch reported here is the largest glitch ever observed in any of the pulsars with characteristic ages less than kyr (the Crab pulsar, B054069, B150959, and J11196127), none of which have experienced glitches with fractional magnitudes larger than .
The glitch reported here has a recovery fraction of . The measured value of implies that the net frequency change after the glitch recovery is negative, , as shown in Figure 2. A similar effect was recently observed in the AXP 4U 0142+61, though with much smaller magnitude of (Gavriil et al., 2009). The negative change in resulting from the over-recovery of the PSR J18460258 glitch is similar in magnitude to the unresolved timing event seen in the magnetar SGR 1900+14 in the months before the giant flare in 1998 (Woods et al., 1999). In that case, an enhanced spin-down of the magnetar was observed over 3 months. Well spaced timing observations around the time of the timing event were not available, so no glitch could be resolved, if indeed one occurred.
Thompson et al. (2000) attribute the observed behavior in SGR 1900+14 to one of two possibilities. The first is an increase in the magnitude of by a factor of , persisting for days. The second is that a negative glitch, that is, a sudden spin-down occurred, with magnitude . However, a timing event similar to that observed in PSR J18460258 could also describe the data. It is curious, however, that such similar fractional changes in should occur in two sources that experienced such disparate radiative changes, with the energy output from SGR 1900+14 being several orders of magnitude larger than from PSR J18460258.
AXP 1E 2259+586 experienced a glitch contemporaneous with 80 X-ray bursts, a flux flare and pulse profile changes in 2002 (Kaspi et al., 2003; Woods et al., 2004). Neither this glitch nor the large PSR J18460258 glitch can be described with a single exponential decay model. The addition of an exponential growth component better describes the 1E 2259+586 glitch, however, the addition of a similar component for the PSR J18460258 glitch does not provide a significant improvement to the fit. Interestingly, the flux enhancement observed in 1E 2259+586 lasted much longer ( yr; Zhu et al., 2008) than the glitch recovery time scale ( days), whereas the reverse is true for PSR J18460258, with days and a flux decay timescale of days (Gavriil et al., 2008). The 1E 2259+586 event can also be distinguished from the PSR J18460258 glitch in that its recovery fraction is much smaller, with . In 2001, the AXP 1RXS J170849.0400910 also experienced a glitch with recovery that was not well described by a simple exponential, and not improved with the addition of a second exponential term (Kaspi & Gavriil, 2003; Dall’Osso et al., 2003; Dib et al., 2008). Woods et al. (2004) argued that it is unlikely that 1RXS J170849.0400910 experienced bursts or a pulsed flux flare associated with this glitch because a flux flare would have had to decay on a time scale less than the glitch decay time scale. However, this is exactly the behavior observed from PSR J18460258, albeit with a much longer time scale. Long-term spectral changes and flux variations have been claimed in 1RXS J170849.0400910 (Rea et al., 2005; Campana et al., 2007; Israel et al., 2007b).
An interesting characteristic of some AXP glitches is a period of enhanced spin-down immediately following the glitch, as observed in 1E 1841045, 1RXS J170849.0400910, and 1E 2259+586 (Kaspi & Gavriil, 2003; Dib et al., 2008). The additional instantaneous spin-down at the glitch epoch owing to the exponential recovery can be quantified as (found by taking the derivative of the exponential term in Eq. 1 and setting ). For the 1E 2259+586 glitch, , while a typical value for a RPP is (see Peralta, 2006, and references contained therein). For PSR J18460258 the instantaneous spin-down is , larger than for any RPP glitch, but not as large as those measured for AXPs. It should be noted, however, that an enhanced spin-down is not observed in every AXP glitch.
In PSR J18460258, there is evidence for a 200-day interval where deviates significantly from an exponential glitch recovery, and it is possible that further significant deviation occurred during the 240-day period of unconnected data directly following the glitch. Perhaps is varying in a stochastic fashion similar to that observed in the AXP 1E 1048.15937 (Gavriil & Kaspi, 2004; Dib et al., 2009). In this AXP, a year-long period of rapid variations followed a large pulsed flux flare and a possible glitch in 2002. Another glitch in 2007 coincided with the onset of a pulsed-flux flare, again followed by stochastic variations in . Another similarity between these sources is that the flux enhancement decayed away long before the timing variations subsided. Alternatively, perhaps the variations are more simply attributed to timing noise, as is seen in many young RPPs. The behavior remains unusual however, since this is qualitatively very different from the mild timing noise observed in PSR J18460258 prior to magnetic activity, and such a large change in timing noise behavior is unprecedented among RPPs.
A simple estimate of the transfer of rotational kinetic energy at the time of the glitch can be obtained by treating the star as a solid rotating body. Assuming the canonical neutron star moment of inertia of g cm2, the energy deposited in the solid crust at the time of the glitch owing to the increase in is ergs. However, it is well established that neutron stars are comprised of at least two components, a solid crust coupled to the core and a loosely coupled superfluid component in the crust. Taking the two-component model into account but not making any further assumptions about the nature of the two components, we can calculate the energy transferred between the components at the time of the glitch. The first constraint is that angular momentum is conserved, that is,
| (2) |
where is the observed increase in spin-frequency, and is the unknown change in spin-frequency of the superfluid, and and are the moment of inertia of the solid crust and core, and superfluid, respectively. An estimate of the energy contained in the glitch can then be calculated as
| (3) |
The frequency lag between the crust and superfluid can be estimated from the glitch decay time, , as
| (4) |
where is the characteristic age of the pulsar (Shapiro & Teukolsky, 1983). For PSR J18460258, the frequency lag is Hz, giving a glitch energy of ergs for the measured glitch parameters (see Table 1). If the measured glitch decay timescale, , in this case is dominated by processes external to the neutron star (as discussed in Section 5.2), any other glitch decay timescale would occur on a shorter timescale than the one observed, so this estimate of the frequency lag and thus glitch energy can be considered an upper limit.
For a distance to the pulsar of 6 kpc (Leahy & Tian, 2008) the energy estimated to have been released in the bursts and flux flare, assuming isotropic emission, is ergs (2 – 60 keV). A new estimate of the distance to the pulsar of 10 kpc (Su et al., 2009) increases the amount of energy contained in the radiative outburst to ergs (2 – 60 keV). For either distance, the energy contained in the radiative outburst is several orders of magnitude larger than that contained in the glitch. This is similar to the bursts and glitch from 1E 2259+586, for which the energy contained in the glitch was 2 orders of magnitude less than the energy contained in the bursts and flux flare (Woods et al., 2004). This is suggestive that the glitch alone is not responsible for the radiative outburst, in contrast to the argument put forward by Kuiper & Hermsen (2009). Moreover, there is no evidence for this event (or in any other similar AXP event) that the glitch preceded the radiative event. This could be tested only by sensitive continuous X-ray monitoring of this and other similar sources.
5.2 Physical models for “magnetic glitches”
Rotation-powered pulsar glitches are thought to arise from differential rotation in the neutron star, where the crust contains superfluid neutrons rotating more rapidly than the surrounding matter (e.g., Alpar et al., 1984; Alpar & Pines, 1993). The angular momentum of a rotating superfluid is quantized in vortices which are thought to become pinned to nuclei in the star’s crust. The vortex lines are therefore under extreme stresses due to the differential rotation between the crust and the superfluid. It is thought that the vortex lines experience sudden unpinning, resulting in the transfer of angular momentum to the crust, observed as an increase in the spin-frequency of the neutron star. Magnetar glitches may instead be triggered by strong internal magnetic fields as the crust is deformed, either plastically or cracked violently (Thompson & Duncan, 1996). This idea is supported by the large number of glitches now observed to occur at the same epoch as magnetically powered radiative events, such as bursts and flares (e.g., Kaspi et al., 2003; Dib et al., 2009; Israel et al., 2007a).
The physics underlying glitches with is unclear. The classical glitch model of vortex unpinning in the superfluid crust of the neutron star does not readily produce such dramatic glitch recoveries. One possibility is that some parts of the superfluid are in fact rotating more slowly than the crust. Then the initial increase would be from a transfer of angular momentum from a more rapidly rotating region of the superfluid to the crust, which is then followed by a transfer of angular momentum from the crust to the more sluggish region of the superfluid. This is the explanation put forward by Thompson et al. (2000) to explain the net spin-down event in SGR 1900+14. They argue that regions of slowly rotating superfluid can occur in magnetars because vortex motion is dominated by advection across the neutron star surface by the deforming crust and that gradual plastic deformation of the neutron star crust will cause the superfluid to rotate more slowly than the crust. However, it is not clear whether such behavior is expected in a neutron star with a magnetic field of G, spinning relatively rapidly compared to the magnetars.
That the recovery of the PSR J18460258 glitch so far overshoots the initial frequency increase is suggestive of an external torque following the glitch. Previous evidence for an external torque includes the large fraction of implied to have decoupled in the 1E 2259+586 glitch. However, this may also be explained with a core glitch, that is, where the core of the pulsar (and thus a large fraction of ) decouples temporarily from the crust (Kaspi & Gavriil, 2003; Woods et al., 2004). In PSR J18460258, however, the post-glitch relaxation amplitude is much greater than the initial glitch amplitude, offering support for the idea that the post-glitch spin-down behavior results from an external source.
One possibility is that a magnetic field twist responsible for the X-ray bursts and flux enhancement also affects the spin-down of the pulsar. In this case the observed recovery is driven by the propagation of magnetic field untwisting (similar to a shock wave) through the magnetosphere. During this process, the spin-down of the star may increase because the effective magnetic field has increased. When the “shock” reaches the light cylinder, which can take place on few month time scales, the spin-down should return to its pre-burst value (Beloborodov, 2009). This theory also allows for non-monotonic behavior in the spin-down after an event, as observed in both AXP 1E 1048.15937 (Gavriil & Kaspi, 2004; Dib et al., 2009) and PSR J18460258. This model allows for a delay between flux variations and the onset of timing variability, as was observed in 1E 1048.15937, though not observed in PSR J18460258. However, as in the model of variably rotating superfluid, it is not immediately clear how the more rapid rotation and smaller magnetic field affect the relevance of this model. In particular, the different light cylinder radii of PSR J18460258 compared to the AXPs should result in different shock propagation times.
Alternatively, it has been proposed that fallback disks from the supernova explosion creating the neutron star could be interacting with magnetars and be responsible for some of the observed emission (e.g., Chatterjee et al., 2000; Alpar, 2001). In this case, the initial X-ray bursts could irradiate a fossil disk commencing a period of disk activity. The interaction between the neutron star and a disk could cause the enhanced spin-down, which would decay as the disk cooled. However, in the framework of this model, it is difficult to understand how accretion causing variations in the spin-down rate could continue for so much longer than the pulsed-flux enhancement.
5.3 Magnetar and High-B Radio Pulsar Properties
Another RPP, PSR J11196127, has very similar spin properties to PSR J18460258. Its , , and are all similar, and notably, it has a similarly large magnetic field of G (Camilo et al., 2000). This pulsar has shown some indication of unusual X-ray emission. No magnetospheric X-ray emission is detected, but thermal pulsations with a pulsed fraction and a large surface temperature are detected (Gonzalez et al., 2005). No direct evidence of magnetic activity (i.e. bursts or flux enhancements) is present in this pulsar. Given the similarities between PSR J11196127 and PSR J18460258, both sources, as well as other high B-field RPPs are currently being monitored with RXTE for similar magnetic activity.
PSR J18460258 may be related to the transient AXPs (TAXPs). PSR J18460258 appears to be a typical RPP for of the time, with brief periods of magnetic activity occurring approximately once a decade. The TAXP XTE J1810197 increased in brightness by a factor of 100 and was subsequently visible for several years as a pulsed X-ray source (Ibrahim et al., 2004; Halpern & Gotthelf, 2005). Another TAXP, 1E 15475408 was detected as a pulsed radio source after an X-ray outburst in which the flux increased by at least a factor of 16 (Camilo et al., 2007). Interestingly, both XTE J1810197 and 1E 15475408, two bona fide TAXPs, are the only two magnetars with detected radio pulsations. By contrast, no radio pulsations have been detected from PSR J18460258 despite extensive searches both before and after the magnetic activity (Kaspi et al., 1996; Archibald et al., 2008).
6 Conclusions
In RXTE observations of PSR J18460258, we have observed a large glitch with an unusual quasi-exponential over-recovery of and substantial timing noise contemporaneous with X-ray bursts and a flux increase. These observations strengthen the tie between magnetic activity in neutron stars and unusual glitch activity, as has been previously noted (e.g., Dib et al., 2008). A glitch with recovery fraction has never before been observed from a rotation-powered pulsar and is not compatible with the standard model of pulsar glitches. The unusually large glitch recovery reported here for PSR J18460258, as well as the radiative changes occurring contemporaneously with the PSR J18460258 glitch and several AXP glitches, together provide the best evidence that there are physical differences between typical RPP glitches and some glitches observed in magnetars.
Ongoing timing observations of PSR J18460258 are required to obtain a deterministic post-outburst braking index measurement that is uncontaminated by long-term glitch recovery. A measurement of the braking index for this source after outburst is of considerable interest as a change would strongly suggest that a magnetic reconfiguration occurred at the time of the outburst.
References
- Alpar (2001) Alpar, M. A. 2001, ApJ, 554, 1245
- Alpar et al. (1984) Alpar, M. A., Anderson, P. W., Pines, D., & Shaham, J. 1984, ApJ, 276, 325
- Alpar et al. (1993) Alpar, M. A., Chau, H. F., Cheng, K. S., & Pines, D. 1993, ApJ, 409, 345
- Alpar & Pines (1993) Alpar, M. A. & Pines, D. 1993, in Isolated Pulsars, ed. R. E. K. A. van Riper & C. Ho (Cambridge University Press), 17–27
- Archibald et al. (2008) Archibald, A. M., Kaspi, V. M., Livingstone, M. A., & McLaughlin, M. A. 2008, ApJ, 688, 550
- Beloborodov (2009) Beloborodov, A. M. 2009, ApJ, 703, 1044
- Camilo et al. (2000) Camilo, F., Kaspi, V. M., Lyne, A. G., Manchester, R. N., Bell, J. F., D’Amico, N., McKay, N. P. F., & Crawford, F. 2000, ApJ, 541, 367
- Camilo et al. (2007) Camilo, F., Ransom, S. M., Halpern, J. P., & Reynolds, J. 2007, ApJ, 666, L93
- Campana et al. (2007) Campana, S., Rea, N., Israel, G. L., Turolla, R., & Zane, S. 2007, A&A, 463, 1047
- Chatterjee et al. (2000) Chatterjee, P., Hernquist, L., & Narayan, R. 2000, ApJ, 534, 373
- Dall’Osso et al. (2003) Dall’Osso, S., Israel, G. L., Stella, L., Possenti, A., & Perozzi, E. 2003, ApJ, 599, 485
- Dib et al. (2008) Dib, R., Kaspi, V. M., & Gavriil, F. P. 2008a, ApJ, 673, 1044
- Dib et al. (2009) —. 2009b, ApJ, 702, 614
- Flanagan (1990) Flanagan, C. S. 1990, Nature, 345, 416
- Gavriil et al. (2009) Gavriil, F. P., Dib, R., & Kaspi, V. M. 2009, ApJ Submitted (arXiv:0905.1256)
- Gavriil et al. (2008) Gavriil, F. P., Gonzalez, M. E., Gotthelf, E. V., Kaspi, V. M., Livingstone, M. A., & Woods, P. M. 2008, Science, 319, 1802
- Gavriil & Kaspi (2004) Gavriil, F. P. & Kaspi, V. M. 2004, ApJ, 609, L67
- Gavriil et al. (2002) Gavriil, F. P., Kaspi, V. M., & Woods, P. M. 2002, Nature, 419, 142
- Gonzalez et al. (2005) Gonzalez, M. E., Kaspi, V. M., Camilo, F., Gaensler, B. M., & Pivovaroff, M. J. 2005, ApJ, 630, 489
- Gotthelf et al. (2000) Gotthelf, E. V., Vasisht, G., Boylan-Kolchin, M., & Torii, K. 2000, ApJ, 542, L37
- Halpern & Gotthelf (2005) Halpern, J. P. & Gotthelf, E. V. 2005, ApJ, 618, 874
- Helfand et al. (2003) Helfand, D. J., Collins, B. F., & Gotthelf, E. V. 2003, 582, 783
- Helfand et al. (2001) Helfand, D. J., Gotthelf, E. V., & Halpern, J. P. 2001, ApJ, 556, 380
- Hobbs et al. (2002) Hobbs, G., Lyne, A. G., Joshi, B. C., Kramer, M., Stairs, I. H., Camilo, F., Manchester, R. N., D’Amico, N., Possenti, A., & Kaspi, V. M. 2002, MNRAS, 333, L7
- Ibrahim et al. (2004) Ibrahim, A. I., Markwardt, C. B., Swank, J. H., Ransom, S., Roberts, M., Kaspi, V., Woods, P. M., Safi-Harb, S., Balman, S., Parke, W. C., Kouveliotou, C., Hurley, K., & Cline, T. 2004, ApJ, 609, L21
- Israel et al. (2007a) Israel, G. L., Campana, S., Dall’Osso, S., Muno, M. P., Cummings, J., Perna, R., & Stella, L. 2007a, ApJ, 664, 448
- Israel et al. (2007b) Israel, G. L., Götz, D., Zane, S., Dall’Osso, S., Rea, N., & Stella, L. 2007b, A&A, 476, L9
- Jahoda et al. (2006) Jahoda, K., Markwardt, C. B., Radeva, Y., Rots, A. H., Stark, M. J., Swank, J. H., Strohmayer, T. E., & Zhang, W. 2006, ApJS, 163, 401
- Jahoda et al. (1996) Jahoda, K., Swank, J. H., Giles, A. B., Stark, M. J., Strohmayer, T., Zhang, W., & Morgan, E. H. 1996, Proc. SPIE, 2808, 59
- Janssen & Stappers (2006) Janssen, G. H. & Stappers, B. W. 2006, A&A, 457, 611
- Kaspi & Gavriil (2003) Kaspi, V. M. & Gavriil, F. P. 2003, ApJ, 596, L71
- Kaspi et al. (2003) Kaspi, V. M., Gavriil, F. P., Woods, P. M., Jensen, J. B., Roberts, M. S. E., & Chakrabarty, D. 2003, ApJ, 588, L93
- Kaspi et al. (2000) Kaspi, V. M., Lackey, J. R., & Chakrabarty, D. 2000, ApJ, 537, L31
- Kaspi et al. (1996) Kaspi, V. M., Manchester, R. N., Johnston, S., Lyne, A. G., & D’Amico, N. 1996, AJ, 111, 2028
- Kuiper & Hermsen (2009) Kuiper, L. & Hermsen, W. 2009, A&AS, 501, 1031
- Kumar & Safi-Harb (2008) Kumar, H. S. & Safi-Harb, S. 2008, ApJ, 678, L43
- Leahy & Tian (2008) Leahy, D. A. & Tian, W. W. 2008, A&AS, 480, L25
- Livingstone et al. (2005) Livingstone, M. A., Kaspi, V. M., & Gavriil, F. P. 2005, ApJ, 633, 1095
- Livingstone et al. (2006) Livingstone, M. A., Kaspi, V. M., Gotthelf, E. V., & Kuiper, L. 2006, ApJ, 647, 1286
- Lohsen (1981) Lohsen, E. H. G. 1981, A&AS, 44, 1
- Lyne et al. (2000) Lyne, A. G., Shemar, S. L., & Graham-Smith, F. 2000, MNRAS, 315, 534
- Lyne & Smith (2005) Lyne, A. G. & Smith, F. G. 2005, Pulsar Astronomy, 3rd ed. (Cambridge: Cambridge University Press)
- Manchester & Taylor (1977) Manchester, R. N. & Taylor, J. H. 1977, Pulsars (San Francisco: Freeman)
- Ng et al. (2008) Ng, C.-Y., Slane, P. O., Gaensler, B. M., & Hughes, J. P. 2008, ApJ, 686, 508
- Peralta (2006) Peralta, C. 2006, Ph.D. Thesis, University of Melbourne
- Rea et al. (2005) Rea, N., Oosterbroek, T., Zane, S., Turolla, R., Méndez, M., Israel, G. L., Stella, L., & Haberl, F. 2005, MNRAS, 361, 710
- Shapiro & Teukolsky (1983) Shapiro, S. L. & Teukolsky, S. A. 1983, Black Holes, White Dwarfs, and Neutron Stars: The Physics of Compact Objects. (New York: Wiley)
- Shemar & Lyne (1996) Shemar, S. L. & Lyne, A. G. 1996, MNRAS, 282, 677
- Su et al. (2009) Su, Y., Chen, Y., Yang, J., Koo, B.-C., Zhou, X., Jeong, I.-G., & Zhang, C.-G. 2009, ApJ, 694, 376
- Thompson & Duncan (1995) Thompson, C. & Duncan, R. C. 1995, MNRAS, 275, 255
- Thompson & Duncan (1996) Thompson, C. & Duncan, R. C. 1996, ApJ, 473, 322
- Thompson et al. (2000) Thompson, C., Duncan, R. C., Woods, P. M., Kouveliotou, C., Finger, M. H., & van Paradijs, J. 2000, ApJ, 543, 340
- Wang et al. (2000) Wang, N., Manchester, R. N., Pace, R., Bailes, M., Kaspi, V. M., Stappers, B. W., & Lyne, A. G. 2000, MNRAS, 317, 843
- Wong et al. (2001) Wong, T., Backer, D. C., & Lyne, A. 2001, ApJ, 548, 447
- Woods et al. (2004) Woods, P. M., Kaspi, V. M., Thompson, C., Gavriil, F. P., Marshall, H. L., Chakrabarty, D., Flanagan, K., Heyl, J., & Hernquist, L. 2004, ApJ, 605, 378
- Woods et al. (1999) Woods, P. M., Kouveliotou, C., van Paradijs, J., Finger, M. H., & Thompson, C. 1999, ApJ, 518, L103
- Zhu et al. (2008) Zhu, W., Kaspi, V. M., Dib, R., Woods, P. M., Gavriil, F. P., & Archibald, A. M. 2008, ApJ, 686, 520
| Parameter | Value |
|---|---|
| Epoch (Modified Julian Day) | 53883.0(3.0) |
| 0.0041(2) | |
| (days) | 127(5) |
| 8.7(2.5) | |
Figures in parentheses are uncertainties in the last digits quoted and are the estimated uncertainties from the fitted exponential glitch recovery model using contours. The model is fitted to data with uncertainties that are increased by a factor until (see Section 3 for details).