basicstyle=, showstringspaces=false, emph=Package,Version,Build,Depends,Conflicts,Provides, keywordstyle=, emphstyle=,
Specific Targeted Research Project Contract no.214898 Seventh Framework Programme: FP7-ICT-2007-1
![[Uncaptioned image]](/html/0905.4226/assets/x1.png)
![[Uncaptioned image]](/html/0905.4226/assets/x2.png) Technical Report 0002
Technical Report 0002
MANCOOSI
Managing the Complexity of the Open Source Infrastructure
Strong Dependencies between Software Components
| Pietro Abate (pietro.abate@pps.jussieu.fr) |
| Jaap Boender (jaap.boender@pps.jussieu.fr) |
| Roberto Di Cosmo (roberto@dicosmo.org) |
| Stefano Zacchiroli (zack@pps.jussieu.fr) |
Universitè Paris Diderot, PPS
UMR 7126, Paris, France
Web site: www.mancoosi.org
Abstract
Component-based systems often describe context requirements in terms of explicit inter-component dependencies. Studying large instances of such systems—such as free and open source software (FOSS) distributions—in terms of declared dependencies between packages is appealing. It is however also misleading when the language to express dependencies is as expressive as boolean formulae, which is often the case. In such settings, a more appropriate notion of component dependency exists: strong dependency. This paper introduces such notion as a first step towards modeling semantic, rather then syntactic, inter-component relationships.
Furthermore, a notion of component sensitivity is derived from strong dependencies, with applications to quality assurance and to the evaluation of upgrade risks. An empirical study of strong dependencies and sensitivity is presented, in the context of one of the largest, freely available, component-based system.
1 Introduction
Component-based software architectures [21] have the property of being upgradeable piece-wise, without necessarily touching all the pieces at the same time. The more pieces are affected by a single upgrade, the higher the impact of the upgrade can be on the usual operations performed by the overall system; this impact can either be beneficial (if the upgrade works as planned) or disastrous (if not). Package-based FOSS (Free and Open Source Software) distributions are possibly the largest-scale examples of component-based architectures, their upgrade effects are experienced daily by million of users world-wide, and the historical data concerning their evolution is publicly available.
Within FOSS distributions, software components are managed as packages [6]. Packages are described with meta-information, which include complex inter-relationships describing the static requirements to run properly on a target system. Requirements are expressed in terms of other packages, possibly with restrictions on the desired versions. Both positive requirements (dependencies) and negative requirements (conflicts) are usually allowed.
Example 1.1.
An excerpt of the inter-package relationships of the postfix Internet mail transport agent in Debian GNU/Linux222http://www.debian.org currently reads:
As this short example shows, inter-package relationships can get quite complex, and there are plenty of more complex examples to be found in distributions like Debian. In particular, the language to express package relationships is not as simple as flat lists of component predicates, but rather a structured language whose syntax and semantics is expressed by conjunctive normal form (CNF) formulae [17]. In Example 1.1, commas represent logical conjunctions among predicates, whereas bars (“|”) represent logical disjunctions. Also, indirections by the mean of so-called virtual packages can be used to declare feature names over which other packages can declare relationships; in the example (see: “Provides”) the package declares to provide the features called postfix-tls and mail-transport-agent.
Within this setting, it is interesting to analyse the dependency graph of all packages shipped by a mainstream FOSS distribution. This graph is potentially very large as distributions like Debian are composed of several tens of thousands packages but it is surely smaller than widely studied graphs such as the World Wide Web graph [1]. It is also more expressive, in the sense that it contains different types of edges (dependencies and conflicts for example) and allows the use of disjunctions to express alternative paths. Simple graph encodings of the package universe have been proposed in the past [14, 16], to study the adherence of the dependency graph to small-world network laws. In such encodings, inter-package relationships were approximated by a simple binary relation of direct dependency, which is noted in this paper. Formally, holds whenever package occurs syntactically in the dependency formula of . This notion of direct dependency does not distinguish between occurring in conjunctive or disjunctive position, ignoring the semantic difference between conjunctive and disjunctive dependencies, as well as the presence of conflicts among components.
In this paper we argue that there is a different dependency graph to be studied to grasp meaningful relationships among software components: a graph that represents the semantics of inter-component relationships, in which an edge between two components is drawn only if the first cannot be installed without installing the second. We call such a graph the strong dependency graph, argue that it is better suited to study package universes in component-based architectures, and study its network properties. Finally, we argue that the strong dependency graph can be used to establish a measure of package “sensitivity” which has several uses, from distribution wide quality assurance to establishing the potential risks of package upgrades. As a relevant, yet empirical, case study we build and analyse the strong dependency graph of present and past FOSS distributions, as well as the corresponding package sensitivity.
The rest of the paper is structured as follows: Section 2 introduces the notion of strong dependency, highlights the differences with plain dependencies and proposes related sensitivity metrics. Section 3 computes dependencies and sensitivity of components of a large and popular FOSS distribution. Section 4 gives an efficient algorithm to compute strong dependencies for large software repositories. Section 5 discusses applications of the proposed metrics for quality assurance and upgrade risk evaluation. Before concluding, Section 6 discusses related research.
2 Strong dependencies
Component dependencies can be used to compute relevant quality measures of software repositories, for instance to identify particularly fragile components [7, 13, 15]. It is well known that small-world networks are resilient to random failures but particularly weak in the presence of attacks, due to the existence of highly connected hub nodes [2]. To identify the components whose modification (e.g., removal or upgrade) can have a high potential impact on the stability of a complex software system, it is natural to look for hubs on which a lot of other components depend.
In FOSS distributions, as well as many other component-based systems [3, 4], the language used to express inter-package relationships is expressive enough to cover propositional logic. As a consequence, considering only plain connectivity—i.e., the possibility of going from one package to another following dependency arcs—is no longer meaningful to identify hubs. For example, if is to be installed and there exists a dependency path from to , it is not true that is always needed for , and in some cases may even be incompatible with .
In other terms, the syntactic connectivity notion does not tell much about the real structure of dependencies: we need to go further and analyse the semantic connectivity among software components induced by the explicit dependencies in the graph. That led us to the following definition.
Definition 2.1 (Strong dependency).
Given a repository , we say that a package in strongly depends on a package in , written , if there exists a healthy installation of containing , and every healthy installation of containing also contains . We write for the set of strong predecessors of a package in , and for the set of strong successors of in .
In the following, we will drop the subscript when the repository is clear from the context.
The notions of repository and healthy installation used here are from [17]; the underlying intuitions are as follows. A repository is a set of packages, together with dependencies and conflicts encoded as propositional logic predicates over other packages contained therein; an installation is a subset of the repository; an installation is said to be healthy when all its packages have their dependencies satisfied within the installation and dually their conflicts unsatisfied.
Intuitively, strongly depends on with respect to if it is not possible to install without also installing . Notice that the definition requires to be installable in as otherwise it would vacuously depend on all the packages in the repository. Due to the complex nature of dependencies, there can be a huge gap with the syntactic dependency graph as naively extracted from the metadata.
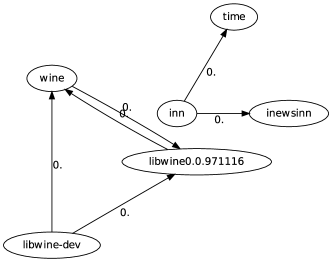
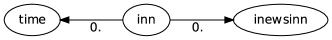
Example 2.2 (Direct and strong dependencies).
In simple cases, conjunctive direct dependencies translate to identical strong dependencies whereas disjunctive ones vanish, as for the packages of the following repository:
We have that and (because cannot be installed without either or ), and that whereas (because does not forcibly require neither nor ). In general however, the situation is much more complex, like in the following repository:
Notice that in spite of not being a conjunctive dependency of , and is incompatible with , despite the fact that .
Proposition 2.3 (Transitivity).
If and then .
Proof.
Trivial from Definition 2.1. ∎
On top of the strong and direct dependency notions, we can define the corresponding dependency graphs.
Definition 2.4 (Dependency graphs).
The strong dependency graph of a repository is the directed graph having as vertices the packages in and as edges all pairs such that . Note that the is transitively closed as direct consequence as the transitivity of the strong dependency relation.
Similarly, the direct dependency graph is the directed graph having as vertices the packages in and as edges all pairs such that .
The dependency graphs can be used to formalise, via the notion of impact set, the intuitive notion of the set of packages which are potentially affected by changes in a given package.
Definition 2.5 (Impact set of a component).
Given a repository and a package in , the impact set of in is the set .
Similarly, the direct impact set of is the set .
While the impact set gives a sound lower bound to the set of packages which can be potentially affected by a change in a package, the direct impact set offers no similar guarantees. Note that by Definition 2.1, for all package , . Package sensitivity—a measure of how sensitive is a package, in terms of how many other packages can be affected by a change in it—can now be defined as follows.
Definition 2.6 (Sensitivity).
The strong sensitivity, or simply sensitivity, of a package is , i.e., the cardinality of the impact set minus 1.333The accounts for the fact that the impact set of a package always contains itself. This way we ensure that sensitivity 0 preserves the intuitive meaning of “no package potentially affected”.
Similarly, the direct sensitivity is the cardinality of the direct impact set.
The higher the sensitivity of a package , the higher the minimum number of packages which will be potentially affected by a change, such as a new bug, introduced in . We write and to denote the direct and strong sensitivity of package , respectively. The following basic property of impact sets and sensitivity follows easily from the definitions.
Proposition 2.7 (Inclusion of impact sets).
If then . As a consequence, the sensitivity of in is smaller than the sensitivity of in .
When analysing a large component base, like Debian’s, which contains about 22’000 components, it is important to be able to identify some measure that can be used to easily pinpoint “interesting” packages. Sensitivity can be (and actually is, in our tools) used to order packages, bringing the most sensitive to the forefront. But sensitivity alone is not enough: we do not want to spend time going through hundreds of packages with similar sensitivity to find the one which is really important, so we need to keep some of the structure of the strong dependency graph.
A first step is to group together only those packages that are related by strong dependencies, but our analysis of the Debian distribution led us to discover that we really need to go further and distinguish the cases of related components in the strong dependency graph from the cases of unrelated ones: in the picture in figure 1444Edges implied by transitivity are omitted from the diagrams for the sake of clarity., configuration 1c shows that clearly dominates , as the impact set of really comes from that of , in configuration 1d, and are clearly equivalent, while in configuration 1a, and are totally unrelated, and in configuration 1b, strong depends on but does not generate all the impact set of .
Yet, the packages and all have essentially the same sensitivity values ( or ) in all the first three cases (and in the fourth, which can also contribute to the mass of packages of sensitivity similar to ). To distinguish these different configurations in strong dependency graphs, we introduce one last notion.
Definition 2.8 (Strong dominance).
Given two packages and in a repository , we say that strongly dominates () iff
-
•
, and
-
•
strongly depends on
The intuition of strong dominance, is that a package dominates if the strong dependency of on explains the impact set of : the packages that has an impact on are really those that has an impact on, plus . This notion has some similarity in spirit with the standard notion of dominance used in control flow graphs, but is technically quite different, as strong dependency graphs are transitive, and have no start node.
Using the transitivity of strong dependencies, the following can be established.
Proposition 2.9.
The strong domination relation is a partial pre-order.
Proof.
Reflexivity is trivial to check. For transitivity, suppose we have and : first of all, strongly depends on is a direct consequence of the fact that the strong dependency relation is transitive, so the second condition for is established. For the first condition, we know that and . By transitivity of strong dependencies, since , we also have that . Then we have easily that . ∎
This pre-order is now able to distinguish among the cases of Figure 1. In Figure 1c we have that , but not the converse; in 1d both and hold, i.e., and are equivalent according to strong domination; in 1a and 1b no dominance relationship can be established between and .
It is possible, and actually quite useful, to generalise the strong dominance relation to cover also the case shown in 1b, where a part of the impact set of the package is not covered by the impact set of , as follows.
Definition 2.10 (Relative strong dominance).
Given two packages and in a repository , we say that
strongly dominates up to () iff
-
•
, and
-
•
strongly depends on
It is easy to see that iff , and one can compute in a single pass on the repository the values for each pair of packages such that , leaving for later the choice of a threshold value for . In the case of figure 1b, we have that dominates up to .
We have computed strong dominance graphs for state of the art FOSS distributions, obtaining concise visual representations of clusters of packages intertwined by strong dependencies; Appendix I contains some of those graphs.
3 Strong dependencies in Debian
Due to the different properties of direct and strong dependencies,the two measures of package sensitivity can differ substantially. To verify that, as well as other properties of the underlying dependency graphs, we have chosen Debian GNU/Linux as a case study.555The data presents in this section, as well as what was omitted due to space constraints, are available to download from http://www.mancoosi.org/data/strongdeps/. The tools used to compute the data are released under open source licenses and are available from the Subversion repository at https://gforge.info.ucl.ac.be/svn/mancoosi.The choice is not casual: Debian is the largest FOSS distribution in terms of number of packages (about in the latest stable release) and, to the best of our knowledge, the largest component-based system freely available for study.
All stable releases of Debian have been considered, from 1994 to February 2009. For each release the archive section main and in particular the i386 architecture has been considered; the choices are justified by the fact that they identify both the most used parts of Debian,666According to the Debian popularity contest, available at http://popcon.debian.org and that they are the only parts which have been part of all Debian releases and hence can be better compared across years. The obtained archive parts have been analysed by building both the direct and strong dependency graphs; while the construction of the former is a trivial exercise, the implemented efficient way of constructing the latter is discussed in Section 4. To build the direct dependency graph the Depends and Pre-Depends inter-package relationships have been considered [12].
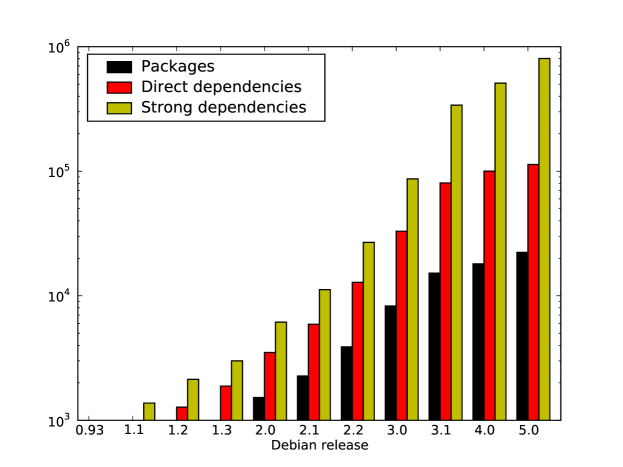
Figure 2 shows the resulting evolution of the number of graph nodes and edges across all Debian releases. The size of the distribution has grown steadily, yet super-linearly, across most releases [20, 11], but the growth rate has decreased in the past two releases. As expected, strong and direct sensitivity are not entirely unrelated, given that the former is the semantic view of the latter, hence they tend to grow together.
More precisely the total number of strong dependencies is higher, in all releases, than the total number of direct dependencies. A partial explanation comes from the fact that the strong dependency graph is a transitive closed graph—property inherited by the underlying strong dependency relationship—whereas the direct dependency graph is not. Performing the transitive closure of the direct dependency graph however would be meaningless, because the propagation rules of disjunctive and conjunctive dependencies are not expressible simply in terms of transitive arcs.
| Rel. | ||||
|---|---|---|---|---|
| 0.93 | 0.92 | 1.00, 2.79 | 1.05, 4.73 | 1.00, 4.00 |
| 1.1 | 0.93 | 1.70, 13.91 | 2.90, 25.96 | 1.88, 18.56 |
| 1.2 | 0.91 | 1.79, 18.43 | 2.99, 32.27 | 1.73, 22.42 |
| 1.3 | 0.91 | 1.92, 21.95 | 3.06, 38.24 | 1.69, 25.85 |
| 2.0 | 0.93 | 2.29, 26.73 | 4.03, 50.88 | 2.50, 36.56 |
| 2.1 | 0.94 | 2.60, 34.92 | 4.93, 64.55 | 2.93, 46.61 |
| 2.2 | 0.92 | 3.29, 44.24 | 6.89, 90.47 | 4.88, 68.76 |
| 3.0 | 0.92 | 3.99, 59.25 | 10.49, 131.5 | 8.02, 92.34 |
| 3.1 | 0.92 | 5.29, 91.42 | 22.36, 282.0 | 19.39 , 246.4 |
| 4.0 | 0.92 | 5.55, 85.10 | 28.23, 352.4 | 24.50 , 313.9 |
| 5.0 | 0.93 | 5.07, 86.16 | 36.05, 480.3 | 32.55 , 440.1 |
We have studied the apparent correlation between strong and direct dependencies analysing the respective sensitivity measures for each release. Table 1 confirms the correlation and gives some statistical data about package sensitivity. The first column is the Spearman correlation index,777The statistical info for the first two rows are possibly not relevant, due to the small size of the two releases. a commonly used non-parametric correlation index that is not sensible to exceptional values [8]. An index between 0.5 and 1.0—in all the releases we have —is commonly interpreted as a strong correlation between the two variables. The more common correlation index for the same set of data (not shown in the table) gives consistently a value of : the huge difference among and indicates that the few exceptional values in the data series have really high weight, and we will see, when looking at some of these exceptional value that this is indeed the case.
The remaining columns show mean and standard deviation for, respectively, direct sensitivity, strong sensitivity, and . In particular we note an increasingly high standard deviation in latest Debian releases, which hints that there is an increasing number of peaks.
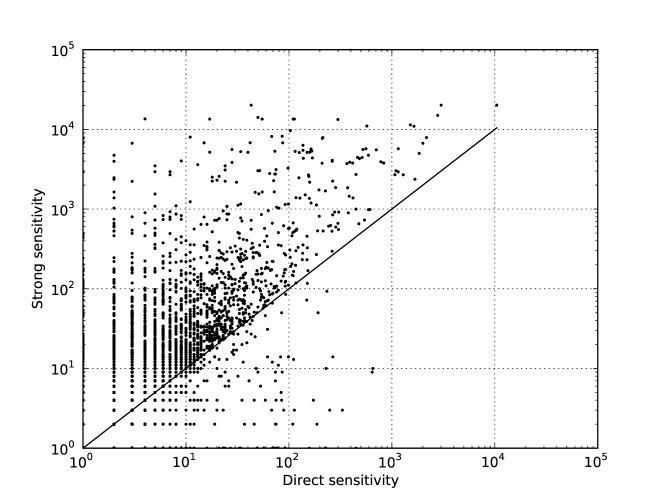
Figure 3 shows in more detail the correlation phenomenon for Debian 5.0 “Lenny”, the latest and largest Debian release. The figure plots strong vs direct dependencies for each package in the release. In most cases, strong sensitivity is higher than direct sensitivity, yet close: 82.9% of the packages fall in a standard deviation interval from the mean of ; the next percentile ranks are 97.4% for two standard deviations, and 99.8% for three. The remaining cases allow for important exceptions of packages with very high strong sensitivity and very low direct sensitivity. Such exceptions are extremely relevant: metrics built on direct sensitivity only would totally overlook packages with a huge potential impact.
| # | Package | |||
|---|---|---|---|---|
| 1 | gcc-4.3-base | 43 | 20128 | 20085 |
| 2 | libgcc1 | 3011 | 20126 | 17115 |
| 3 | libselinux1 | 50 | 14121 | 14071 |
| 4 | lzma | 4 | 13534 | 13530 |
| 5 | coreutils | 17 | 13454 | 13437 |
| 6 | dpkg | 55 | 13450 | 13395 |
| 7 | libattr1 | 110 | 13489 | 13379 |
| 8 | libacl1 | 113 | 13467 | 13354 |
| 9 | perl-base | 299 | 13310 | 13011 |
| 10 | libstdc++6 | 2786 | 14964 | 12178 |
| 11 | libncurses5 | 572 | 11017 | 10445 |
| 12 | debconf | 1512 | 11387 | 9875 |
| 13 | libc6 | 10442 | 20126 | 9684 |
| 14 | libdb4.6 | 103 | 9640 | 9537 |
| 15 | zlib1g | 1640 | 10945 | 9305 |
| 16 | debianutils | 86 | 8204 | 8118 |
| 17 | libgdbm3 | 68 | 8148 | 8080 |
| 18 | sed | 11 | 8008 | 7997 |
| 19 | ncurses-bin | 1 | 7721 | 7720 |
| 20 | perl-modules | 214 | 7898 | 7684 |
| 21 | lsb-base | 211 | 7720 | 7509 |
| 22 | libxdmcp6 | 15 | 6782 | 6767 |
| 23 | libxau6 | 42 | 6795 | 6753 |
| 24 | libx11-data | 1 | 6693 | 6692 |
| 25 | libxcb-xlib0 | 3 | 6695 | 6692 |
| 26 | libxcb1 | 87 | 6778 | 6691 |
| 27 | x11-common | 137 | 6317 | 6180 |
| 28 | perl | 2169 | 7898 | 5729 |
| 29 | libmagic1 | 28 | 5585 | 5557 |
| 30 | libpcre3 | 164 | 5668 | 5504 |
| … | ||||
3.1 Strong vs direct sensitivity: exceptions
It’s time now to look at some of these exceptional cases to see how relevant they are. Table 2 lists the top 30 packages of Lenny having the largest .
libc6 is the package shipping the C standard library which is required, directly or not, by almost all applications written or otherwise linked to the C programming language. About a half of all the packages in the distribution depends directly on libc6, as can be seen in row 13 of the table, but almost all packages in the archive cannot be installed without it, as the strong sensitivity of libc6 is 20’126, on a total of 22’311 packages. In this case direct sensitivity does not inhibit identifying the package as a sensitive one, though, even if it underestimates widely its importance.
Now consider row 1 of Table 2: gcc-4.3-base, which is a package without which libc6 cannot be installed. It is the package with the largest , having direct sensitivity of only 43 and strong sensitivity of 20’128. Ranking its sensitivity with the direct metric would have led to completely miss its importance: a bug into it can potentially affect all packages in the distribution. Note however that gcc-4.3-base is not a direct dependency of libc6, showing once more that to grasp this kind of inter-package relationships the semantics, rather than the syntax, of dependencies must be put into play.
In the second row, libgcc1 shows a similar pattern, being this time a direct dependency of libc6. The third row and many others in the table show more complex patterns. Ordering packages only according to sensitivity might lead to oversee other important characteristic. Possibly the most extreme cases are those of ncurses-bin and libx11-data, which are mentioned just once in all the explicit dependencies, and yet are really necessary for several thousand other packages.
We believe this is sufficiently conclusive evidence to totally dismiss, from now on, any analysis based on the syntactic, direct dependency graph, when considering component based systems with complex dependency languages.
3.2 Using strong dominance to cluster data
Now we turn to the problem of presenting the sensitiveness information in
a relevant way to a Quality Assurance team: we could simply print a list
of package names, ordered by their sensitiveness; this would give a result
quite similar to that of table 2 above, just
dropping the first and fourth column. A smart Debian maintainer will surely
spot the fact that gcc-4.2-base, libgcc1 and libc6 are
related and would look at them together, but it would be difficult to
see relationships among the other packages in the list, even if we can
see that many packages have impact sets of similar size.

Here is where our definition of relative strong dominance comes into play, allowing to build meaningful clusters that provide sensible information to the maintainers: Figure 4 shows the graph of relative strong domination between the first packages of Table 2. Bold edges show strong domination as defined in Definition 2.8. Normal edges show relative domination, where the install sets of the two packages almost fully overlap, apart from a few packages (edges are labelled with the percentage of Definition 2.10).
This figure shows clearly that it is possible to isolate five clusters of related packages with similar sensitivity values; some of them may look surprising at first sight to a Debian maintainer, and evident after a little time spent exploring the package metadata: this actually confirms the real value of this way of presenting data.
3.3 Debian is a small world
We expected the strong dependency graph to retain the small world characteristics previously established for the direct dependency graph [14], but this required some extra effort to get sensible results: indeed, computing clustering coefficients and other similar measures on the strong dependency graph will yield very different values (as the strong dependency graph is transitive), so we first built a detransitivised version of the strong dependency graph, and computed the usual small world measures on it.
Note that, since the strong dependency graph contains some cycles, the graph obtained by detransitivising it is not unique. The differences are however minor enough to not alter the overall results.
| Direct dependency graph | Strong depedency graph | |
| Vertices | 22 311 | 22 311 |
| Edges | 107 796 | 40 074 |
| Average degree | 4.83 | 1.80 |
| Clustering coeff. | 0.41 | 0.39 |
| Average distance | 3.18 | 2.86 |
| Components (WCCs) | 1425 | 2809 |
| Largest WCC | 20 831 | 19 200 |
| Density | 0.00022 | 0.000081 |
The clustering coefficient and average path length of the detransitivised graph are, though slightly smaller, well within the range of small-world networks. More than half the edges of the syntactic graph have disappeared, but this has not significantly affected either the graph clustering or the path length. The relevant statistics are summarised in Table 3.
Some further notes from Table 3. First, both graphs contain one enormous (weakly connected) component, next to which all other components are of insignificant size (for the direct graph, there are 1’480 remaining packages in 1’424 components, which would make their average size just above 1; the ratio is similar for the strong graph). Second, when we look at the density of both graphs (the number of edges in the graph divided by the maximum possible number of edges), we see that both graphs are extremely sparse.
4 Efficient computation
It is not evident that strong dependencies as defined in Section 2 are actually tractable in practise: from previous results [17, 5] it is known that checking installability of a package (or co-installability of a set of packages) is an NP-complete problem. Even if in practise checking installability turns out to be tractable on real-world problem instances, the sheer number of instances that computing strong dependencies may require in general makes the problem in principle much harder. We start by observing that the problem of determining strong dependencies is decidable.
Proposition 4.1 (Decidability).
Strong dependencies for packages in a finite repository are computable.
Proof.
Since is finite, the set of all installations is also finite. Among these installations, finding the healthy one is just a matter of verifying locally the dependency relations. Then, for each and , it is enough to check all healthy installations to see whether is present whenever is. ∎
If we want to know if a particular packages strongly depends on in a repository however, the argument used in the proof of decidability leads to an algorithm that has exponential worst-case complexity in the size of a repository . One possible algorithm to find all strong dependencies in a repository is as follows.
Where the function uses a SAT solver to check whether it is possible to install without installing (in repository ). This algorithm requires checking SAT instances, which is unfeasible with . We need to look for an optimised approach; the following remark is the key observation.
Remark 4.2 (Reducing the search space).
All packages on which a given package strongly depends are included in any installation of . Furthermore, if a package conjunctively depends on a package , then is a strong dependency of .
This leads to the following improved algorithm that strongly relies on the notion of installation sets and the property of transitivity of strong dependencies.
The function returns all packages in that are connected to , considering only conjunctive paths. We add to the set all couples such that there exists a conjunctive path between and , and then for all remaining packages in the install set of , we check if there is a strong dependency using the SAT solver.
On one hand, the analysis of the structure of the repositories shows that it is in practice possible to find installation sets that are quite small. Considering only the installation set for a given package drastically reduces the number of calls to the SAT solver. On the other hand, since the large majority of strong dependencies can be derived directly from conjunctive dependencies, building the graph of conjunctive dependencies beforehand can further reduce the computation time.
In our experiments, calculating the strong dependency graph and sensitivity index for about packages takes about 5 minutes on a modern commodity Unix workstation.888Intel Xeon 3 GHz processor, 3 Gb of memory
5 Applications
The given notions of strong dependency, impact set, sensitivity, and strong dominance can be used to address issues showing up in the maintenance of large component repositories. In particular, we have identified two areas of application: repository-wide Quality Assurance (QA) and upgrade risk evaluation for user machines.
Quality Assurance
FOSS distribution the size of Debian are not easily inspectable by hand, without specific tools. The work of release managers in such scenario is about maintaining a coherent package repository, i.e., in which each package is installable in at least one healthy installation. Such repositories are usually not built from scratch, but rather evolve from an unstable state to a stable one which is periodically released as the new major release of the distribution. Day to day maintenance of the repository includes actions such as adding packages to the repository (e.g., newly packaged software, or new releases) as well as removing them (e.g., superseded softwares or sub-standard quality packages which are not considered suitable for releasing). Quality assurance is meant to spot repository-wide incompatibilities or sub-standard quality packages, according to various criteria.
In such ecosystems, removing a package can have non-local effects which are not evident by just looking at the direct dependencies of the involved packages. For instance, removing a package such that several packages depends on might be appropriate only if is installable in the archive. The strong dependency graph can be used to detect similar cases efficiently. Once the graph has been computed—and Section 4 showed that the cost is affordable even for large distributions—detecting if a package is removable in isolation reduces to check whether its node has inbound edges or not. If really needed, following inbound edges can help building sets of packages removable as a whole.
In the same context, sensitivity can be used to decide when to freeze packages during the release process (decision currently delegated to folklore): the higher the sensitivity, the sooner a package should be frozen. Sensitivity can also be used to activate heuristic warnings in archive management tools when apparently innocuous packages are acted upon: attempting to remove or otherwise alter gcc-4.3-base at the end of the Lenny release process (see Table 2) would have surely been an error, in spite of the few packages mentioning it directly in their dependencies.
Upgrade risk evaluation
System administrators of machines running FOSS distributions would like to be able to judge the risks of a certain upgrade. Risk evaluation not necessarily in the sense of deciding whether or not to perform an upgrade—not performing one is often not an option, due to the frequent case of upgrades that fix security vulnerability. Upgrade risk evaluation is important to allocate suitable time slots to deploy upgrade plans proposed by package managers: the riskier the upgrade, the longer the time slot that should be planned for it.
The general principle we propose is that a package that is not strongly depended upon by other packages is relatively safe to upgrade; conversely, a package that is needed by many packages on the system might need some safety measures in case of problems (backup servers, …). However this measure should be computed in relation to the actual user installation and not as an absolute value with respect to the distribution such as plain impact sets. Once the strong dependency graph of a user installation has been computed, the legacy package manager can be used to find upgrade plans as usual. On that plan the overall upgrade sensitivity can then be computed by summing up the size of the installation impact sets of all packages touched by the proposed plan; where the installation impact set of a package is defined as the intersection of the strong impact set with the local installation.
The strong dependency graph used for risk evaluation must be the one corresponding to the distribution snapshot which was known before planning the upgrade. This is because we want to evaluate the risks with respect to the current installation, not to a future potential one in which package sensitivity can have changed. The maintenance of such graph on user machines is straightforward and can be postponed to after upgrade runs have been completed, in order to be ready for future upgrades.
Note that in this way, what is computed is an under approximation of the upgrade risk measure. For example consider the following scenario: a package having Depends: q | r, and a healthy installation . The direct dependencies of entail no strong dependency, but in the given installation has been “chosen” to solve dependencies. Even if , an upgrade of in that specific installation has potentially an impact on . The under approximation is nevertheless sound—i.e., all packages in the installation impact set are installed.
Release upgrades
A particular case of upgrade are the so called release upgrades (or distribution upgrades) which are performed periodically to switch from an older stable release of a given distribution to a newer one. The relevance of such upgrades is that they usually affect almost all of the packages present in user installation. Such kind of upgrades are usually already performed wisely by system administrators devoting large enough time slots.
During release upgrades system administrators are often faced with the choice of whether to switch to a new major version of some available software or to stay with an older, legacy one. For instance, one can have the choice to switch to the Apache Web server 2.x series, or to stay with Apache 1.x. The upgrade is not forced by strict package versioning by either offering packages with different names (e.g. apache1 vs apache2 in Debian and its derivatives) or by avoiding explicit conflicts among the two set of versions (as it happens in RPM-based distributions). The choice is currently not technically well assisted: if apache2 is tentatively chosen, the package manager will propose to upgrade all involved packages to the most recent version without highlighting which upgrades are mandatory to fulfil dependencies and which are not.
While this is a deficiency of state of the art solving algorithms [22], strong dependencies offer a cheap technical device to work around the problem with current solvers. It is enough to compute the strong dependency graph of both distributions and, in particular, the strong dependencies of the two (or more) involved packages. Then, by taking the difference of the strong dependencies in the new and in the old graph, the list of package which must be forcibly upgraded to do the switch is obtained. All such forced upgrades can then be presented to the administrator to better guide her or his choice.
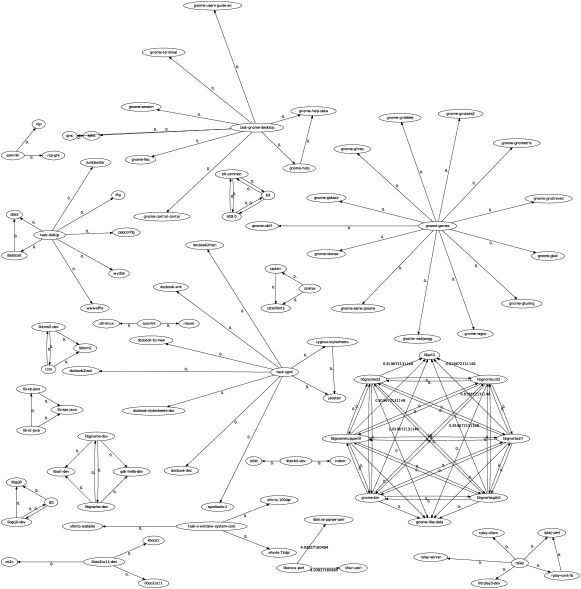
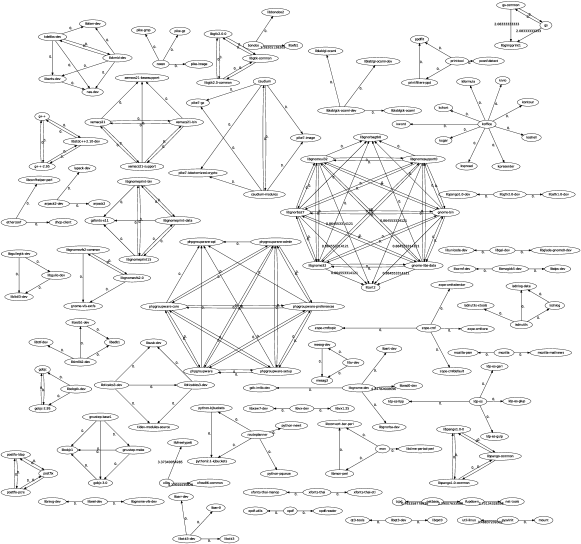
Architecture visualization and monitoring
As the KDE cluster in Figure 9 shows, there are cases where the distributed development of a universe of components can lead to partially overlapping, duplicated components, which mangle the global architecture of the distribution; strong dominator graphs extract significant information from the huge dependency graph, and help identify in a very visual way the areas that need to be analysed in detail; it is natural to try and improve this line of research by coupling the information found via strong dominators to other information available on the software components, like the developer team members, or the upstream source code.
6 Related works
We have identified several interesting articles dealing with issues related to the topics we address. In the area of complex networks, [14, 16] used FOSS distributions as case studies. The former is the closest to our focus, as it studies the network structure obtained from Debian inter-package relationships, showing that it is small-world, as the node connectivity follows a near power-law distribution. However, the analysis is performed on the direct dependency graph, which we have shown misses the real nature of dependencies.
We could not get more information on how the data of [14] has been computed, as the snapshot of Debian used there comes from late 2004, and is no longer available in the Debian archives; based on the figures presented in the paper, and our analysis of the closest Debian stable distribution, we conclude that their analysis dropped all information about Conflicts and Pre-Depends. As a consequence, the figures produced for what is called in the paper “the 20 most highly depended upon packages” falls extremely short of reality: libc6 is crucial for 3 times more packages than what is reported, and other critical packages such as gcc-4.3-base are entirely missed.
In the area of quality assurance for large software projects, many authors correlate component dependencies and past failure rates in order to predict future failures [24, 18, 19]. The underlying hypothesis is that software “fault-proneness” of a component is correlated to changes in components that are tightly related to it. In particular if a component has many dependencies on a component and the latter changes a lot between versions, one might expect that errors propagates through the network reducing the reliability of . A related interesting statistical model to predict failures over time is the “weighted time damp model” that correlates most recent changes to software fault-proneness [9]. Social network methods [10] were also used to validate and predict the list of sensitive components in the Windows platform [24].
Our work differs for two main reasons. First, the source of dependency information is quite different. While dependency analysing for software components is inferred from the source code, the dependency information in software distributions are formally declared and can be assumed to be, on the average, trustworthy as reviewed by the package maintainer. Second, FOSS distributions still lack the needed data to correlate upgrade disasters with dependencies and hence to create statistical models that allow to predict future upgrade disasters. In more detail, the FOSS ecosystem is really fond of public bug tracker systems, but generally lacks explicit logging of upgrade attempts and a way to associate specific bugs to them. One of the goal of the Mancoosi999http://www.mancoosi.org project—in which the authors are involved—is to create a corpus of upgrade problems which will be a first step in this direction.
The key idea behind the notion of sensitivity can be seen as a direct application of the evaluation of “disease spreading speed” in small world networks [23]: the higher the sensitivity, the larger the impact sets, the higher the (potential) bug spreading speed. The semantic definition of impact sets is crucial in this analysis: using the direct dependency graph would give no guarantee about which components will be effectively installed and therefor help bug spreading.
7 Conclusion and future work
This paper has introduced the novel notions of strong dependencies between software components, and of sensitivity as a measure of how many other components rely on its availability; and we have introduced strong dominance as a means of ordering and grouping components with similar sensitivity into meaningful clusters. We have shown concretely on a large scale real world example that such notions are better suited to describe true inter-component relationships than previous studies, which were solely based on the analysis of the syntactic (or direct) dependency graph. The main applications of these new notions are tools for quality assurance in large component ecosystems and upgrade risk evaluation.
The new notions have been tested on one of the largest known component-based system: Debian GNU/Linux, a popular FOSS distribution. Historical analysis of Debian strong and direct dependency graphs have been performed. Empirical evidence shows that, while the two notions are generally correlated, there are several components on which they give huge differences, with direct dependencies entirely missing key components that are rightly identified by strong dependencies. We believe the case shown in this paper is strong enough to totally dismiss, in the future, measures built on direct dependencies as soon as the dependency language is as expressive as the one used for FOSS distributions.
We hence strongly advocate the evaluating of sensitivity on top of strong dependencies, and we have shown clearly how clustering components according to the notion of strong dominance allows to build a meaningful presentation of data, and uncover deep relationships among components in a repository.
Despite the theoretical complexity of the problem, and the sheer size of modern component repositories, we have succeeded in designing a simple optimised algorithm for computing strong dependencies that performs very well on real world instances, making all the measures proposed in this paper not only meaningful, but actually feasible.
Previous studies on network properties—such as small world characteristics—have been redone on the Debian strong dependency graph, showing that it stays small world.
Future works is planned in various directions. First of all the notion of installation impact set needs to be refined. While it is clear that the strong impact set is an under approximation of it, it is not clear how to further refine it. On one hand we want to get closer to the actual set of potentially affected packages on a given machine. On the other it is not clear, for a package depending on to which extent both packages should be considered as potentially impacted by a bug in . It appears to be a limitation in the expressiveness of the dependency language which does not state an order between and , but needs further investigation. Interestingly enough, the implicit syntactic order “ before ” is already taken into account by some distribution tools such as build daemons and is hence worth modelling.
Distributions like Debian use a staged release strategy, in which two repositories are maintained: an “unstable” and a “testing” one. Packages get uploaded to unstable and migrate to testing when they satisfy some quality assurance criteria, including the goal of maintaining testing devoid of uninstallable packages. Current modelling of the problem is scarce and implementations rely on empirical package-by-package migration attempts. We believe that the notion of strong dependency and the clusters entailed by strong dominance can help in identifying clusters of packages which should forcibly migrate together.
8 Acknowledgements
The authors would like to thank Yacine Boufkhad, Ralf Treinen and Jerôme Vouillon for many interesting discussions on these issues.
Bibliography
- [1] R. Albert, H. Jeong, and A. Barabasi. The diameter of the world wide web. Nature, 401:130–131, July 1999.
- [2] R. Albert, H. Jeong, and A. Barabasi. Error and attack tolerance of complex networks. Nature, 406:378, 2000.
- [3] Apache Software Foundation. Maven project. http://maven.apache.org/, 2009.
- [4] E. Clayberg and D. Rubel. Eclipse Plug-ins. Addison-Wesley Professional, 3 edition, Dec. 2008.
- [5] R. Di Cosmo, B. Durak, X. Leroy, F. Mancinelli, and J. Vouillon. Maintaining large software distributions: new challenges from the FOSS era. In FRCSS 2006, 2006. EASST Newsletter.
- [6] R. Di Cosmo, P. Trezentos, and S. Zacchiroli. Package upgrades in FOSS distributions: Details and challenges. In HotSWup’08, 2008.
- [7] S. Dick, A. Meeks, M. Last, H. Bunke, and A. Kandel. Data mining in software metrics databases. Fuzzy Sets and Systems, 145(1):81–110, 2004.
- [8] N. E. Fenton and S. L. Pfleeger. Software Metrics: A Rigorous and Practical Approach, Revised. Course Technology, 2 edition, Feb. 1998.
- [9] T. L. Graves, A. F. Karr, J. S. Marron, and H. Siy. Predicting fault incidence using software change history. IEEE Trans. Softw. Eng., 26(7):653–661, 2000.
- [10] R. A. Hanneman and M. Riddle. Introduction to social network methods. University of California, Riverside, 2005.
- [11] I. Herraiz, G. Robles, R. Capilla, and J. Gonzalez-Barahona. Managing libre software distributions under a product line approach. In COMPSAC’08, pages 1221–1225, 2008.
- [12] I. Jackson and C. Schwarz. Debian policy manual. http://www.debian.org/doc/debian-policy/, 2009.
- [13] T. M. Khoshgoftaar, E. B. Allen, W. D. Jones, and J. P. Hudepohl. Data mining for predictors of software quality. International Journal of Software Engineering and Knowledge Engineering, 9(5):547–564, 1999.
- [14] N. LaBelle and E. Wallingford. Inter-package dependency networks in open-source software. CoRR, cs.SE/0411096, 2004.
- [15] B. Livshits. Dynamine: Finding common error patterns by mining software revision histories. In In ESEC/FSE, pages 296–305. ACM Press, 2005.
- [16] T. Maillart, D. Sornette, S. Spaeth, and G. V. Krogh. Empirical tests of zipf’s law mechanism in open source linux distribution. 0807.0014, June 2008.
- [17] F. Mancinelli, J. Boender, R. Di Cosmo, J. Vouillon, B. Durak, X. Leroy, and R. Treinen. Managing the complexity of large free and open source package-based software distributions. In ASE, pages 199–208, 2006.
- [18] N. Nagappan and T. Ball. Using software dependencies and churn metrics to predict field failures: An empirical case study. In ESEM, pages 364–373, 2007.
- [19] S. Neuhaus, T. Zimmermann, C. Holler, and A. Zeller. Predicting vulnerable software components. In ACM Conference on Computer and Communications Security, pages 529–540, 2007.
- [20] G. Robles, J. M. Gonzalez-Barahona, M. Michlmayr, and J. J. Amor. Mining large software compilations over time: another perspective of software evolution. In MSR ’06, pages 3–9. ACM, 2006.
- [21] C. Szyperski. Component Software: Beyond Object-Oriented Programming. Addison Wesley Professional, 1997.
- [22] R. Treinen and S. Zacchiroli. Solving package dependencies: from EDOS to Mancoosi. In DebConf 8: 9th conference of the Debian project, 2008.
- [23] D. J. Watts and S. H. Strogatz. Collective dynamics of small-world networks. Nature, 393(6684):440–442, June 1998.
- [24] T. Zimmermann and N. Nagappan. Predicting defects using network analysis on dependency graphs. In ICSE’08, pages 531–540. ACM, 2008.
I Case Study: Evaluation of debian structure
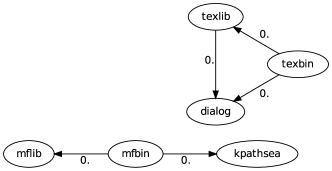
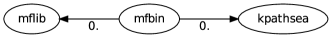
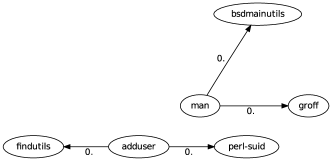
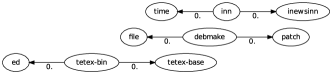
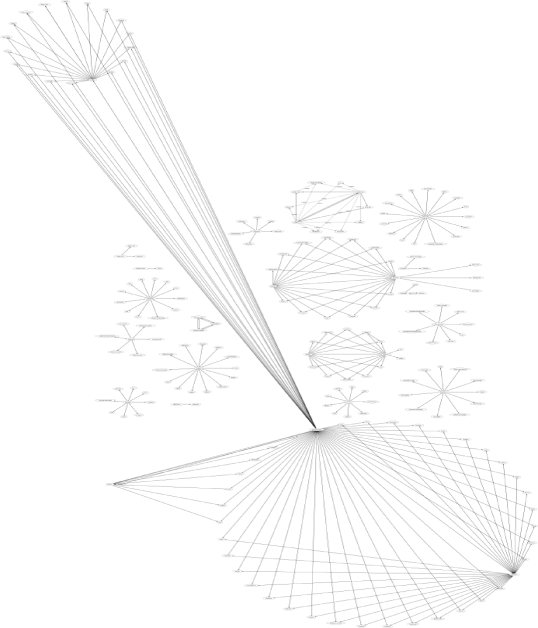
The strong dominance graph can be used to extract and visualize cluster of components with similar sensitivity that are hidden when looking directly at the much bigger direct (or strong) dependency graph. To showcase this application of strong dominance, we present the corresponding graphs for various Debian releases (see Figures 5, 6, 7, 8, and 10). In Figure 9 we highlight the structure of the KDE cluster in Debian 3.1.
Early releases (Figure 5) have small dominance graphs hinting that the Debian distribution was composed, back then, by a small number of loosely coupled package clusters. From Debian 2.2 a growth of the strong dominance graph can be observed.
The following graphs are generate removing all non-trivial (i.e., strictly larger than 2 components) strong dominance clusters and with a fuzzy index of . All images are embedded in the electronic format of this document in vectorial format allowing to “zoom in” the otherwise huge graph. The source files (in sgv and dot format) can be retrieved from the mancoosi website at http://www.mancoosi.org.