Analysis of the spectral energy distribution
of the coolest RCrB type carbon star DY Per
L.A.Yakovina111yakovina@mao.kiev.ua,
A.V.Shavrina222shavrina@mao.kiev.ua,
Ya.V.Pavlenko333yp@mao.kiev.ua,
A.F.Pugach444pugach@mao.kiev.ua
Main astronomical observatory of the National Academy of
sciences of Ukraine,
27 Zabolotnoho, Kyiv-127, 03680 Ukraine
Abstract
We analyse the spectral energy distribution of the evolved carbon giant DY Per with a spectral synthesis technique. The red giant shows the photometric features of R CrB type stars. We derive the atmospheric parameters of DY Per using three variants of molecular line lists. We estimate Teff to be in the range 2900 Teff 3300 K. We adopted log g = 0. The star may be metal deficient and hydrogen deficient. The maximum possible carbon abundance in the star, [C]=0.94, provides the following atmospheric parameters: {Teff =3100 K, [Fe/H] =0, log(C/O) = 0.6, [N/Fe] = 0, [H/He] = 0, with Jorgensen’s line lists for the molecules C2 and CN.
1 Introduction
The red giant DY Per shows photometric properties of R CrB type stars. Apparently, the star is the coolest among known stars of this type. DY Per is not a typical R CrB type star and we cannot classify it as a member of any known subclass of C-stars.
Some authors, by indirect methods (see Keenan & Barnbaum 1997), estimate a range of its effective temperature : 3500 Teff 4740 K. Yakovina et al. (2009) determine 2900 Teff 3000 K by fitting synthetic spectra to the observed spectral energy distribution (SED).
Molecular line lists in Yakovina et al. (2009) were taken from the Kurucz (1993-1994) database. This database is the most complete, but the accuracy of Kurucz’s line lists is not always good enough. In this work we determine the atmospheric parameters of DY Per using the same material in Yakovina et al. (2009) and two other variants of line lists for the molecules C2 and CN.
A moderate resolution spectrum of DY Per was obtained on 29.09.2003 with the spectrograph SPEM at the Nesmith focus of the 2.6-m telescope ZTSh at the Crimean Astrophysical Observatory. In the observed region, 400-730 nm, the spectral resolution was 1.7 A/px, and the maximum S/N was about 280. The spectral reduction procedure is described in Yakovina et al. (2009).
2 Model atmospheres and
synthetic spectra of DY Per
Model atmospheres for different Teff and abundances (Pavlenko & Yakovina 2009) were calculated by the SAM12 program (Pavlenko 2003). A microturbulent velocity of = 3 km/s was adopted. A reference set of the “solar” abundances were taken from Gurtovenko & Kostik (1989).
Synthetic spectra were calculated by the WITA6 program (Pavlenko 1997). Due to the high 12C/13C value in the atmosphere of DY Per (Keenan & Barnbaum 1997), molecules containing 13C were not included in our computations. We used the atomic line list from VALD (Kupka et al. 1999). The list of molecular systems included in our synthetic spectra calculations are shown in Table 1. Dissociation potentials are shown too.
| Molecule | Transition | System | D0 (eV) |
|---|---|---|---|
| 12C12C | d - a | Swan | 6.297 [1] |
| 12C12C | A - X | Phillips | 6.297 [1] |
| 12C14N | B - X | Violet | 7.738 [2] |
| 12C14N | A - X | Red | 7.738 [2] |
| 12CH | A - X | 3.47 [3] | |
| 12CH | B - X | 3.47 [3] | |
| 12CH | C - X | 3.47 [3] | |
| 24MgH | A - X | 1.27 [4] | |
| . |
In Yakovina et al. (2009) the line lists of all molecular systems were taken from CD-ROM N18 of the Kurucz (1993-1994) database. In this work we used two other versions.
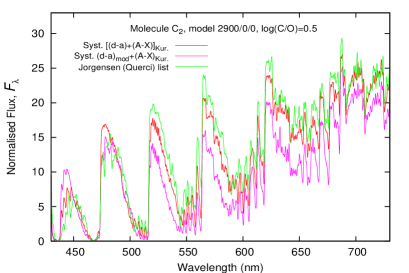
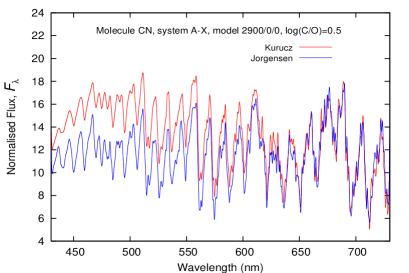
First, we update the line list of the Swan system of the C2 molecule from Kurucz (1993-1994). For other molecular band systems, we used Kurucz’s original line lists. We name Kurucz’s original list and the modified one K18 and K18n, respectively.
Second, line lists of the CN red system and C2 (without dividing into the systems) were taken from Jorgensen’s website (http://stella.nbi.dk). Other lists were taken from Kurucz (1993-1994).
The CN red system line list on Jorgensen’s site is a well known list from tape SCAN-CN (see Jorgensen & Larsson 1990). The C2 lists are from Querci (F.Querci et al. 1971, F.Querci et al. 1974). Jorgensen transformed Querci’s lists to the SCAN-CN format. He updated the oscillator strengths (gf) when the new molecular data became available.
We updated the Kurucz (1993-1994) line list of the Swan band system using the Kuznetsova & Shavrina (1996) data and programs. The new values of gf for the Swan system were calculated using the RADEN databank (Kuznetsova et al. 1993) and the MOLEC program, developed in the Main Astronomical Observatory of NASU.
C2 and CN spectra computed from three versions of the molecular line lists are shown in Fig. 1. All theoretical spectra shown in this paper are convolved with a gaussian of FWHM = 1.2 nm.
3 Results
From the best fitting theoretical SEDs to observed fluxes of DY Per at 430-730 nm we determined the following atmospheric parameters: Teff, [Fe/H], C/O, [N/Fe] and H/He.
To compare the observed and synthetic spectra we used the following procedure.
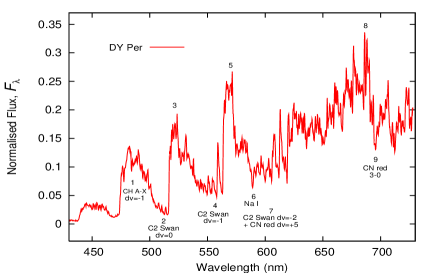
First of all, we analysed the synthetic spectrum fit to selected narrow spectral regions containing maxima or minima in the observed SED. Flux maxima determine the gradient of the SED in the investigated region. We found that the gradient of the SED is the important indicator of Teff. All selected regions are shown in Fig. 2. We determined atmospheric parameters from the following features in these regions:
– Swan bands were the main indicators of carbon abundance,
– bands of CH A-X system with =-1 were the main indicators of the hydrogen abundance,
– resonance Na I doublet was the main indicator of atomic spectrum intensity,
– the band 3-0 of CN red system was the main indicator of nitrogen abundance.
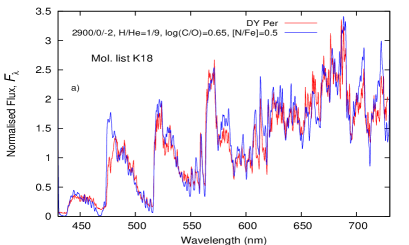
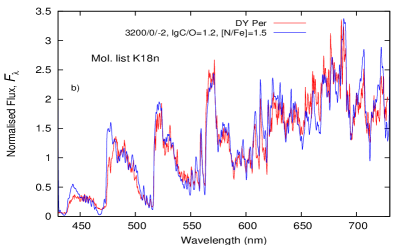
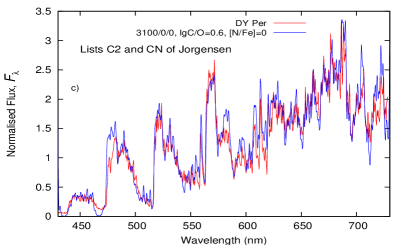
In Fig.3 we show some fits of synthetic spectra, computed with different line lists, to the DY Per SED. These fits are rather similar.
In Table 2 we show some new results combined with Yakovina et al. (2009) data.
| Teff | [Fe/H] | log C/O | [N/Fe] | H/He | [C] | Line list |
|---|---|---|---|---|---|---|
| 2900 | -0.5 | 0.3 | 0.0 | Sun | +0.14 | K18 |
| 2900 | -1.0 | 0.5 | 0.2 | 7/3 | -0.16 | K18 |
| 2900 | -1.5 | 0.6 | 0.4 | 3/7 | -0.56 | K18 |
| 2900 | -2.0 | 0.6 | 0.5 | 1/9 | -1.01 | K18 |
| 3000 | -0.5 | 0.4 | 0.0 | Sun | +0.24 | K18 |
| 3000 | -1.0 | 0.5 | 0.3 | Sun | -0.16 | K18 |
| 3000 | -1.0 | 0.5 | 0.2 | 8/2 | -0.16 | K18 |
| 3000 | -1.5 | 0.8 | 0.5 | 5/5 | -0.36 | K18 |
| 3000 | -2.0 | 1.0 | 0.8 | 3/7 | -0.66 | K18 |
| 3000 | 0.0 | 0.4 | 0.0 | Sun | +0.74 | Jorgensen |
| 3100 | 0.0 | 0.6 | 0.0 | Sun | +0.94 | Jorgensen |
| 3100 | -0.5 | 0.4 | 0.0 | 4/6 | +0.24 | Jorgensen |
| 3200 | -2.0 | 1.2 | 1.5 | Sun | -0.46 | K18n |
| 3200 | -2.5 | 1.4 | 1.8 | 5/5 | -0.76 | K18n |
| 3300 | -2.0 | 1.6 | 1.4 | Sun | -0.06 | K18n |
| 3300 | -2.5 | 1.6 | 1.6 | 7/3 | -0.56 | K18n |
Table 2 shows some ambiguities in our DY Per parameters. Values of effective temperature of DY Per are 2900 Teff 3000 K if we use K18 line list (Kurucz 1993-1994), 3000 Teff 3100 K if use Jorgensen data (http://stella.nbi.dk) and 3200 Teff 3300 K if we use the K18n list.
In general, the uncertainty in other atmospheric parameters - [Fe/H] , log(C/O), [N/Fe] and H/He - is considerably higher. We fixed the upper limits on the metallicity for every Teff and molecular line list:
[Fe/H]max= -0.5 for the K18 line list,
[Fe/H]max= -2.0 for the K18n list,
[Fe/H]max= 0.0 for Jorgensen’s data.
For all [Fe/H]max, estimations of H/He are solar. Hydrogen deficiency appears, if [Fe/H]decreases, C/O and [C/Fe] increases but the carbon abundance decreases relative to the solar value [C].
We cannot choose definitely the best variant of the synthetic spectrum from our spectral synthesis technique only. Qualitative analysis of observations of DY Per (Keenan & Barnbaum 1997, Zacs et al. 2007) shows that DY Per is of normal metallicity or a slightly metal deficient star and, possibly, hydrogen deficient. On the other hand, the carbon abundance in the atmosphere of DY Per is quite high. We see from Table 2 that only Jorgensen’s molecular line lists support [C] values close to those observed in the atmospheres of R CrB type stars ([C]=1-2). The highest carbon abundance, [C]=0.94, is obtained for the model atmosphere with {Teff =3100 K, [Fe/H] =0, log(C/O)=0.6, [N/Fe]=0, (H/He)⊙}. We note that the values of the parameters are not in contradiction with rough estimations by other authors. Our fit of the theoretical fluxes to the observed SED of DY Per is shown on Fig. 3c.
4 Discussion and conclusions
This work and Yakovina et al. (2009) make the following conclusions:
-
•
The effective temperature of DY Per is in range 2900 Teff 3300 K. Our estimations of Teff are below estimations by indirect methods. We confirm that DY Per is the coolest R CrB type star.
-
•
For every value of Teff , the spectral synthesis technique gives large ambiguities in the [Fe/H] , log(C/O), [N/Fe], H/He atmospheric parameters. However, the qualitative analysis provided by some authors and physical constraints suggest that the most likely combination of atmospheric parameters of DY Per is {Teff =3100 K, [Fe/H] =0, log(C/O)=0.6, [N/Fe]=0, (H/He)⊙} with Jorgensen’s line lists for molecules C2 and CN.
-
•
We believe that new observations of DY Per in a wider spectral region, and at high spectral resolution and with independent methods of analysis will allow us to increase confidence in the determination of the atmospheric parameters of DY Per.
Acknowledgement. This work was supported by an International Joint Project Grant from the UK Royal Society and the “Microcosmophysics” program of the National Academy of Sciences and Space Agency of Ukraine. We thank Dr. Mark Rushton for editing the text.
References
- [1] Bernath P.F., Black J.H., Brault J.W.: 1985, ApJ, 298, 375.
- [2] Gurtovenko E.A., Kostik R.I.: The system of solar oscillator strengths, preprint MAO-98-3E, Main astronomical observatory NAS Ukraine, Kyiv - 1998, 63 p.
- [3] Huang Y., Barts S.A., Halpern J.B.: 1992, J. Phys. Chem., 96, 425.
- [4] Jorgensen U.G., Larsson M.: 1990, A&A, 238, 424.
- [5] Keenan P.C., Barnbaum C.: 1997, PASP, 109, 969.
- [6] Kupka F., Piskunov N., Ryabchikova T.A. et al.: 1999, A&AS, 138, 119.
- [7] Kurucz R.L.: 1993-1994, Data Bank - CD-ROM NN 1-22.
- [8] Kuznetsova L.A., Shavrina A.V.: 1996, Kinem. & Physics of Celest. Bodies, 12, N 6, 75.
- [9] Kuznetsova L.A., Pazyuk E.A., Stolyarov A.V. in: Molecular opacities in the stellar environment: Poster Session Proc. IAU Coll. N 146, Copenhagen, Denmark, eds P.Thejll, U.G.Jorgensen, Copenhagen: Niels Bohr Inst., s.a., 1993. p.63.
- [10] Pavlenko Ya.V.: 1997, Ap&SS, 253, 43.
- [11] Pavlenko Ya.V.: 2003, Astron. Rept., 47, 59.
- [12] Pavlenko Ya.V., Yakovina L.A.: 2009, Kinem. & Physics of Celest. Bodies, accepted.
- [13] Querci F., Querci M., Kunde V.G.: 1971, A&A, 15, 256.
- [14] Querci F., Querci M., Tsuji T.: 1974, A&A, 31, 265.
- [15] Tsuji T.: 1973, A&A, 23, 411.
- [16] Urdahl R.S., Bao Y., Jackson W.M.: 1991, Chem. Phys. Lett., 178, 425.
- [17] Yakovina L.A., Pugach A.F., Pavlenko Ya.V.: 2009, Astron. Rept., in press.
- [18] Zacs L., Chen W.P., Mondal S. et al.: 2007, A&A, 472, 247.
- [19]