The crucial role of CLEO-c in the measurement of
Abstract
The most sensitive method to measure the CKM angle is to exploit interference in decays, with the -meson decaying to a hadronic final state. The analysis of quantum-correlated decays of the at CLEO-c provides invaluable information on the strong-phase difference between the and across the Dalitz plane. Results from analyses of the decays and will be presented.
1 Introduction
The angle is currently the least precisely known of the CKM angles of the unitarity triangle. The average value of obtained from direct measurements is [1]. A theoretically clean strategy to extract is to exploit the interference between and decays in which the and decay to the same final state [2]. This method requires precise knowledge of how the strong-phase difference between the and varies across the Dalitz plane. Quantum-correlated data from CLEO-c provide a unique opportunity to measure this variation. This paper describes the procedure used when is either or , collectively denoted . The strong phase distribution for 111Henceforth, indicates either or is in general different to that for , but the formalism is the same.
2 Determination of with
The expression for the decay amplitude of is:
| (1) |
where is the ratio of the magnitudes of the amplitudes of suppressed and favoured decays [1], is the CP-invariant strong-phase difference between interfering decays, and are the squared invariant masses and respectively and is the -decay amplitude. Neglecting CP violation, the square of contains the strong-phase difference term . In order to extract from the difference in decay rates across the Dalitz plane, must be determined.
Previous studies have modelled the decay using several intermediate two-body resonances [3, 4]. This introduces a model systematic uncertainty of to the value of which is likely to be the main limitation at future b-physics experiments.
An alternative approach, which is the subject of the remainder of this paper, is to use external information on the strong-phase difference in a binned fit to the distribution of events across the Dalitz plane [2]. A good choice of binning is to divide the Dalitz plane into regions of similar [5] based on a model of the -decay. An incorrect model will not bias the measurement of , but will reduce the statistical precision. An example of a particular binning, for , is given in Figure 1. This uses a model from Ref. [6].
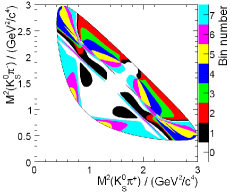
The Dalitz plot is binned symmetrically about ; bins below this axis are numbered and those above . The number of events in the bin of the Dalitz plot in the decay is dependent upon and which are the average cosine and sine of the strong-phase difference across the bin [2].
3 Determination of with quantum-correlated decays of the
The -mesons are quantum-correlated with an overall CP of -1, so knowledge of the CP state of one of the pair reveals the CP state of the other. When one decays to , the decay product of the other is denoted the opposite-side tag.
Define as the number of events in the bin of the flavour-tagged Dalitz plot. and can then be expressed as:
| (2) |
and
| (3) |
where is a normalization factor. Analogous quantities, denoted , and , exist for . To first order, and , but there are second-order differences due to doubly Cabibbo suppressed contributions to the decay amplitude.
can be determined from CP-tagged decays to . The number of events in the bin of a Dalitz plot, where the opposite-side tag is a CP eigenstate, is given by:
| (4) |
where is a normalization factor, for and for .
In order to determine , decays in which both -mesons decay to are required. The number of events in the Dalitz plot bin of and the of is:
| (5) |
where is a normalization factor.
The parameters , , and are extracted by minimizing a maximum likelihood function based on the expected and observed values of and . The quantities and , predicted by the model, are used as a constraint in the fit. The consequences of variations in the predicted values are evaluated when assigning systematic errors.
4 Event Selection at CLEO-c
An integrated luminosity of of data were recorded at CLEO-c. The tags selected for and are shown in Tables 1 and 2 respectively. In order to maximize statistics, a large number of tags were selected. Approximately 23,000 events were selected for and approximately 1,900 for . The bins mentioned earlier were appropriately populated using selected event yields.
, , and particles were selected using kinematic and reconstruction quality criteria [7]. Suitable invariant mass cuts were used to select composite particles; for example, for the decay, the invariant mass of the system was constrained to lie within 20 MeV of the nominal mass.
For tags containing a , a different approach was used, because of particles escape the CLEO-c detector. All other particles in the tag were reconstructed and the square of the missing mass, , was computed. Events could then be accepted or rejected depending on where they lay on the plane.
All raw yields were efficiency-corrected and background-subtracted. Flat backgrounds were estimated using sidebands and peaking backgrounds were estimated from Monte Carlo. The CLEO-c environment is clean; most backgrounds were low, between 1 and 10%.
| \brTag Group | Opposite-Side Tags |
| \mr vs CP+ | , , , , , , , |
| vs CP- | , , , , , |
| vs | , , , |
| vs Flavour | , |
| vs CP+ | , , |
| vs CP- | , , , , |
| vs | |
| vs Flavour | , |
| \br |
| \brTag Group | Opposite-Side Tags |
| \mr vs CP+ | , , , |
| vs CP- | , , |
| vs | , |
| vs Flavour | , , , |
| vs CP+ | , |
| vs CP- | , |
| vs Flavour | , , |
| \br |
5 Results for
Fit and predicted values of and for are shown in Figure 2. Systematic errors, including those taking into account variations in the model, are relatively small.
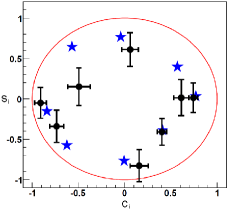
In order to understand the impact these results have on the measurement, a toy Monte Carlo study of was performed, with enough data so the statistical uncertainty associated with B decays was minimal. , and were fit, with initial values respectively of 0.1, and . The uncertainty on which propagates through from the uncertainty on and was found to be [7]. This is a large improvement on the current model-dependent determinations.
6 Preliminary Results for
Studies of are ongoing. Combined CP-tagged Dalitz plots are shown in Figure 3 and exhibit striking differences; this is a consequence of the entanglement of the system. against CP+ tags is in a CP- state, hence decays predominantly via . Similarly, against CP- tags mostly decays via . The resonance is narrow so most points lie close to . This effect is not seen for the other CP-tagged data because the resonance is not present.
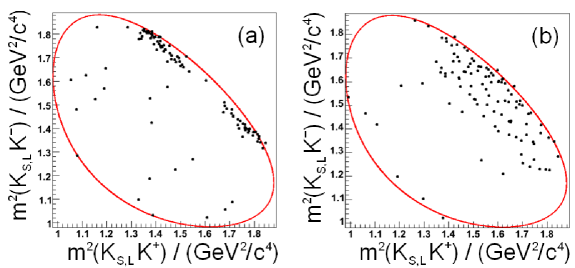
(a): vs CP+ and vs CP-.
(b): vs CP- and vs CP+. Dots indicate data points. The physical Dalitz plot boundary is delimited by a solid line.
References
References
- [1] Charles J et al. (CKMfitter Group) 2005 Eur. Phys. J. C 41 1
- [2] Giri A, Grossman Y, Soffer A and Zupan J 2003 Phys. Rev. D 68 054018
- [3] Aubert B et al. (BaBar Collaboration) 2008 Phys. Rev. D 78 034023
- [4] Abe K et al. (Belle Collaboration) 2008 (Preprint hep-ex/0803.3375)
- [5] Bondar A et al. 2006 Eur. Phys. J. C 47 347
- [6] Aubert B et al. (BaBar Collaboration) 2005 Phys. Rev. Lett. D 95 121802
- [7] Briere R A et al. (CLEO Collaboration) 2008 (Preprint hep-ex/0903.1681)