Role of triaxiality in the ground state shape of neutron rich Yb, Hf, W, Os, and Pt isotopes
Abstract
The evolution of the ground-state shape along the triaxial landscape of several isotopes of Yb, Hf, W, Os, and Pt is analyzed using the self-consistent Hartree-Fock-Bogoliubov approximation. Two well reputed interactions (Gogny D1S and Skyrme SLy4) have been used in the study in order to asses to which extent the results are independent of the details of the effective interaction. A large number of even-even nuclei, with neutron numbers from up to has been considered, covering in this way a vast extension of the nuclear landscape where signatures of oblate-prolate shape transitions have already manifested both theoretically and experimentally.
pacs:
21.60.Jz, 27.70.+q, 27.80.+w1 Introduction
One of the most often encountered characteristics of the atomic nucleus is the existence of an intrinsic deformed ground state. Deformation is a direct consequence of the spontaneous rotational symmetry breaking mechanism of the mean field approximation and owes its popularity to its ability to incorporate correlations into the mean field wave function [1]. Both, experimental results and theoretical calculations lead to the conclusion that most of the deformed nuclei show a quadrupole deformation of the prolate kind (cigar-like shape) that preserves to a great extent axial symmetry (i.e., there exists a symmetry axis in the matter distribution). Therefore, those regions of the nuclide chart showing oblate deformation or deformed mass distributions breaking axial symmetry (referred to as triaxial distributions) are of great interest to deepen into the understanding of the shell structure underlying the appearance of deformation. In this respect, a region of interest is the one with mass number A around 190 where a prolate to oblate shape transition as a function of neutron number has been predicted [2, 3, 4] as well as some examples of triaxial ground states. This has fostered both theoretical [5, 6, 7, 8, 9, 10, 11, 12, 13] and experimental [14, 15, 16, 17, 18, 19, 20] studies in the region. Conclusive experimental results are scarce as it is not easy to find an observable sensitive to the sign of deformation and/or triaxiality that is, at the same time, easy to measure. As a consequence,,Morales.08 theoretical predictions are important in spite of their uncertainties with related to in-medium effective interactions and/or theoretical methods used to solve the problem.
In the A=190 mass region there has been a variety of theoretical calculations in the past mainly using the mean field approach and a variety of interactions. Our interest in this paper is to investigate the role of the triaxial degree of freedom in this region emphasizing those features which are independent of the mean field effective interaction used. To this end, we use the Hartree-Fock-Bogoliubov (HFB) method [21] together with some of the best effective interactions/functionals present in the market, namely Gogny D1S [22, 23] Gogny D1N [24] and Skyrme SLy4 [25] to carry out constrained calculations in the collective and deformation variables in order to obtain the so-called planes (potential energy surfaces as a function of the and parameters) for the chemical species 70Yb, 72Hf, 74W, 76Os and 78Pt and neutron numbers from N=110 until 122 in steps of two units. In this work we study both the ground state shape evolution as the number of neutrons increases and the role of triaxiality in these isotopes. The transition from axially symmetric prolate shapes to axially symmetric oblate shapes passing through -soft triaxial nuclei could illustrate good examples of the transition from the SU(3) dynamic symmetry of the interacting boson model (IBM) [26] to the symmetry passing across the O(6) dynamic symmetry describing -soft systems. In Section 2 the relevant technical details of the calculation, definitions of the quantities used and a description of the interactions/functionals used is given. In Section 3 we present results for the 190W and the three interactions/functionals used. Once the equivalence of the results is stated, the deformation systematics is analyzed by using results with D1S and SLy4. In order to get some insight on the relevant configurations we have also discussed in this region the single particle energies (SPE) both along the axial and the triaxial degrees of freedom in the paradigmatic 190W case. By using this single particle plots we get an overall understanding of the evolution of deformation in this region. We end up this section by comparing the selfconsistent moments of inertia obtained with the experimental results. Finally, in Section 4 the conclusions are presented.
2 Solution of the mean field equation and interactions used
2.1 Mean field equation and its solution
To obtain the mean field wave functions we treat pairing correlations in the framework of the HFB approximation [21]. Taking into account that our aim is to study triaxiality, breaking of axial symmetry is allowed in the numerical procedure to solve the HFB equation. On the other hand, the discrete symmetries parity, time reversal, and simplex are preserved in the calculation. Keeping parity as a good quantum number is not a severe constraint as octupole deformation effects are not expected to be relevant in the region under study. Preserving time-reversal restricts the treatment to even-even nuclei and zero spin (i.e., the ground state). Finally, simplex is a standard symmetry preserved in almost all the HFB calculations performed up to now [27] as it is supposed to play essentially no role in the dynamics of the ground state of atomic nuclei. Besides the usual constraint on the average number of protons and neutrons, which is characteristic of the HFB approximation, we have constrained the mean value of the quadrupole operators and , as a way to obtain the standard plane of any triaxial study. Instead of the plane we will plot the plane where the deformation parameter is replaced by
The angle is defined as usual as . With this definition an axially symmetric prolate mass distribution has a value whereas the corresponding oblate has .
The single particle energies whose evolution as a function of both and degrees of freedom is shown and discussed in length in the next section are obtained as the eigenvalues of the Hartree-Fock Routhian , where is the kinetic energy operator, is the Hartree-Fock field and represents the standard Lagrange multiplier term used to enforce the constraint on the mean values of the and operators. As the HF Routhian preserves parity the single particle energies are labeled with the parity quantum number. Obviously, for axially symmetric shapes the last Lagrange multiplier term is missing and also the quantum numbers labeling the SPE include, in addition to parity, the third component of the intrinsic angular momentum operator along the direction. Also, due to the Coulomb energy and the different number of protons and neutrons, the SPE for each kind of nucleon are different and will be shown separately. Due to time reversal (in the axial case) and simplex (in the triaxial case) invariance imposed in the calculations, the single particle energies are doubly degenerate. It is also worth pointing out that the SPE have no direct physical meaning in the framework of the HFB method but they closely resemble what would be obtained by performing a pure HF calculation and therefore are useful quantities when the physics is explained in terms of arguments concerning level densities. To create continuous lines the non-crossing rule that inhibits the crossing of levels with the same quantum numbers ( and parity in the case of the plots corresponding to axially symmetric configurations, and parity alone in the triaxial case) has been used.
As it will be discussed in depth later, we have performed calculations with two kinds of interactions, namely the Gogny force [22] (D1S [23] and D1N [24]) and the Skyrme functional (SLy4) [25] in the particle-hole channel plus a zero range and density dependent interaction [28] in the particle-particle channel. Depending on the interaction different approaches to solve the HFB equation have been used. In the case of the Gogny force, the quasiparticle operators have been expanded in a Harmonic Oscillator (HO) basis big enough (thirteen shells) as to guarantee the convergence of the observable quantities.
The solution of the HFB equation in the case of the Gogny force has been obtained by expressing the problem as a minimization process on the mean field energy. With this in mind, the Thouless parametrization [21] of the most general HFB wave function has been used to express the HFB energy as a function of the Thouless parameters. The ones corresponding to the solution of the HFB problem are obtained by minimizing the energy using standard gradient methods [29]. The advantage of this method of solution is that the implementation of many constraints (as it is needed in the present calculations) is straightforward and very easy to implement in a computer code as it only involves imposing orthogonality of certain vectors. As it is customary in calculations with the Gogny force [22], the two body center of mass kinetic energy correction has been fully taken into account in the minimization process. Concerning the Coulomb interaction, its contribution to the direct mean field potential is fully taken into account. On the other hand, the Coulomb exchange energy is treated in the Slater approximation and the contribution of the Coulomb interaction to the pairing field is completely neglected.
In the case of the Skyrme HF+BCS calculations our main tool has been the code EV8 [30] and we have taken full advantage of its three-dimensional Cartesian lattice discretization [1, 30] to search for general triaxial solutions. The method used in this code to solve the HF+BCS equations is the successive iterations one that relies on an iterative diagonalization of the HF+BCS hamiltonian. For details the reader is referred to Refs. [1, 30] and for a recent application of this scheme to study both axial and triaxial ground state shapes is referred to Ref. [10].
2.2 Interactions and functionals
In the case of the Gogny force [22], two different parametrizations have been used, namely the D1S [23] and D1N [24] parameter sets. The former was adjusted more than 30 years ago in order to reproduce several nuclear matter properties of interest as well as some characteristics of selected spherical nuclei. Finally, a reasonable surface energy was chosen in order to reproduce the fission barrier heights of the actinides. On the other hand, the D1N parameter set has been recently proposed with the twofold aim of having a better reproduction of the equation of state of neutron matter (as a way to obtain reasonable characteristics in neutron rich nuclei) and reducing the linear trend observed in the plots of binding energy differences (theory minus experiment) as a function of neutron or proton numbers. In both cases, the central part of the interaction is finite range, what allows to use it also to obtain the particle-particle pairing interaction in a consistent fashion. The predictive power of D1S and its ability to reproduce low energy experimental data all over the nuclide chart are well established (see Refs. [10, 31, 32, 33, 34, 35, 36] for some relevant references related to the present discussion). For D1N still many calculations have to be performed to asses its abilities but it is quite likely that it will also prove to be a reliable interaction all over the nuclide chart.
Concerning the Skyrme functional (SLy4) it was also fitted [25] to reproduce neutron matter properties appropriately and it has proved to give reasonable results for many observables all over the nuclide chart. For the pairing channel we have used a zero-range density-dependent pairing interaction (DDPI) [28],
| (1) |
where is the spin exchange operator, is the nuclear density, and the parameter fm-3. The pairing’s interaction strength is taken as MeV fm3 for both neutrons and protons and a smooth cut-off of 5 MeV around the Fermi level has been introduced [28, 38]. The motivations for this choice are the very reasonable results obtained with this combination in systematic studies of correlation energies from 16O to the superheavies [39] and the nice reproduction of experimental data in global studies of spectroscopic properties of the first states in even-even nuclei [40]. Thus, the predictive power of this combination of effective interactions, has been well established along the nuclear chart.
3 Results
3.1 The nucleus 190W
The nucleus 190W corresponds to N=116 and it is therefore in the middle of the region of nuclei studied in this paper. This makes it a good candidate for a detailed explanation of the kind of results obtained for other nuclei. We have performed calculations for two different parametrizations of the Gogny force (the old D1S and the newly postulated D1N) and the Skyrme SLy4 one with the DDPI pairing force with strength MeV fm3 for both protons and neutrons.

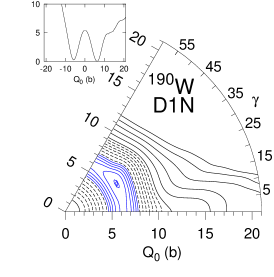
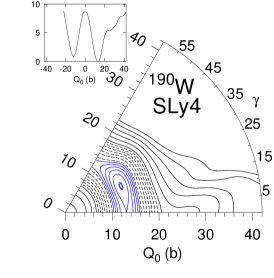
The main results of these calculations are shown in Fig. 1. There, the potential energy surfaces (PES) in the form of planes are depicted for the three interactions/functionals considered. In the three cases, the minimum corresponds to a triaxial configuration with but with a very small depth with respect to the axially symmetric saddle points (i.e., the prolate and oblate minima obtained when is not considered, and that become saddle points in the extended parameter space including the degree of freedom as a consequence of the emergence of the triaxial minimum). The depth is of around 300 keV for the D1S force calculation, it is reduced to around 100 keV for D1N and goes up again up to around 250 keV in the case of the Skyrme SLy4 functional. As a consequence, the axially symmetric prolate and oblate saddle points/minima are almost degenerate with the triaxial minimum in the three cases as can be observed in the small insets depicting the potential energy curves (PEC) along axially symmetric shapes. Only the SLy4 functional calculation shows a somehow higher oblate minimum lying at around 1 MeV above the prolate one. It is also worth mentioning that the spherical configuration in the SLy4 calculation lies at a higher energy as compared to the prolate minimum than in the case of the Gogny force calculations. This effect has already been observed in other systematic calculations in the same region [10] and could be due to different pairing properties of the two forces/functionals.
We conclude that the Gogny force results using D1S and D1N are very similar and therefore in the next sections only results with D1S will be presented. On the other hand, the slight differences observed between the Skyrme functional and Gogny force results as well as the intrinsic differences between the two (zero versus finite range, mainly) warrant the comparison of both results in the subsequent discussions.
3.2 Deformation systematics

In this section we present the systematics of all the nuclei considered and the results obtained with the two interactions/functionals used. First, we show in Fig 2 the potential energy curves (PEC’s) obtained with the Gogny D1S force by constraining on the axially symmetric quadrupole moment both in the prolate () and oblate () side. The prolate side is equivalent to the triaxial results obtained with and whereas the oblate side is equivalent to and . The value of b roughly corresponds to a deformation parameter. We observe how in all the cases there are always a prolate and an oblate minimum even for the N=122 chain where the prolate minimum is just a mere pocket in the PEC. A naive interpretation of the presence of the two minima will lead to the conclusion that two rotational bands, one prolate the other oblate, would be present in the rotational spectra of the nuclei considered (exception made of some nearly spherical nuclei in the right lower corner of the figure). As we will discuss below, the effect of triaxiality leads to substantial modifications on the character of many of the observed minima converting them into saddle points (see below). The two minima lie quite close in energy in many cases (shape coexistence) an are separated by a spherical barrier whose height decreases with increasing Z and N. The fact that the coexisting minima lie at more or less the same (in absolute value) parameter, suggests the possibility of a triaxial path connecting them as it is indeed the case (see below). A prolate to oblate transition is observed at N=116. This is a very interesting fact, but we defer the discussion of this effect until the planes have been presented. Also superdeformed structures can be seen at the highest deformations considered, they are specially relevant (low excitation energies as compared to the ground state) the higher the Z value and the lower the N value of the nucleus are (188Pt). These SD structures will not be discussed in the present paper. Similar results to these ones but for the SLy4 functional have been discussed in detail in Ref. [10].
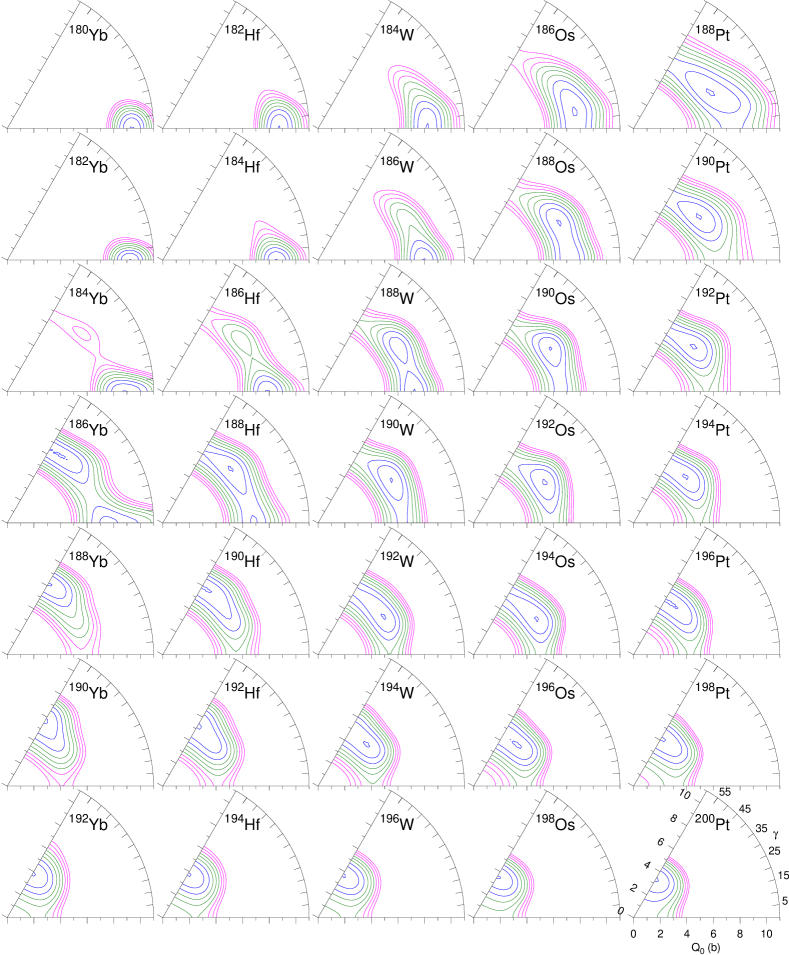
In Fig. 3 the results of the triaxial calculation and obtained with the Gogny D1S force are presented. In order to simplify the presentation, in the planes presented the range of is reduced to half the one computed and the number of contour lines considered has also been severely reduced by considering contours every 250 keV and up to an energy 2 MeV higher than the one of the minimum (which is marked with a small circle). By looking at this picture several general conclusions can be extracted. The first one is that increasing Z, for fixed N, drives the corresponding nuclei towards triaxiality in such a way that the Pt isotopes (the ones with the highest Z) are almost all of them triaxial (the exception are 198-200Pt). Second, by increasing N for fixed Z, we observe that there is a transition from prolate to oblate shapes. For N=116 and Z=70 (186Yb) there is a sharp transition from a prolate ground state (N 116) to an oblate one (N 116). For the neighboring nuclei with Z=72 the same prolate-oblate shape transition is present but it takes place in a much broader range of neutron number values involving N=114, 116 and 118 where the ground state is triaxial. For Z=74 the range of triaxiality extends a little further away up to N=120. For the higher values of Z (76 and 78 corresponding to Os and Pt) and N=110 the ground state is already triaxial and it keeps so up to N=122 for Z=76 and N=120 for Z=78 where it becomes oblate. These conclusions are consistent with other theoretical findings using different interactions [3, 5, 6, 7, 14, 16]. Concerning the triaxial minimum we can say that it is in all the cases very shallow and never reaching a depth of more than 0.5 MeV below the saddle points (see below).

In Fig. 4 we show the HFB energy as a function of the deformation parameter for constant values (given in each panel) corresponding to the lowest axial minima. This figure is complementary to Figs. 2 and 3 and is presented here with the aim of providing a more quantitative understanding of the PES presented. The most striking conclusion from this figure is that of the two axial minima only one remains in most of the cases, the other becoming a saddle point. This is manifest in the N=120 and 122 chains where the only remaining minimum is the oblate one (). For N=118 we have a similar situation but in this case there are two nuclei with only one very shallow triaxial minimum (192W and and 194Os). In the N=116 chain we have three shallow triaxial minima for the Hf, W and Os isotopes and a nucleus, 186Yb, showing a prolate and oblate minima but separated by a quite low barrier. For N=114, we have three nuclei (Yb, Hf, and W) with prolate and very shallow triaxial minima and the other two with only one triaxial minimum. For N=112 and 110 the Yb, Hf and W nuclei only show a prolate minimum whereas the Os and Pt show very shallow triaxial minima (and a extremely shallow prolate one in 188Os). From the above discussion we can conclude that in most of the cases only one minimum remains, reducing thereby by half the number of rotational states to be expected. We can also conclude that due to the shallowness of many minima a dynamical treatment considering both and degrees of freedom will be quite relevant for a more quantitative understanding of the isotopes discussed.
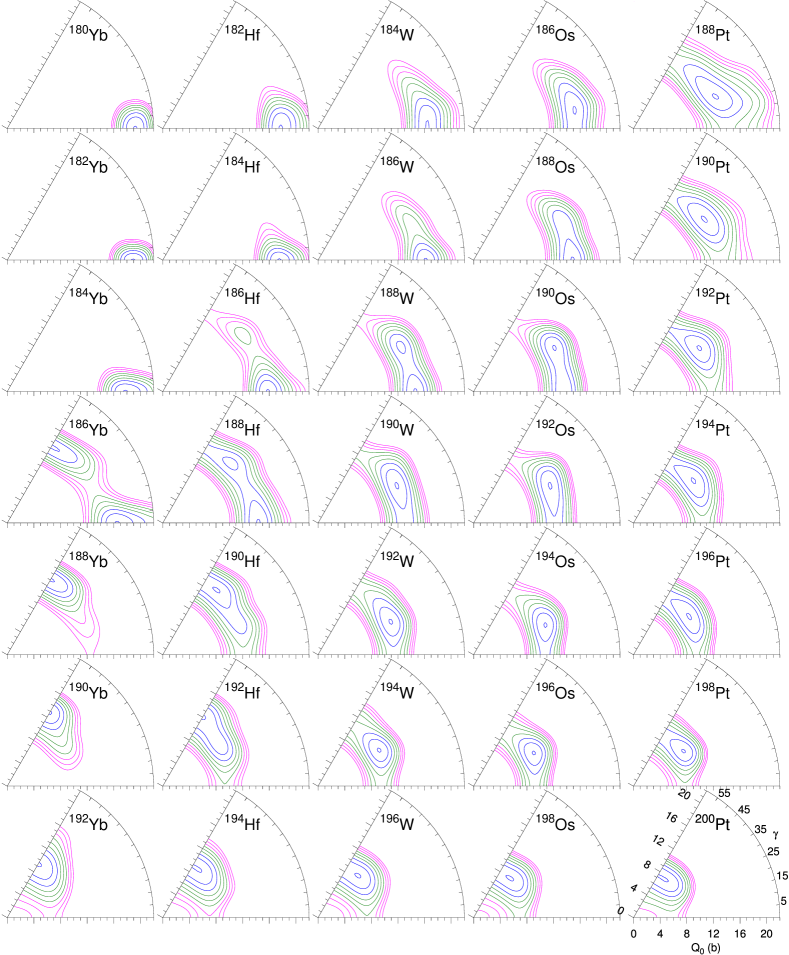
In Fig. 5 we present the planes computed with the Skyrme SLy4 functional and for the same nuclei as before. The first and most relevant fact is that, apart from some details, both pictures (this and Fig. 3) look rather similar. The prolate-oblate and prolate-triaxial-oblate transitions show up more or less in the same places in both cases and the contour plot patterns look rather similar. In principle this fact should not be surprising as the big picture of deformation emerges from the interplay between two bulk properties, namely the surface energy and the Coulomb repulsion. As both the D1S force and SLy4 functional are adjusted as to carefully reproduce bulk nuclear matter properties one could expect a nice agreement between the deformation related predictions. However, the fine details of deformation are strongly dependent upon shell effects and pairing properties of the interactions and those are definitely not the same in D1S and in SLy4. As a consequence of those details we notice that the triaxial minima are typically around 0.8 MeV deeper with SLy4 than with D1S for nuclei with neutron number greater than 116. Because of this, we find rather deep triaxial minima (around 1.25 MeV and more) in nuclei like 192W and 194Os. We also notice that the N=122 nuclei that were all of them oblate for D1S are now triaxial with SLy4, exception made of 192Yb, but the depth of the minima never exceed 0.25 MeV so that a pure triaxial character can not be unambiguously attributed to those nuclei.
From the above discussions we can conclude that the prolate to oblate transition taking place at N=116 as well as the tendency towards triaxial shapes as proton number Z is increased for fixed N are genuine predictions as they are present for the two force/functional considered. On the other hand, and concerning the degree of triaxiality of the properties of the nuclei showing triaxial minimum the present results are more uncertain as the depth of the triaxial minima are not deep enough as to make any quantitative assertion without consider the dynamics of the relevant degrees of freedom. It is clear that, for a more quantitative description, the fluctuations in the and degree of freedom have to be incorporated as it has been recently been done [43] in other regions of the periodic table in the framework of the five dimensional Bohr hamiltonian. Work along this direction is in progress and will be reported elsewhere.
To finish this section we have included in Table 1 the numerical values of the and deformation parameters for the ground state solution obtained with the D1S in a consistent fashion from the same Gogny force. We observe that the ground state value decreases as the number of neutrons increase and at the same time the parameter increases. The behavior of is not surprising because as N increases it comes closer to the magic number N=126. The behavior with increasing proton number is similar, and decreases when Z tends towards the magic value Z=82. On the other hand, no specific behavior emerges for the values of the parameter although in general they tend to move from axially deformed to soft.
| N | 70Yb | 72Hf | 74W | 76Os | 78Pt |
|---|---|---|---|---|---|
| 110 | (0.28,1.0) | (0.26,0.0) | (0.24,0.0) | (0.23,10.0) | (0.18,23.8) |
| 112 | (0.28,0.0) | (0.25,0.0) | (0.23,0.0) | (0.20,24.3) | (0.17,32.6) |
| 114 | (0.26,0.0) | (0.23,0.0) | (0.21,0.0) | (0.19,29.7) | (0.16,36.2) |
| 116 | (0.19,49.3) | (0.19,39.5) | (0.18,29.2) | (0.17,29.4) | (0.15,40.4) |
| 118 | (0.18,60.0) | (0.17,54.0) | (0.16,28.3) | (0.15,28.2) | (0.13,45.0) |
| 120 | (0.17,60.0) | (0.15,60.0) | (0.13,37.4) | (0.12,38.0) | (0.11,60.0) |
| 122 | (0.10,60.0) | (0.10,60.0) | (0.10,60.0) | (0.09,60.0) | (0.09,60.0) |
3.3 Single particle energies
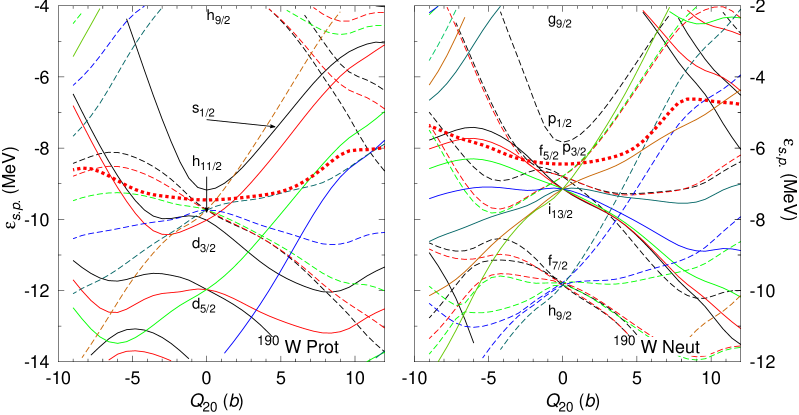
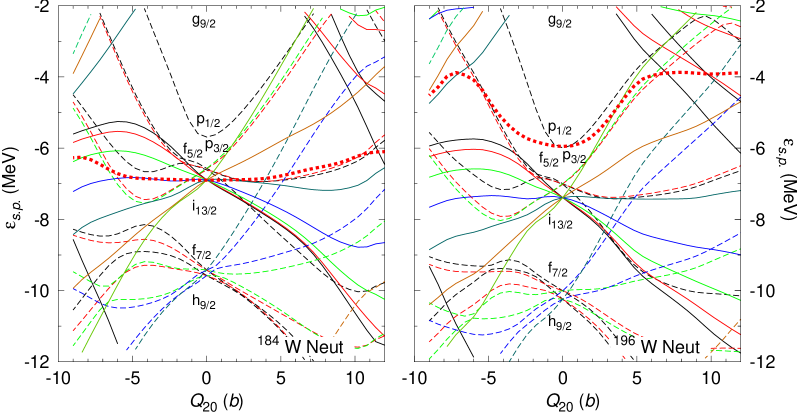
Now we turn our attention to the SPE plots obtained as a function of the axial quadrupole moment for the selected nuclei 184W, 190W and 196W. The SPE plots obtained for other nuclei and/or other interactions (D1N or SLy4 functional) are quite similar to the ones depicted here and thus we consider only these as representative examples. The election is based on the fact that 184W has a prolate ground state, 190W is triaxial whereas 196W shows a minimum in the oblate side. Then, by looking at the SPE we hope to find the features that drive these systems towards their characteristic deformations.
The SPE are plotted in Fig. 6 for the three nuclei mentioned. The SPE are depicted as a function of the axial quadrupole moment and therefore they correspond to axially symmetric configurations (both prolate and oblate). Below we will consider also the behavior of the SPE as a function of the triaxial parameter . Only the proton’s SPE of 190W are plotted as for the other two isotopes they look very similar to the ones already shown. The SPE levels for axially symmetric configurations are tagged by the (half integer) quantum number that corresponds to the third component of the angular momentum in the intrinsic frame. As a consequence of time-reversal invariance, orbitals with the same absolute value of are degenerate (Kramers degeneracy) and therefore they appear as a single line in the plot. The levels gather together at to form the spherical shell model orbitals with quantum numbers . The tags of the most relevant shell model orbits are indicated in the plot. Finally, the (positive) negative parity levels are plotted as (full) dashed lines. In the plot corresponding to the protons in 190W we observe the presence of the level just above the Fermi level and below the , and . For neutrons and 190W we have the level above the Fermi level and an almost degenerate , and orbitals just below the Fermi level. A couple of MeV below we find degenerate and orbitals. Those levels evolve with deformation and at around 6.6 b a gap in the SPE spectrum signaling a region of low level density appears both in the proton and neutron spectra that is responsible for the prolate minimum observed in the axially symmetric potential energy curve (the minimum becomes a saddle point when the triaxial degree of freedom is considered). In the oblate side, at = -6.6 b the neutron’s Fermi level approaches another gap that is responsible for the oblate minimum observed in the axially symmetric PEC. As discussed below both minima are in fact saddle points as long as the degree of freedom is considered. In the case of 184W, the SPE spectrum for neutrons show a gap near the Fermi level for = 8 b. This fact together with the proton’s gap also observed in that region of favors the development of the prolate minimum observed. In the oblate side, both the neutron’s and proton’s SPE show no gap around the Fermi level in the relevant range of deformation justifying the lack of such a minimum. For the nucleus 196W we observe how the neutron’s SPE spectrum shows a gap around the Fermi level for oblate deformations with in the range between -1 b and -10 b that is responsible for the oblate minimum observed in this case. Therefore the prolate-oblate transition seen at N=116 is a consequence of the two gaps in the neutron’s SPE, one in the prolate and the other in the oblate side as the Fermi level crosses them. On the other hand, the proton’s SPE spectrum seems to favor the appearance of coexisting oblate and prolate configurations as Z increases that are the precursors of the triaxial instability observed in that case.
We can also look at the onset of deformation in this region by using the ideas developed by Federman and Pittel (FP) [41] in trying to unify the description of deformation both for light nuclei and heavy ones. A recent study using the same ideas has been performed in Ref. [42]. in the rare earth region. The argument of Ref. [41] is that deformation is driven by the neutron-proton interaction and this is particularly intense between spin orbit partners. Next in the range of relevance of the n-p interaction strength we find interactions between orbitals with the same radial quantum number (FP’s argument is written in the language of spherical shell model orbitals) and large orbital angular momenta differing by one unit (i.e., and ). By looking at the SPE plots in Fig 6 we find the relevant role of the orbital for protons which is very close to the Fermi level for all the nuclei considered in the region. According to FP’s argument this orbital could interact with its neutron spin orbit partner, namely the orbital but this one is well below the Fermi level and can be considered as inert. Near the neutron’s Fermi level we have a , and . Obviously, it is the first one that fulfills the above criteria of and and therefore is the strongly interacting one with the orbital. For values of N around 110 the is in the middle of the Fermi level favoring the observed prolate deformation with well established and deep prolate wells. As N increases the gets more and more occupied and at some point it ceases to play a role that is transferred to the and orbitals. Among them, only the can interact with the of protons but as the values are low we do not expect a strong interaction. This explains why as N increases the depth of the deformation wells decreases favoring triaxial deformations.
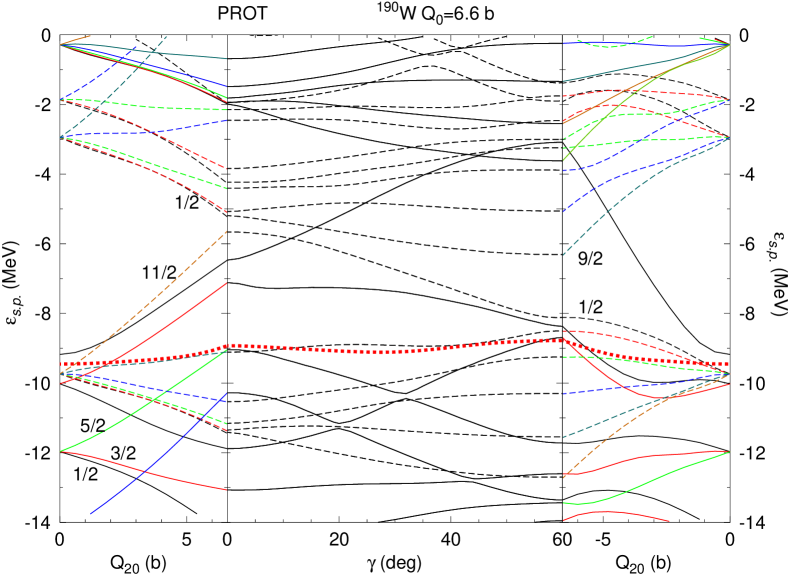
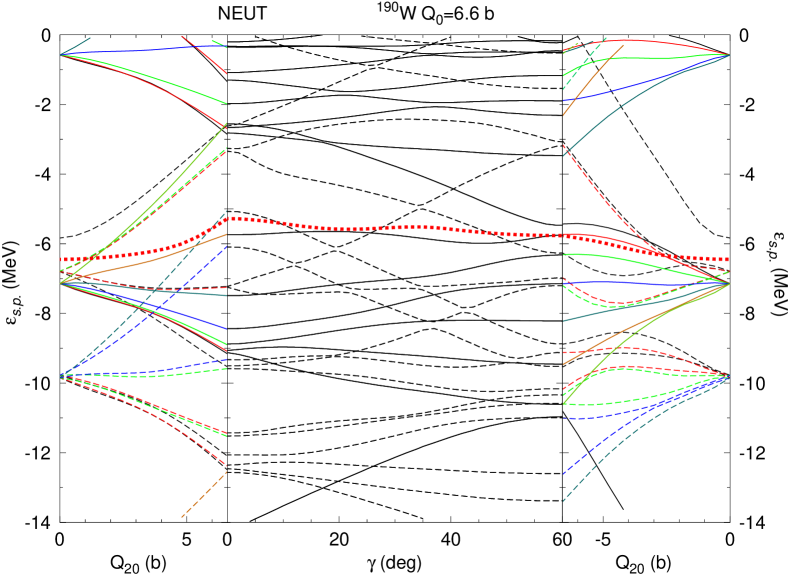
To further investigate the origin of triaxiality we have considered, in addition to the axial SPE plots, also the single particle energies depicted as a function of the degree of freedom and at a value of 6.6 b (that corresponds to the triaxial minimum) for the 190W nucleus. The triaxial SPE for protons are depicted in Fig. 7 whereas Fig. 8 is for neutrons. In those plots we have sticked together the SPE plots along the axially symmetric degree of freedom (leftmost panel for the prolate side, rightmost panel for the oblate side) with the SPE plots along the triaxial degree of freedom (middle panel). The main reason for this representation is to identify the values of the triaxial single particle levels at the axial limits corresponding to and . The first fact worth mentioning is that the contents of most of the levels change as evolves, in such a way that in most cases the value at is different from the value at . A typical example, in the proton spectrum is the negative parity level with and located at MeV at b and that becomes at degrees a orbital (originating from the same spherical subshell).
This is a direct consequence of mixing associated to the triaxial degree of freedom. We also observe, both in the proton and neutron spectra several avoided level crossings taking mainly place between and . Concerning the level density around the Fermi level we observe that the level density of protons is rather low around and this fact is driving the system towards the observed triaxial minimum in 190W at this value. On the other hand, the level density of neutrons remains rather high around the Fermi surface for the whole range of values not favoring the development of a triaxial minimum and indicating a more passive role of neutrons in the generation of triaxiality. We also notice that the addition of extra protons (to have Os and Pt) will locate the Fermi level of protons in the middle of the observed gap (at this value) driving the corresponding system (Os and Pt) to triaxiality as it is observed as a general rule in the systematics of the planes discussed previously. Also the less active role of neutrons in the development of triaxiality is consistent with the systematics of the planes as triaxiality seems to depend rather weakly on neutron number.
3.4 Moments of inertia
The moments of inertia of the first states have been computed for all the nuclei considered. The quantity computed is the Thouless-Valatin or first moment of inertia obtained by using the formula , where is the ray energy for the decay. The theoretical energies involved in the previous definitions have been obtained using the selfconsistent cranking method (i.e., using in the HFB equations a time reversal breaking constraint on the component of the angular momentum operator, , which involves a Lagrange term of the form , see Ref. [31] for an application with the Gogny force). For the calculations we have used the Gogny D1S and D1N forces. The reason for this choice is the success of the D1S parametrization in the description of many high spin-properties over the whole nuclide chart as well as the scarce number of results available for SLy4. The other parametrization has been chosen because its pairing properties are slightly different from the D1S ones and therefore a comparison of the D1S and D1N moments of inertia, which strongly depend upon pairing, can give a hint on the range of values where one can expect a reasonable prediction. The results obtained are presented in Table 2 along with some experimental numbers extracted from the experimental energies. First of all, the D1S and D1N results are quite similar, showing a tendency of bigger values for D1S as a consequence of its slightly reduced pairing correlations as compared to those of D1N. The more pronounced differences are due to slightly different values of the deformation parameter for the ground state. The coincidence of the results give us confidence on the robustness of our theoretical predictions with respect to a change in the interaction. Turning now to the results, they indicate an increase of the moment of inertia in going from neutron number N=110 to N=112 in the lighter isotopes Yb, Hf, and W as a consequence of the quenching of neutron pairing correlations. This effect is not observed in the experimental data. From N=112 and up to the maximum neutron number considered, the moments of inertia decrease as corresponds for a decreasing deformation parameter (exceptions are the N=116 Hf and W isotopes; they correspond to the Hf and W isotopes where the onset of triaxial deformation takes place, see Table 1). Regarding the comparison with the experiment we observe that the selfconsistent cranking results tend to overestimate the experimental values. This is a well known effect, consequence of too low pairing correlations at the mean field level. The cure to this deficiency implies the use of beyond mean field techniques in the treatment of pairing correlations (mainly by restoring the number of particles using projection techniques) which is out of the scope of this paper. Finally, let us conclude this section with the following remark: the values of the moments of inertia obtained do not show any significant and systematic differences when the ground state of the corresponding nuclei are axially symmetric or triaxial. We conclude that the moment of inertia is not a good quantity to disentangle the character of the ground state deformation of the nuclei in this region.
| N | Yb | Hf | W | Os | Pt |
|---|---|---|---|---|---|
| 110 | 35.97 | 32.50 (30.7) | 29.24 (27.0) | 30.86 (21.9) | 25.96 |
| 36.09 | 31.76 | 29.17 | 30.17 | 25.17 | |
| 112 | 43.83 | 35.60 (27.9) | 30.71 (24.5) | 30.67 (19.4) | 25.08 |
| 39.41 | 35.56 | 31.81 | 29.92 | 23.81 | |
| 114 | 34.83 | 28.16 | 25.38 (21.0) | 30.29 | 24.72 |
| 30.19 | 27.51 | 25.34 | 29.38 | 23.00 | |
| 116 | 28.92 | 29.46 | 28.87 | 27.49 | 23.01 |
| 28.72 | 28.35 | 26.85 | 25.80 | 20.36 | |
| 118 | 23.28 | 24.61 | 25.73 | 25.17 | 19.33 |
| 23.09 | 24.32 | 23.70 | 23.04 | 16.45 | |
| 120 | 20.55 | 17.33 | 22.05 | 20.68 | 13.19 |
| 15.43 | 21.48 | 21.57 | 19.70 | 12.23 | |
| 122 | 10.15 | 10.44 | 10.52 | 10.31 | 9.56 |
| 10.05 | 10.17 | 10.05 | 9.69 | 9.08 |
4 Conclusions
We have presented the results of triaxial mean field calculations for several isotopes of the Yb, Hf, W, Os and Pt nuclear species with neutron numbers ranging from N=110 up to N=122. The aim is to explore how the ground state deformation evolves in these nuclei. In order to establish in firm grounds the validity of our findings we have performed the calculations with two different parametrizations of the Gogny force, D1S and D1N, and with the SLy4 parametrization of the Skyrme energy density functional. Those forces/functionals differ in the range of their central parts as well as in their pairing properties and therefore it is to be expected that nuclear deformation characteristics depending upon tiny details of the force/functional will differ in the various calculations. On the other hand, common characteristics present in the two types of calculations can be considered as force/functional independent and therefore as more robust predictions.
We have shown that increasing the proton number in this mass region leads the nuclei to triaxiality. On the other hand, increasing the neutron number, the ground state shapes in the isotopes studied evolve from axially deformed prolate shapes to axially deformed oblate shapes. The transitional nuclei (N116) exhibit a soft behavior with very shallow triaxial minima. The transition occurs with different degrees of stiffness depending on the isotope. The transition is rather sharp for the low Z isotopes Yb and Hf but is much broader for W, Os and Pt where a region of triaxial ground states develops in between the region of prolate and oblate minima. Several isotopes of W, Os and Pt develop triaxial minima but their depths, which are rather low in general, depend strongly on the interaction/functional considered. For this reason, we can only conclude that triaxial effects will surely play a role in the above mentioned cases but the extent to which they influence the nuclear spectrum is still uncertain and calculations considering fluctuations on the deformation parameters (Bohr hamiltonian-like) are needed.
The analysis of the single particle energies both for axially symmetric and triaxial configurations demonstrates the role of different gaps showing up in the SPE of both protons and neutrons as well as the role played by the proton-neutron interaction. Concerning the driving force towards triaxiality, we can conclude that in this region protons play a more relevant role than neutrons.
Finally, the comparison of the selfconsistent moments of inertia shows that this is not the right quantity to look at in order to disentangle the characteristics of the ground state deformation of the nuclei in this region.
Acknowledgments
Work supported in part by MEC, Spain (FPA2007-66069) and MICINN, Spain (FIS2008-01301) and by the Consolider-Ingenio 2010 program CPAN (CSD2007-00042)
References
References
- [1] M. Bender, P.-H. Heenen, and P.-G. Reinhard, Rev. Mod. Phys. 75, 121 (2003).
- [2] R. Bengtsson, T. Bengtsson, J. Dudek, G. Leander, W. Nazarewicz, and J.Z. Zhang, Phys. Lett. B183, 1 (1987).
- [3] W. Nazarewicz, M. A. Riley, and J. D. Garrett, Nucl. Phys. A512, 61 (1990).
- [4] J. L. Wood, K. Heyde, W. Nazarewicz, M. Huyse, and P. Van Duppen, Phys. Rep. 215, 101 (1992).
- [5] Z. Naik, B. K. Sharma, T. J. Jha, P. Arumugam, and S. K. Patra, Pramana 62, 827 (2004).
- [6] P. D. Stevenson, M. P. Brine, Zs. Podolyak, P. H. Regan, P. M. Walker, and J. Rikovska Stone, Phys. Rev. C 72, 047303 (2005).
- [7] R. Fossion, D. Bonatsos, and G. A. Lalazissis, Phys.Rev. C 73, 044310 (2006).
- [8] P. M. Walker and F. R. Xu, Phys. Lett. B635, 286 (2006).
- [9] J. Jolie and A. Linnemann, Phys. Rev. C 68, 031301(R) (2003).
- [10] P. Sarriguren, R. Rodríguez-Guzmán and L.M. Robledo, Phys. Rev. C 77, 064322 (2008).
- [11] Y. Sun, P.M. Walker, F.R. Xu, and Y.X. Liu, Phys. Lett. B 659, 165 (2008).
- [12] I.O. Morales, A. Frank, C.E. Vargas, and P. Van Isacker, Phys. Rev. C 78, 024303 (2008).
- [13] J.E. Garcia-Ramos and K. Heyde, Nucl. Phys.A 825, 39 (2009).
- [14] C. Y. Wu, D. Cline, T. Czosnyka, A. Backlin, C. Baktash, R. M. Diamond, G. D. Dracoulis, L. Hasselgren, H. Kluge, B. Kotlinski, J. R. Leigh, J. O. Newton, W. R. Phillips, S. H. Sie, J. Srebrny, and F. S. Stephens, Nucl. Phys A607, 178 (1996).
- [15] A.E. Stuchbery, S.S. Anderssen, A.P. Byrne, P.M. Davidson, G.D. Dracoulis, and G.J. Lane, Phys. Rev. Lett.76, 2246 (1996).
- [16] C. Wheldon J. Garcés Narro, C. J. Pearson, P. H. Regan, Zs. Podolyák, D. D. Warner, P. Fallon, A. O. Macchiavelli, and M. Cromaz, Phys. Rev. C 63, 011304(R) (2000).
- [17] Zs. Podolyák et al., Phys. Lett. B491, 225 (2000).
- [18] M. Caamaño et al., Eur. Phys. J. A 23, 201 (2005).
- [19] Zs. Podolyák et al., Phys. Rev. C 79, 031305(R) (2009).
- [20] M. Pfützner et al., Phys. Rev. C 65, 064604 (2002).
- [21] P. Ring and P. Schuck, The Nuclear Many-Body Problem (Springer, Berlin-Heidelberg-New York, 1980).
- [22] J. Dechargé and D. Gogny, Phys. Rev. C 21, 1568 (1980).
- [23] J. F. Berger, M. Girod, and D. Gogny, Nucl. Phys. A428, 23c (1984).
- [24] F. Chappert, M. Girod and S. Hilaire, Phys. Lett B 668, 420 (2008)
- [25] E. Chabanat, P. Bonche, P. Haensel, J. Meyer, and R. Schaeffer, Nucl. Phys. A635, 231 (1998).
- [26] F. Iachello and A. Arima, The interacting boson model (Cambridge University Press, London 1987)
- [27] A. L. Goodman, Advances in Nuclear Physics, edited by J. Negele and E. Vogt (Plenum, New York, 1978), Vol. 11, p. 263.
- [28] J. Terasaki, P.-H. Heenen, H. Flocard, and P. Bonche, Nucl. Phys. A600, 371 (1996).
- [29] J. L. Egido, J. Lessing, V. M. Martin and L. M. Robledo, Nucl. Phys. A594 , 70 (1995).
- [30] P. Bonche, H. Flocard, and P.-H. Heenen, Comput. Phys. Comm. 171, 49 (2005).
- [31] J.L. Egido y L.M. Robledo, Phys. Rev. Lett. 70, 2876 (1993).
- [32] A.V. Afanasjev, J. König, P. Ring, L. M. Robledo and J. L. Egido, Phys. Rev. C 62, 054306 (2000).
- [33] R.Rodríguez-Guzmán, J.L. Egido and L.M. Robledo, Phys. Rev. C 62, 054319 (2004).
- [34] R. Rodríguez-Guzmán, J.L. Egido, and L.M. Robledo, Nucl. Phys. A709, 201 (2002).
- [35] J.L. Egido, L.M. Robledo and R. Rodríguez-Guzmán, Phys. Rev. Lett. 93, 082502 (2004).
- [36] R.Rodríguez-Guzmán, J.L. Egido and L.M. Robledo, Phys. Rev. C 69, 054319 (2004).
- [37] S. Hilaire and M. Girod, Eur. Phys. Jour. A33, 237 (2007).
- [38] C. Rigollet, P. Bonche, H. Flocard and P.-H. Heenen, Phys. Rev. C 59, 3120 (1999).
- [39] M. Bender, G. F. Bertsch, and P.-H. Heenen, Phys. Rev. C 73, 034322 (2006).
- [40] B. Sabbey, M. Bender, G. F. Bertsch, and P.-H. Heenen, Phys. Rev. C 75, 044305 (2007).
- [41] P. Federman and S. Pittel, Phys. Lett. B69, 385 (1977).
- [42] R. Fossion, Rev. Mex. Fis. S54, 42 (2008).
- [43] Z.P. Li, T. Niksic, D. Vretenar, J. Meng, G.A. Lalazissis, and P. Ring, Phys. Rev. C 79, 054301 (2009).