Identification of New Near-Infrared DIBs in the Orion Nebula11affiliationmark:
Abstract
Large organic molecules and carbon clusters are basic building blocks of life, but their existence in the universe has not been confirmed beyond doubt. A number of unidentified absorption features (arising in the diffuse inter-stellar medium), usually called “Diffuse Inter-stellar Bands (DIBs)”, are hypothesized to be produced by large molecules. Among these, buckminsterfullerene has gained much attention as a candidate for DIB absorbers because of its high stability in space. Two DIBs at 9577 Å and 9632 Å have been reported as possible features of . However, it is still not clear how their existence depends on their environment. We obtained high-resolution spectra of three stars in/around the Orion Nebula, to search for any correlations of the DIB strength with carrier’s physical conditions, such as dust-abundance and UV radiation field. We find three DIBs at 9017 Å, 9210 Å, and 9258 Å as additional feature candidates, which could support this identification. These DIBs have asymmetric profiles similar to the longer wavelength features. However, we also find that the relative strengths of DIBs are close to unity and differ from laboratory measurements, a similar trend as noticed for the 9577/9632 DIBs.
1 Introduction
The Diffuse Interstellar Bands (hereafter, DIBs) are a series ( 300) of broad absorption lines at = 4000Å to 1.3m. Since the first detections (Heger, 1922; Merrill, 1934), various molecules, including organic compounds (e.g., polycyclic organic hydrocarbons, fullerenes, carbon chains, and carbon nanotubes), have been proposed as the source of DIBs, because they are all relatively stable within the harsh radiation environment of space. Nonetheless, it has not been confirmed observationally what the real source(s) of DIBs are/is, and this remains one of the most long-standing unsolved questions in Astronomy.
Originally, DIBs were detected in the inter-stellar medium (ISM) toward Galactic stars (e.g., Herbig 1995), and then were also detected in the Large and Small Magellanic Clouds (e.g., Cox et al. 2005), in nearby galaxies (Sollerman et al., 2005), in starburst galaxies (Heckman & Lehnert, 2000), and in high column density H I absorption systems (i.e., Damped Ly systems) at redshifts up to 0.5 (York et al., 2006). Thus, DIB absorbers are ubiquitous in space.
Among 300 DIBs, only a few have specific source candidates: e.g., large ionized fullerene () at = 9577 Å and 9632 Å (Foing & Ehrenfreund, 1994), several fullerenes (, , , ) at = 4430 Å (Iglesias-Groth, 2007), and naphthalene cation () at = 6125 Å, 6489 Å, and 6707 Å (Iglesias-Groth et al., 2008). These DIBs have wavelengths that are very close to those measured in laboratory. By running a variety of gas-phase chemical models, Bettens & Herbst (1996) confirmed that linear hydrocarbons are spontaneously converted into cyclic rings and fullerenes. Among these, the DIBs at = 9577 Å and 9632 Å are most clearly detected, and have been discussed frequently (e.g., Foing & Ehrenfreund 1994, 1997; Galazutdinov et al. 2000). However, their identification is still in question, because Foing & Ehrenfreund (1994) did not report on the other weaker transitions of at = 9366 Å and 9419 Å, which should exist in conjunction with the two detected DIBs, if their carrier really is (Jenniskens et al., 1997). Further observations that would support this identification are required. In this paper, we concentrate on the ISM in the Orion Nebula, and report on the detectability of several DIBs at 9000 Å – 9700 Å, depending on the stellar environments.
2 Observations and Data Reduction
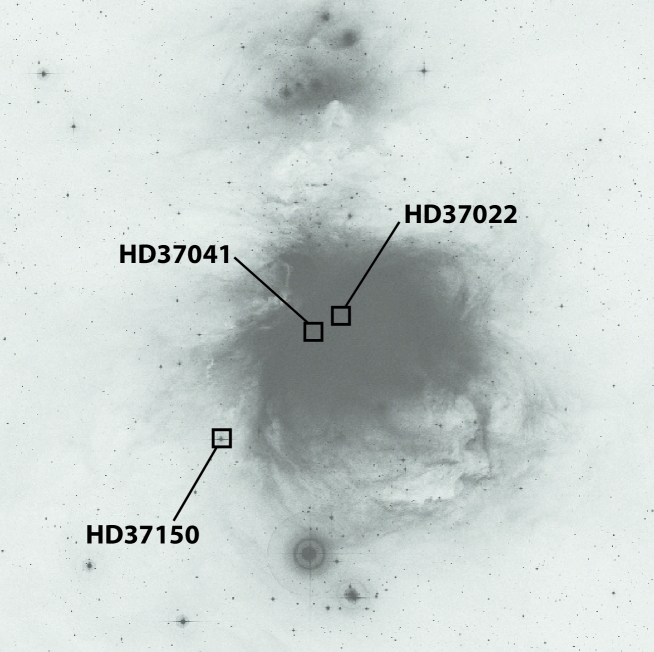
We obtained spectra of three O/B stars in or around the Orion Nebula on 2008 November 14 (UT) with the Subaru telescope and High Dispersion Spectrograph (HDS; Noguchi et al. 2002). The positions of our targets are shown in Figure 1. Two stars (HD 37022 and HD 37041) lie in the central region of the nebula. The other star (HD 37150) is located at the edge of the nebula. Because our targeted wavelength region is at 9000 Å – 10000 Å, a number of telluric lines give severe contamination. Therefore, we observed a standard star (HD 37397)111This is a rapid rotator, located close to the Orion Nebula. Its high rotational velocity ( 350 km s-1) and spectral type earlier than B2 (Glebocki & Stawikowski, 2000), are optimal for our purpose. near the nebula to divide out these lines, as described in Section 2.1. Stellar intrinsic features are smoothed out, because HD 37397 is a rapid rotating star with rotational velocity of = 355 km s-1 (Glebocki & Stawikowski, 2000). We used a 03 slit width (), and adopted 2 pixel binning only along the spatial direction. The red grating, with a central wavelength of 8650 Å, was used to cover the wavelength of 7310 Å and 8560 Å on the blue CCD chip and 8710Å and 10000Å on the red CCD chip. Only the red CCD data was used because the blue CCD photon counts were saturated and deviated from linearity. We reduced the data in a standard manner using the IRAF software222IRAF is distributed by the National Optical Astronomy Observatories, which are operated by the Association of Universities for Research in Astronomy, Inc., under cooperative agreement with the National Science Foundation.. For wavelength calibration, we used a Th-Ar spectrum. After removing telluric lines by dividing the object spectra by the standard star spectrum (see Sect. 2.1), we directly fitted the continuum with a third-order cubic spline function. To increase signal-to-noise (S/N), every 0.1 Å-wide segments are smoothed and resampled.
2.1 Removal of Telluric Lines
Once we extract one-dimensional spectra of three target stars, we need to remove telluric lines by using a standard star spectrum. Because DIBs, whose profiles are usually very broad and shallow, are easily buried in strong telluric lines, a careful removal is necessary.
First, we normalize the standard star spectrum, leaving only telluric features because rotationally broadened stellar lines are fitted out as continuum. Because the object stars are observed under slightly different airmass from that of the standard star, we have to correct telluric lines according to their optical depth, as
| (1) |
where and are raw and corrected normalized spectra of telluric lines, respectively. The sec(obj,ss) is the airmass toward the object or standard star. Here, we assume a plane parallel atmosphere, because sec toward our targets (including a standard star) are all close to 1 (i.e., close to zenith) and because object/standard stars were all observed close in time to each other. Finally, we obtain telluric free spectra by dividing the spectra of object stars by the airmass-corrected telluric line spectrum.
We observed only one standard star for the telluric line removal, and its spectral type is slightly different from those of the object stars. Nonetheless, the photospheric features from the standard star do not affect the final object spectra significantly, because their line profiles are all broad and shallow and they should be fitted out while continuum fitting. On the other hand, any photospheric features from the object stars will still remain after dividing by the standard star spectrum. We investigate these in detail in Section 4.3.
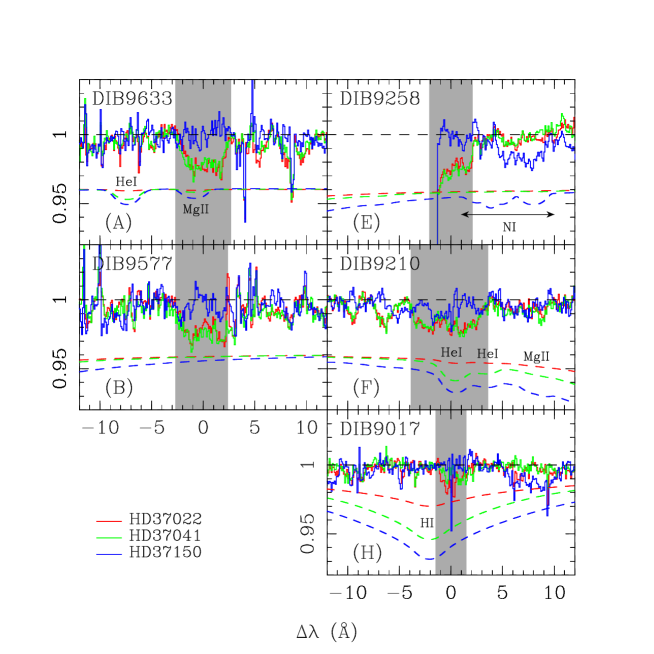
An observation log is given in Table 1, in which we list target name, coordinate (RA and Dec), apparent visual magnitude, spectral type, total exposure time, signal-to-noise (S/N) ratio per pixel after sampling, averaged sec, degree of reddening, dust extinction in the visual band, effective temperature, and surface gravity. Normalized spectra of our three target stars are presented in Figure 2. We show only five DIB regions, which we discuss below.
3 Identifications of DIBs
At first we search for the two DIBs at 9577 Å and 9632 Å (i.e., candidates for absorption) in the spectra of three target stars. Among these, detections have been reported only toward HD 37022 (e.g., Jenniskens et al. 1994; Foing & Ehrenfreund 1997; Moutou et al. 1999). We use all absorption features that are detected with 5 level. Both DIBs are detected toward the two stars within the nebula, while no features are detected toward HD 37150, with an equivalent width detection limit of EW = 7.0 mÅ and 5.5 mÅ for DIB 9577 and 9632, respectively. Based on laboratory measurements, Fulara et al. (1993) present wavelengths of 13 vibrational-mode absorption lines of (in neon matrix) at 8323 Å – 9642 Å (in air), of which 7 are covered by our Subaru spectra. Our identification results for the three target spectra are summarized in Table 2. Following column (1) with ID name, columns (2) and (3) give vacuum wavenumbers and air wavelengths of expected features, columns (4), (5), (6), and (7) are flux-weighted central wavelengths, EW, wavelength shift from the laboratory measurement, and full-width at half maximum (FWHM) of DIBs toward HD 37022. Columns (8), (9), (10) and (11) are identical to (4) – (7) but toward HD 37041, column (12) shows the 5 detection limit of DIBs toward HD 37150. We did not correct for contamination from the stellar Mg II lines when we measure equivalent widths of DIB 9632, because their equivalent widths are no more than 50 mÅ for spectral types of O7 – B3I (Galazutdinov et al. 2000; see further discussion in Section 4.3). All of our targets and the standard star lie in this category. Interestingly, three DIBs are newly identified as possible lines, and detected only toward stars in the nebula. The equivalent width and the FWHM of each DIB are measured and presented in Table 2, although the latter has much uncertainty. Because of the presence of substructure (see Section 4.2) in the DIB and the contamination with strong telluric lines, it is not straightforward to measure widths. In Figure 2, we shaded the wavelength regions around the five DIBs, over which we carried out the measurements.
All target stars are affected by both the interstellar and the local extinction. The degree of reddening, , listed in Table 1 is the difference between the observed color and the expected color, where the expected color is estimated from the predictions of Bessell et al. (1998) by using the effective temperature and surface gravity measurements from Brown et al. (1994). We also list extinction values from Brown et al. (1994). The reddening is significant toward HD 37022 in Trapezium, and also toward HD 37041, which has only a small offset of 2.4′ (0.3 pc) from HD 37022. Both stars lie in highly ionized central region of the Orion Nebula. On the other hand, HD 37150, whose distance from Trapezium is 20′ (2.5 pc), has small reddening. Thus, our target selection enables us to trace two regions of the Orion Nebula with very different physical conditions.
4 Discussion
We can draw several inferences on the DIB carriers in the Orion Nebula from our observations; physical condition with regard to their internal structure, and correlation with dust abundance. We have also found additional candidates of DIBs. We discuss all these below.
4.1 Physical Conditions of the DIB Carriers
Our targets are distributed at the center or the edge of the Orion Nebula, which enables us to compare the detectability of DIBs in two extreme physical conditions. The regions toward HD 37022 and HD 37041 are strongly UV-irradiated by the hot Trapezium stars, while the ionization condition toward HD 37150 is probably much lower. Visual extinction is also very different — the former two are severely, and the latter is only slightly, reddened. DIBs are known to have a strong correlation with neutral hydrogen column density (i.e., gas abundance; Welty et al. 2006) as well as dust extinction (i.e., dust abundance; Herbig 1993). Local UV radiation may enhance the 9577/9632 DIBs (Foing & Ehrenfreund, 1997). We detect these DIBs only toward two stars at the strongly UV-irradiated regions with much amount of dust, which is consistent with past results. This trend can be explained by a “skin effect” — the effective shielding of UV radiation by the inner layers of dust in the nebula, as proposed in Cami et al. (1997). Cami et al. (1997) also measured the complete DIB spectrum of HD 37022, and discovered that almost all optical DIBs (except for DIBs at = 5780 Å and 6284 Å, as shown in Jenniskens et al. 1994) were very weak or not detected toward this extremely high UV-irradiated region. It is likely that the carriers of these DIBs are dissociated under such high ionizing radiation. On the other hand, 5780/6284 DIBs as well as 9577/9632 DIBs show a clear correlation of their absorption strengths with their local ionization levels, which means these carriers prefer an ionized phase (i.e., with ionization potential (IP) = 11.3 eV for the 9577/9632 DIBs) to a neutral phase (i.e., with IP = 7.6 eV) (Foing & Ehrenfreund, 1997). Thus, we confirm the 9577/9632 Å DIB carriers have small-scale (i.e., on a few parsec scale) spatial fluctuation in a single cloud (i.e., the Orion Nebula), while Galazutdinov et al. (2000), already noted a Galactic scale fluctuation. We reconfirm that the detection of the 9577/9632 DIB require large amount of dust as well as strong UV radiation.
4.2 Internal Substructure in the DIBs
The 9577/9632 DIBs were previously treated as a single Gaussian profile (e.g., Foing & Ehrenfreund 1997) and their equivalent widths are also measured using this assumption (e.g., Galazutdinov et al. 2000). However, the DIBs toward the Orion Nebula clearly show asymmetrical profiles with possible multiple components in our high resolution spectra. Actually, this asymmetrical profile can be seen in the past papers, especially for DIB 9632 (e.g., Foing & Ehrenfreund 1997), although it was not discussed in detail. Ehrenfreund & Foing (1996) resolved three optical DIBs at 5797, 6379, and 6613 Å into two or three subcomponents, following the first discovery of substructure by Westerlund & Krelowski (1988a, b). They conclude that rotational contours probably play a major role in this internal structure, following Danks & Lambert (1976), although there could be small contributions from other sources (e.g., instrumental line spread, thermal broadening, gas turbulence, and intramolecular vibration rotation energy transfer).
Here, we would like to suggest an additional contributor to the broadening that we observe; i.e., the existence of discrete absorbers along our sight lines. O’dell et al. (1993) took high resolution spectra of four Trapezium stars (including HD 37022 and HD 37041), and discovered internal substructures with multiple absorption components in Ca II and Na I absorption profiles. The typical velocity distributions of these lines are 30–50 km s-1 and up to 60 km s-1, which is one third of the FWHM (130 km s-1) of the 9577/9632 DIBs we observed. If each velocity component seen in Ca II and Na I gives rise to the DIB profiles, these would result in a substantial contribution to the DIB broadening. We performed a simple test for this scenario as follows. Foing & Ehrenfreund (1997) measured the FWHM of the 9577/9632 DIBs toward three stars (including one of our targets, HD 37022), and obtained a slightly larger line width toward HD 37022 (FWHM 4 Å) as compared to the line widths toward two other stars (FWHM 2.9 Å). This difference can be reproduced by adding an internal velocity dispersion of 80 km s-1 to a DIB cloud toward HD 37022, which is possible because multiple Ca II and Na I clouds are distributed within a similar velocity width, 60 km s-1, as described above. Our results suggest that several discrete DIB clouds contribute non-negligibly to the total DIB line width. However, it should be noted that the major source of DIB broadening is likely to be intrinsic to the molecular structure of the carriers, because (i) such an internal structure is seen even if corresponding atomic lines have single Gaussian profiles at the same velocity (e.g., Figure 1 of Galazutdinov et al. 2008), and because (ii) DIBs have similar characteristic profiles toward various sightlines (e.g., Figure 2 of Galazutdinov et al. 2008). Both of these support the idea that the main source of DIB broadening is molecular in origin.
For further investigation of the internal structure of the 9577/9632 DIBs, high quality spectra with higher S/N ratio would be required.
4.3 Other Possible DIBs
Although Foing & Ehrenfreund (1994) detected two DIBs within 10 Å of the laboratory-measured positions of two absorption features (Fulara et al., 1993), this identification was questioned by Jenniskens et al. (1997) because two other absorption lines at 9366 Å and 9419 Å are not detected simultaneously. Thus, this identification is not yet a matter of consensus. Additional evidence is required for further discussion. Using our Subaru spectra with relatively wide wavelength coverage from 8700 Å to 1 , we attempt to confirm the existence of 7 of 9 lines (in addition to the 9577/9632 DIBs) from Fulara et al. (1993). Unfortunately, the 9372/9429 Å lines in question (at 9366 and 9419 Å, according to Jenniskens et al. 1997) are on an echelle order gap or wavelength region that is hopelessly affected by telluric lines. Among the other 5 lines, three at 9258, 9210, and 9017 Å are clearly detected with 10 Å difference from the laboratory measurements, but one at 9154 Å is not seen with 5 level toward HD 37022 and HD 37041 (see Table 2). We cannot search for a line at 8954 Å because it is on an echelle order gap. No lines are detected toward HD 37150.
In order to rule out the possibility that these five DIBs arise in the stellar photosphere, we synthesized stellar spectra using model atmospheres with the ATLAS9 and SYNTHE codes (Kurucz, 2005; Sbordone, 2005). We used model parameters such as stellar rotational velocity, effective temperature, and surface gravity that are appropriate to each star (as listed in Table 1) from the literature (Brown et al., 1994). The model spectra are overlaid on the observed spectra and the most prominent absorption features are named in Figure 2. Below, we discuss each DIB.
- DIB 9633. —
-
This is one of the two DIBs that have been proposed to be associated with . Although it is partially blending with Mg II line from stellar photosphere, the Mg II line center is clearly shifted blueward from the center of the DIB. Moreover, the Mg II line is weak compared to the DIB. This is the case especially for type O stars. This was one of the first DIBs discovered in the near-infrared.
- DIB 9577. —
-
Another DIB whose origin was suggested to be . There are no narrow stellar intrinsic lines within 10 Å of the DIB, although the DIB is positioned at the red wing of a very broad H I line at = 9546.0 Å. The detection of this DIB is highly secure.
- DIB 9258. —
-
We have discovered this DIB, and discuss it here for the first time. Although it is located at the edge of an echelle order, the detection itself is secure because line features toward two different stars (i.e., HD 37022 and HD 37041) are almost identical. Their origin is neither stellar photospheric, nor due to any instrumental data defect. The feature is only seen toward the Trapezium stars, as noted for the two DIBs mentioned above. An absorption feature at = 5 – 10 Å toward HD 37150 is probably caused by the N I line complex within the stellar photosphere, which is more prominent for type B stars than type O stars (see Figure 2). A mild inclination of the model continua is due to a strong Mg II line at = 9244.4 Å.
- DIB 9210. —
-
Only this DIB was significantly blending with stellar intrinsic features of He I at = 9210.3 Å and 9213.2 Å and Mg II at = 9218.3 Å. However, the flux-weighted centers are shifted slightly redward from the line center of this DIB. The whole range of the observed feature cannot be reproduced only by the stellar photospheric lines, and much of the absorption must originate in a DIB. The equivalent width and line width of this DIB listed in Table 2 are only upper limits. The inclined continuum of the model spectra is due to a strong H I line at = 9229.0 Å.
- DIB 9017. —
-
This is the weakest one among the five DIBs we detected in our spectra. The DIB is detected only toward the Trapezium stars like the other DIBs, which also supports this discovery. A strong H I line is located at = 9014.9 Å near the DIB, but it should not affect the DIB because of its broad and smooth line profile (i.e., it will be fitted out during spectrum normalization).
Interestingly, all detected DIBs are blue-shifted from the laboratory measurements by 4–8 Å ( 150–200 km s-1); this is the same trend as seen in the 9577/9632 DIBs. This blue-shift is not due to any outflow of DIB carriers from the Orion Nebula, because the corresponding Ca II and Na I absorption lines are blue-shifted only up to 20 km s-1 in heliocentric velocity, about one order of magnitude smaller than the DIB velocity shift (O’dell et al., 1993). We suspect this is a systematic trend due to differences in physical conditions between the gas-phase inter stellar medium and the laboratory neon matrix measurement, as found for other molecules like naphthalene (C10H8+; Salama & Allamandola 1992), coronene and ovalene (C24H12 and C32H14; Ehrenfreund et al. 1992). This wavelength shift is also estimated to be smaller in the near-infrared band at 1 m ( 5 – 10 cm-1, which is almost same value as our results in Table 2) than that in the optical band ( 20 – 50 cm-1; Galazutdinov et al. 2000). The measurement in matrix would also change the relative strengths of absorption lines (Fulara et al., 1993). This may explain our result that the lines at 9528, 9210, and 9012 Å, whose strengths are very weak (by a factor of 10 compared to the stronger 9577/9632 lines) in the laboratory measurements (Fulara et al., 1993), are detected with almost same equivalent widths as those of the 9577/9633 DIBs in our spectra. If these DIBs are really arising from the same molecule, their line widths also would be expected to be similar (Maier, 1994). The FWHMs of the three newly detected DIBs at 9258, 9210, and 9017 Å are 3 Å, 6.5 Å, and 2.5 Å, respectively, which are scattered around those of the 9577/9632 DIBs, 4.5 Å. This could be due to contamination of other atomic lines (for DIB 9210) or a failure in detecting weak profile wings (for DIB 9017). More precise measurements for in laboratory without using neon/argon matrix are desirable.
4.4 Correlation of the DIB Strength with Dust Abundance
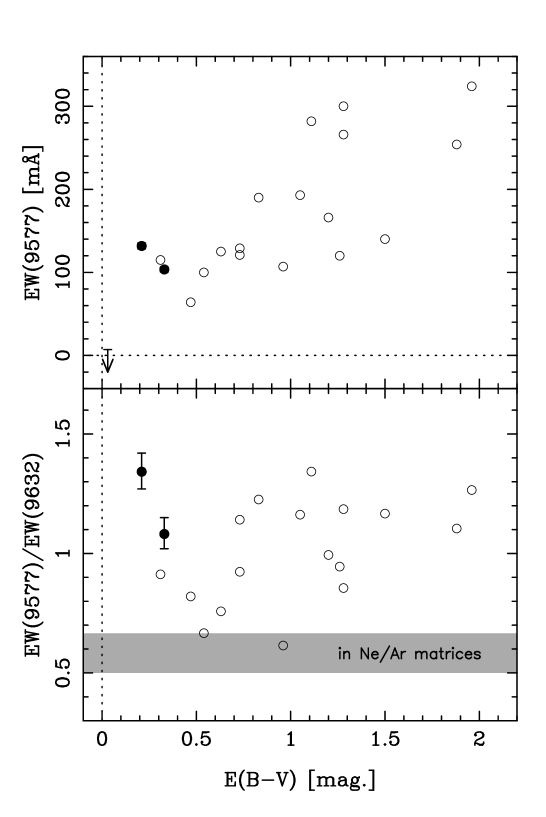
From their DIB survey, targeting the Milky Way, the LMC, and the SMC, Welty et al. (2006) have found a clear correlation between the strength of DIBs and the H I column density along the line of sight. Following this result, Lawton et al. (2008) embarked on a survey of the 5780 DIB in Damped Ly (DLA) systems (with (H I) of 20.3 [cm-2]) at cosmological distances, and discovered one system with two DIBs at of 5705 Å and 5780 Å with moderate reddening DLA system (E(BV) = 0.23) at = 0.5 (York et al., 2006). So far, this is the highest redshift at which DIBs have been detected. This detection would imply that DIB carriers are distributed universally, and their abundance probably has a strong correlation with dust as well as gas abundance. Similar correlations have also been noted for the 9577/9632 DIBs (Galazutdinov et al., 2000), and our results are consistent with these (see Figure 3). Although our measured 9577 DIB strengths lie slightly above from the expected value, this may be because the ratio of total-to-selective extinction, = , is larger toward stars in the Orion Nebula, as shown in Table 1.
The equivalent width ratio of these DIBs should remain unchanged by the absorber’s physical conditions if they all have the same carrier (Maier, 1994). Fulara et al. (1993) estimated the relative strength of the 9577/9632 DIBs to be 1.5 in a neon matrix, but with an uncertainty over the range of 1.5 to 2.0, depending on production conditions. On the other hand, this ratio is close to 1 in our observation toward two stars in the Orion Nebula (see Figure 3). This is instead consistent with other measurements. Jenniskens et al. (1997) and Galazutdinov et al. (2000) also found the ratio of close to 1. If it can be confirmed that the gas phase measurement gives a smaller intensity ratio of close to unity in the laboratory, the identification of these DIBs with would be strengthened.
5 Summary
We have investigated the detectability of the 9577/9632 DIBs that are candidates of absorption features. We obtained spectra of two stars in the Orion Nebula and one star at the edge of the nebula. These DIBs are detected only toward the two stars in the nebula.
Furthermore, for the first time, we have detected three other DIBs that could also arise in . The wavelengths of these features matches the laboratory values to within 10 Å. With our high-resolution spectra ( = 120,000), we found internal structures in the DIBs with two or three components. If our sight-lines really trace multiple clouds, those could partially contribute to the line broadening of the DIBs, though the main cause is likely to be relate to molecular transitions. The DIB strength and dust reddening from our data are consistent with correlations seen by previous studies, which means that we are probably observing the same DIB carrier. For further investigation, we need (i) spectra with higher S/N ratio, (ii) precise measurements of in the laboratory without using matrix, and (iii) spectra taken from the space (e.g., using Hubble Space Telescope) to detect the DIBs without any contamination from the telluric lines.
References
- Bessell et al. (1998) Bessell, M. S., Castelli, F., & Plez, B. 1998, A&A, 333, 231
- Bettens & Herbst (1996) Bettens, R. P. A., & Herbst, E. 1996, ApJ, 468, 686
- Brown et al. (1994) Brown, A. G. A., de Geus, E. J., & de Zeeuw, P. T. 1994, A&A, 289, 101
- Cami et al. (1997) Cami, J., Sonnentrucker, P., Ehrenfreund, P., & Foing, B. H. 1997, A&A, 326, 822
- Cox et al. (2005) Cox, N. L. J., Kaper, L., Foing, B. H., & Ehrenfreund, P. 2005, A&A, 438, 187
- Danks & Lambert (1976) Danks, A. C., & Lambert, D. L. 1976, MNRAS, 174, 571
- Ehrenfreund & Foing (1996) Ehrenfreund, P., & Foing, B. H. 1996, A&A, 307, L25
- Ehrenfreund et al. (1992) Ehrenfreund, P., D’Hendencourt, L., Verstraete, L., Leger, A., Schmidt, W., & Defourneau, D. 1992, A&A, 259, 257
- Foing & Ehrenfreund (1997) Foing, B. H., & Ehrenfreund, P. 1997, A&A, 319, L59
- Foing & Ehrenfreund (1994) Foing, B. H., & Ehrenfreund, P. 1994, Nature, 369, 296
- Fulara et al. (1993) Fulara, J., Jakobi, M., & Maier, J. P. 1993, Chemical Physics Letters, 211, 227
- Galazutdinov et al. (2008) Galazutdinov, G. A., LoCurto, G., & Krełowski, J. 2008, ApJ, 682, 1076
- Galazutdinov et al. (2000) Galazutdinov, G. A., Krełowski, J., Musaev, F. A., Ehrenfreund, P., & Foing, B. H. 2000, MNRAS, 317, 750
- Glebocki & Stawikowski (2000) Glebocki, R., & Stawikowski, A. 2000, Acta Astronomica, 50, 509
- Heckman & Lehnert (2000) Heckman, T. M., & Lehnert, M. D. 2000, ApJ, 537, 690
- Heger (1922) Heger, M. L. 1922, Lick Observatory Bulletin, 10, 141
- Herbig (1993) Herbig, G. H. 1993, ApJ, 407, 142
- Herbig (1995) Herbig, G. H. 1995, ARA&A, 33, 19
- Iglesias-Groth et al. (2008) Iglesias-Groth, S., Manchado, A., García-Hernández, D. A., González Hernández, J. I., & Lambert, D. L. 2008, ApJ, 685, L55
- Iglesias-Groth (2007) Iglesias-Groth, S. 2007, ApJ, 661, L167
- Jenniskens et al. (1997) Jenniskens, P., Mulas, G., Porceddu, I., & Benvenuti, P. 1997, A&A, 327, 337
- Jenniskens et al. (1994) Jenniskens, P., Ehrenfreund, P., & Foing, B. 1994, A&A, 281, 517
- Kurucz (2005) Kurucz, R. L. 2005, Memorie della Societa Astronomica Italiana Supplement, 8, 14
- Lawton et al. (2008) Lawton, B., Churchill, C. W., York, B. A., Ellison, S. L., Snow, T. P., Johnson, R. A., Ryan, S. G., & Benn, C. R. 2008, AJ, 136, 994
- Maier (1994) Maier, J. P. 1994, Nature, 370, 423
- Merrill (1934) Merrill, P. W. 1934, PASP, 46, 206
- Moutou et al. (1999) Moutou, C., Krełowski, J., D’Hendecourt, L., & Jamroszczak, J. 1999, A&A, 351, 680
- Noguchi et al. (2002) Noguchi, K., Aoki, W., Kawanomoto, S., Ando, H., Honda, S., Izumiura, H., Kambe, E., Okita, K., Sadakane, K., Sato, B., Tajitsu, A., Takada-Hidai, M., Tanaka, W., Watanabe, E., and Yoshida, M., 2002, PASJ, 54, 6
- O’dell et al. (1993) O’dell, C. R., Valk, J. H., Wen, Z., & Meyer, D. M. 1993, ApJ, 403, 678
- Salama & Allamandola (1992) Salama, F., & Allamandola, L. J. 1992, ApJ, 395, 301
- Sbordone (2005) Sbordone, L. 2005, Memorie della Societa Astronomica Italiana Supplement, 8, 61
- Simón-Díaz et al. (2006) Simón-Díaz, S., Herrero, A., Esteban, C., & Najarro, F. 2006, A&A, 448, 351
- Sollerman et al. (2005) Sollerman, J., Cox, N., Mattila, S., Ehrenfreund, P., Kaper, L., Leibundgut, B., & Lundqvist, P. 2005, A&A, 429, 559
- Welty et al. (2006) Welty, D. E., Federman, S. R., Gredel, R., Thorburn, J. A., & Lambert, D. L. 2006, ApJS, 165, 138
- Westerlund & Krelowski (1988a) Westerlund, B. E., & Krelowski, J. 1988a, A&A, 189, 221
- Westerlund & Krelowski (1988b) Westerlund, B. E., & Krelowski, J. 1988b, A&A, 203, 134
- York et al. (2006) York, B. A., Ellison, S. L., Lawton, B., Churchill, C. W., Snow, T. P., Johnson, R. A., & Ryan, S. G. 2006, ApJ, 647, L29
| Star | RAa | Deca | Spectral Type | Exposure | S/Nb | secc | E(BV)d | e | ()f | (g)g | |
|---|---|---|---|---|---|---|---|---|---|---|---|
| (h:m:s) | (d:m:s) | (mag.) | (sec) | (pix-1) | (mag.) | (mag.) | (K) | (cm s-2) | |||
| (1) | (2) | (3) | (4) | (5) | (6) | (7) | (8) | (9) | (10) | (11) | (12) |
| HD 37022 | 05 35 16.5 | -05 23 23 | 5.13 | O6pe | 240 | 200 | 1.129 | 0.33 | 1.74 | 4.64 | 4.80 |
| HD 37041 | 05 35 22.9 | -05 24 58 | 5.08 | O9.5Vpe | 240 | 211 | 1.137 | 0.21 | 1.12 | 4.50 | 4.18 |
| HD 37150 | 05 36 15.0 | -05 38 53 | 6.51 | B3Vv | 840 | 139 | 1.185 | 0.03 | 0.05 | 4.31 | 4.30 |
| HD 37397 | 05 38 13.7 | -01 10 09 | 6.81 | B2V | 840 | 1.113 | 0.05 | 0.09 | 4.28 | 4.47 |
| HD 37022 | HD 37041 | HD 37150 | ||||||||||||
|---|---|---|---|---|---|---|---|---|---|---|---|---|---|---|
| ID | a | b | EWc | d | FWHMe | EWc | d | FWHMe | EWc | |||||
| (cm-1) | (Å) | (Å) | (mÅ) | (Å) | (Å) | (Å) | (mÅ) | (Å) | (Å) | (mÅ) | ||||
| (1) | (2) | (3) | (4) | (5) | (6) | (7) | (8) | (9) | (10) | (11) | (12) | |||
| A | 10368 | 9642.4 | 9633.2 | 95.72.8 | 9.2 | 4.2 | 9633.0 | 98.23.1 | 9.4 | 4.5 | 5.5 | |||
| B | 10435 | 9580.5 | 9577.0 | 103.53.0 | 3.5 | 4.4 | 9577.2 | 131.83.5f | 3.3 | 5.4 | 7.0 | |||
| Cg | 10603 | 9428.7 | … | … | … | … | … | … | … | … | … | |||
| Dh | 10667 | 9372.1 | … | … | … | … | … | … | … | … | … | |||
| Ei | 10792 | 9263.6 | 9258.3 | 88.62.4 | 4.7 | 3.4 | 9258.3 | 96.42.5 | 5.3 | 3.3 | 6.0 | |||
| F | 10845 | 9218.3 | 9209.7 | 129.23.4 | 8.6 | 6.6 | 9209.7 | 121.83.5 | 8.6 | 6.5 | 6.5 | |||
| G | 10922 | 9153.5 | … | 5.0 | … | … | … | 4.0 | … | … | 7.0 | |||
| H | 11082 | 9021.1 | 9017.0 | 31.01.7 | 4.1 | 2.3 | 9017.8 | 9.72.7j | 3.3 | 2.8 | 5.5 | |||
| Ih | 11165 | 8954.1 | … | … | … | … | … | … | … | … | … | |||