Production in In-In Collisions at 158 A GeV
Abstract
The NA60 experiment has measured muon pair production in In-In collisions at 158 AGeV at the CERN SPS. This paper presents a high statistics measurement of meson production. Differential spectra, yields, mass and width are measured as a function of centrality and compared to previous measurements in other colliding systems at the same energy. The width of the rapidity distribution is found to be constant as a function of centrality, compatible with previous results. The decay muon polar angle distribution is measured in several reference frames. No evidence of polarization is found as a function of transverse momentum and centrality. The analysis of the spectra shows that the has a small radial flow, implying a weak coupling to the medium. The parameter measured in In-In collisions suggests that the high value observed in Pb-Pb in the kaon channel is difficult to reconcile with radial flow alone. The absolute yield is compared to results in Pb-Pb collisions: though significantly smaller than measured by NA50 in the muon channel, it is found to exceed the NA49 and CERES data in the kaon channel at any centrality. The mass and width are found to be compatible with the PDG values at any centrality and at any : no evidence for in-medium modifications is observed.
pacs:
25.75.NqQuark deconfinement, quark-gluon plasma production, and phase transitions and 25.75.-qRelativistic heavy-ion collisions and 25.75.DwParticle and resonance production and 14.40.CsOther mesons with , GeV and 12.38.MhQuark-gluon plasma1 Introduction
QCD predicts the occurrence of a phase transition from hadronic matter to a deconfined plasma of quarks and gluons, when sufficiently high energy densities are reached. Strangeness enhancement was proposed long ago as a signature of this phase transition Rafelski:1982pu ; Shor:1984ui . The meson is a key experimental probe in this context: due to its valence quark content it permits to measure strangeness production. It was suggested that, being a hidden strangeness state, the should not be sensitive to canonical suppression, and can thus be used to test strangeness enhancement models Becattini:1997ii ; Andronic:2003zv ; Becattini:2005xt ; Becattini:2008yn ; Abelev:2008zk .
Moreover, it has been argued that the spectral function of the or of its decay products could be modified in the medium. This would reflect in changes of its mass and partial decay widths. Mass shifts of vector mesons, as a consequence of the change of the quark condensate in the medium, were originally proposed by Brown and Rho Brown:1991kk . Subsequently, the meson mass dependence on the medium density was calculated with QCD sum rules Hatsuda:1991ez . Modifications of the width in the context of this dropping mass scenario were investigated, for instance, in the model of Ref. Pal:2002aw . As an alternative approach, both the mass and width changes were studied in the framework of hadronic many body models (see vanHees:2007th for an up-to-date discussion), which predict a broadening and no or small mass shift. Finally, it was suggested that in-medium changes could also appear in cold nuclear matter Cabrera:2002hc ; Oset:2000eg .
It is important to point out that, contrary to the meson which has a lifetime of 1.3 fm, much smaller than the lifetime of the fireball (7-10 fm), the has a lifetime of 44 fm. Therefore in-medium effects on the mass or width might be difficult to isolate experimentally, and might only appear at very low . A possible way of tracing down those modifications is the comparison of the particle yields and spectra in the dilepton and in the kaon channel: since the is almost at the threshold for the channel, even a small change in its spectral properties should lead to a significant difference in the two channels Shuryak:1999zh . A discrepancy in the two channels could also be ascribed to final state effects related to in medium kaon absorption or rescattering Johnson:1999fv ; Santini:2006cm .
The KEK-PS E325 experiment reported evidence for a large excess to the low mass side of peak in p-Cu at 12 GeV for , corresponding to slow mesons, having a higher chance to decay inside the Cu nucleus (the effect was not observed in p-C and for higher values of ) Muto:2005za . This excess was explained in terms of an in-medium modified component with mass decreased by MeV and width broadened by a factor 3.6 with respect to the PDG value. The reported yield associated to this excess is very significant: 20% of the total yield.
production was studied extensively at the SPS by several experiments. NA49 measured production in p-p, C-C, Si-Si and Pb-Pb at 158 AGeV in the channel Friese:2002re ; Alt:2004wc ; Afanasev:2000uu . These data show that the yield breaks scaling and that the enhancement, quantified as , saturates already for Si-Si central collisions. Pb-Pb collisions were also studied in different experimental conditions by the NA50 experiment, which found contrasting results. NA50 studied the channel Alessandro:2003gy with acceptance limited to , while the NA49 measurement in the channel was limited to because of statistics. Both experiments observed an enhancement of the yield with the size of the collision system. The absolute yields, however, disagree by a factor in full phase space Rohrich:2001qi . A recent NA50 analysis of a new sample confirmed previous findings JOU08-Phi . The NA49 and NA50 results disagree also on the parameters extracted from the transverse mass spectra fitted with the thermal ansatz. The NA49 values are consistently larger and show a stronger centrality dependence than those measured by NA50. While this could be partly due to the radial expansion, which flattens the distributions at low , the effect is too large to be explained by radial flow alone.
Naively, kaon absorption or rescattering could prevent the reconstruction of in-matter decays, in particular at low transverse momentum, while the mesons decaying in the lepton channel would not be affected. This would lead to reduced yields and enhanced in the channel as compared to the channel. Meson modification in the medium could also lead to differences in the two channels, as mentioned above. The difference between NA49 and NA50, however, is larger than predicted by models including all these effects Pal:2002aw ; Shuryak:1999zh ; Johnson:1999fv ; Santini:2006cm ; Holt:2004tp . The discrepancies in absolute yields and became known as the puzzle.
Production of in central Pb-Pb collisions was recently studied also by CERES Adamova:2005jr both in the kaon and dielectron channels. The measured and yield are compatible with the NA49 results. However, due to the large uncertainty in the dielectron channel, the authors could not rule out completely a possible difference in the two channels, though significantly smaller than the NA49/NA50 difference: the maximum possible enhancement in the leptonic over hadronic channel was estimated to be 1.6 at 95% confidence level.
In this paper we report on new measurements in the muon channel done by the NA60 collaboration in In-In collisions at 158 AGeV incident beam energy, which can help to clarify production in nuclear collisions. Transverse momentum and yields have been studied as a function of centrality. Transverse momentum spectra, measured in the range , and yields are compared to previous results, providing further insight on the puzzle. The mass and width of the are studied as a function of centrality and , in order to search for possible in-medium effects. The results are compared to previous measurements and existing theoretical predictions for In-In collisions. In addition, the rapidity and the decay angular distributions in three reference frames (Collins-Soper, Gottfried-Jackson and the helicity frame) are also measured. In elementary collisions, the decay angular distributions can convey information on the production mechanism Ellis:1994ww . No measurements exist in p-p, while the ACCMOR collaboration performed measurements of the polarization in pion, proton and kaon - Be interactions Dijkstra:1986my ; Dijkstra:1986na . A small but significant transverse polarization was reported at low in the Gottfired-Jackson frame, which was related to the parton fusion model to estimate the average mass of the fusing partons. More recently, NA60 measured the angular distributions in In-In collisions, integrated in centrality and for , for the excess dimuons below 1 GeV (dominated by ) and the vector mesons and Arnaldi:2008gp . The reported absence of any anisotropy indicates the completely random orientation of the interacting hadrons in 3 dimensions as expected in the case of a thermalized medium. In this paper we extend these results by performing the study as a function of centrality and .
2 The NA60 apparatus
In this section the detectors of the NA60 apparatus used in the analysis are briefly described. A more detailed description can be found in Ref. Usai:2005zh .
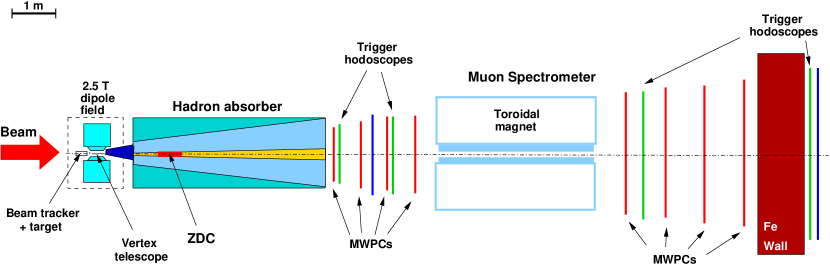
The 17-m-long muon spectrometer, previously used by the NA38 and NA50 experiments Abreu:1997ji , is complemented by new silicon detectors in the vertex region. The experimental apparatus is shown in Fig. 1. The muon spectrometer is composed of 8 multi-wire proportional chambers and 4 scintillator trigger hodoscopes, divided into a “forward” and a “backward” telescope by the 5-m-long ACM (Air Core Magnet) toroidal magnet. A 120 cm thick iron wall, located just before the last trigger hodoscope and after the tracking chambers, ensures that only muons can trigger the apparatus, without degradation of the tracking accuracy. The angular acceptance is mrad; the rapidity coverage for the is .
A 12 hadron absorber, mostly made of graphite, is placed in front of the tracking system of the muon spectrometer, as close as possible to the target to minimize the fraction of hadrons that decay into muons. The identification provided by this “muon filter” leads to a very selective trigger, enabling the experiment to run at very high luminosities. However, the material in the hadron absorber also degrades the kinematics of the muons, because of energy loss fluctuations and multiple scattering. This affects in particular the angular resolution, which is mrad for typical muons from decays.
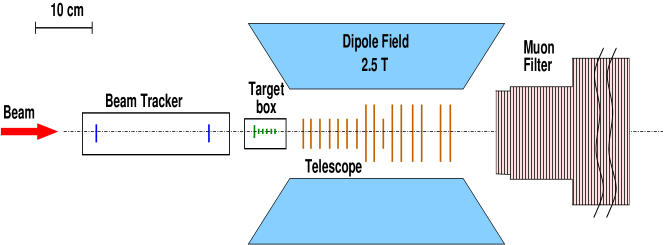
The layout of the vertex region is shown schematically in Fig. 2. Downstream of the target and before the hadron absorber, a silicon tracking telescope Banicz:2004mf embedded inside a 2.5 T magnetic dipole field measures the charged tracks produced in the interaction. The muons in the vertex region are then identified by matching them to the tracks reconstructed in the muon spectrometer. As described in the next section, this significantly improves the performance of the detector. The telescope used during the indium run consisted of 16 independent detector planes, providing 11 tracking points, arranged along the beam axis over a length of cm, starting at cm from the target centre. The telescope covers the angular acceptance of the muon spectrometer, with the first planes smaller than the last ones. Each plane consists of several single-chip pixel detector assemblies, 96 in total, which are mounted on a planar ceramic support. The assemblies are made of radiation tolerant, m thick ALICE1LHCb pixel readout chips Wyllie:1999uv , bump-bonded to m thick p-on-n silicon pixel sensors, with m2 pixels. Each of the single chip assemblies is a matrix of 32 columns and 256 rows. They have been shown to remain fully functional up to a radiation dose of 12 Mrad vanHunen:2001kc . The detector coped well with the radiation level of 1 Mrad per week, reached in the cells around the beam axis of the first planes in the NA60 environment Keil:2005zq . The telescope tracks all charged particles produced in the collision, thus providing an estimate of the collision centrality.
Incoming ions are tracked by a silicon microstrip beam tracker, composed of two stations placed 20 cm apart (30 cm and 10 cm upstream of the target). The 400 thick sensors have 24 strips of 50 m pitch, allowing to infer the transverse coordinates of the interaction point, at the target, with a resolution of 20 m Rosinsky:2003dd . They are operated at cryogenic temperatures (130 K), to remain sensitive to the beam ions even after collecting considerable radiation doses Palmieri:1998zj . The “back planes” of the four sensors extend over a larger area and constitute a very good beam intensity counter.
Embedded inside the hadron absorber, a Zero Degree Calorimeter (ZDC) provides an alternative estimate of the collision centrality by measuring the energy carried by the projectile nucleons which have not taken part in the interaction (spectators) Arnaldi:1998fk ; colla . The ZDC and the beam tracker were used to measure the beam intensity in the absolute yield measurement (sec. 4.4).
3 Data sample and analysis procedure
During the 5-week-long run in 2003, 230 million muon pair (dimuon) triggers were recorded, with two different settings of the ACM magnet current (4000 A and 6500 A). The results presented in this paper refer to the 4000 A data sample, which amounts to of the total statistics, as the 6500 A setting suppresses the low mass acceptance and it is optimal for the study of the .
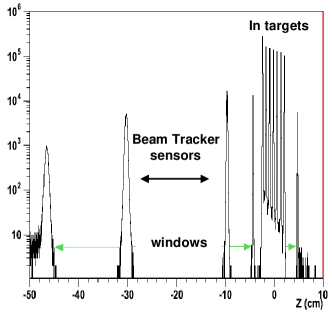
The data were collected with a indium beam, incident on 7 indium targets of 17 total interaction probability. The targets were placed in vacuum in order not to pollute the data sample with In-air interactions. The coordinate of the interaction vertex is shown in Fig. 3. The resolution on the position of the interaction vertex is in the transverse coordinates and in the longitudinal coordinate. The target identification is extremely good, with negligible background between different targets. Other elements present along the beam line are also clearly visible in the picture, like the target box windows and the beam tracker stations.
In the following subsections we illustrate briefly the most relevant aspects of the reconstruction and selection of events, background subraction and acceptance correction.
3.1 Event reconstruction and selection
As a first step, the muon tracks are reconstructed in the muon spectrometer. About half of the triggers are discarded either because it was not possible to reconstruct two muons or because at least one of the muons traversed the 4-m-long iron poles of the ACM. These tracks suffer from a very strong multiple scattering, which would severly degrade the momentum resolution. The muon tracks reconstructed in the muon spectrometer are then extrapolated back to the target region and matched to the tracks reconstructed in the vertex spectrometer. This is done comparing both their angles and momenta, requiring a matching less than 3. Once identified, the muons are refitted using the joint information of the muon and the vertex spectrometers. These tracks will be referred to as matched muons. Muon pairs of opposite charge are then selected. The matching technique drastically improves the signal-to-backround ratio and the dimuon mass resolution, which decreases from MeV (using only the information from the muon spectrometer) to MeV at the peak, independent of centrality Arnaldi:2008er .
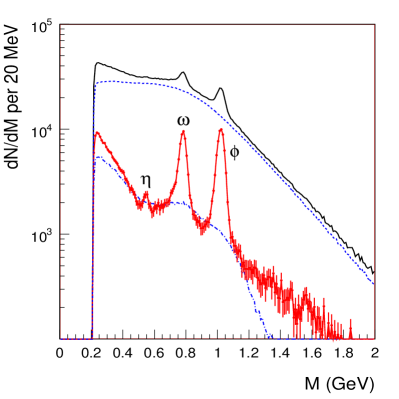
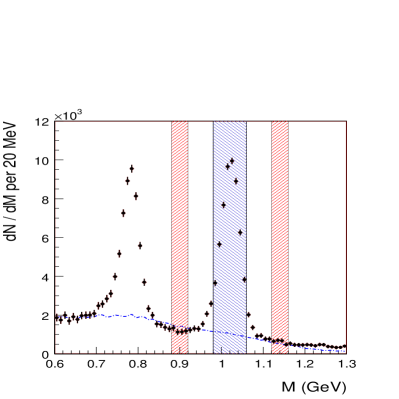
Events with more than one interaction vertex or with a (reconstructed) charged track multiplicity smaller than 4 are discarded Arnaldi:2008er . The matched dimuon mass spectrum is shown in the left panel of Fig. 4. The same picture shows also the two background sources: combinatorial and fake matches. These are discussed in detail in the next subsection. As it can be seen, the dominant background is the combinatorial background – the fake match background is almost one order of magnitude smaller. The and peaks are very well resolved and the peak is also visible. The right panel of Fig. 4 shows an expanded view of the and region after the subtraction of backgrounds. The sample consists of 70 000 events. The signal/background ratio, integrated over centrality, is below the peak, ranging from about 3 in peripheral events to about 1/5 in central ones.
To study production, events in a small mass window centred at the pole mass () are selected from the mass distribution after the combinatorial background subtraction. The continuum below the is accounted subtracting the events in two side mass windows ( and ), shown in the right panel of Fig. 4.
No specific cuts in transverse momentum, rapidity or Collins-Soper angle are applied. As already mentioned, the detector introduces an intrinsic rapidity cut at the mass.
3.2 Background subtraction
The dimuon sample is affected by two sources of background: the combinatorial background and the fake matches. The former is the contribution of uncorrelated muon pairs, mostly coming from the decay of pions and kaons, and is subtracted with an event mixing technique Arnaldi:2008er ; Shahoian:2005ys . The NA60 apparatus triggers also on like sign pairs ( and ), which, at SPS energies, contain only uncorrelated muons. Two muons from different like-sign events are randomly paired to build a dimuon sample which is uncorrelated by construction. The comparison of the real and mixed spectra for the like-sign pairs leads to an estimate of the accuracy of the background subtraction of over the full dimuon mass spectrum. The like sign sample is also used to determine the absolute normalization of the combinatorial background Arnaldi:2008er ; Shahoian:2005ys . The combinatorial background is shown as a dashed line in the left panel of Fig. 4.
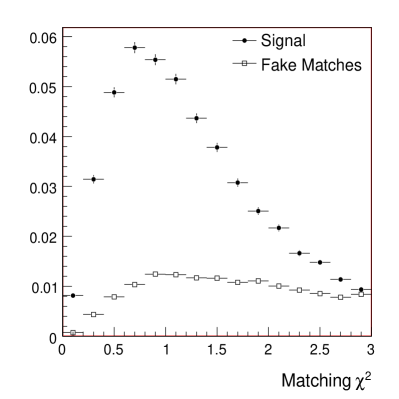
The background from fake track matches comes from the fact that, when the multiplicity is high, a muon track can be associated to more than one track in the vertex telescope with an acceptable matching , and the track with the lowest may not be the correct match. It can also happen that the correct track in the vertex telescope in absent altogether. The contribution of the fake matches can be estimated in two different ways. The first approach is an overlay Monte Carlo technique, where a Monte Carlo dimuon is reconstructed on top of a real event. Selecting the match with the smallest matching it is possible to determine the fraction of fake matches as a function of mass, transverse momentum, etc. The left panel of fig. 5 shows the matching for the correctly matched tracks and for the fake matches, as obtained with an overlay Monte Carlo simulation. The stricter the matching cut, the higher the signal to background ratio will be. However, a tight cut reduces significantly the statistics. The second method is based on the event mixing technique, which extracts the probability distributions of fake matches from real data alone. The basic idea is to match the tracks in the muon spectrometer from one event to the vertex tracks of a different event Arnaldi:2008er ; Shahoian:2005ys . All the matches obtained in this way are fake by construction. The two methods agree within 5%.
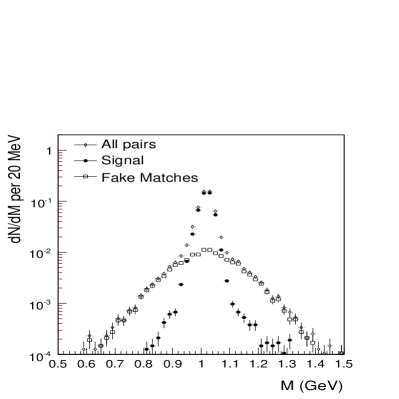
The right panel of Fig. 5 shows the Monte Carlo dimuon invariant mass for events when one or both muons are not correctly matched, for signal events and for all reconstructed pairs. This gives an idea how incorrect matching degrades the kinematics, resulting in a broadened peak with MeV. Notice however, that this is not the total fake matches background under the peak, because also other processes can contribute - continuum from open charm or tails from the region. The total fake matches distribution is shown in detail as a dashed line in the right panel of Fig. 4. This shows that the fake matches, in the specific case of the meson, can also be directly eliminated by the subtraction of the side windows, without the need to estimate them with the methods outlined above.
In the following, the analysis is repeated subtracting the fakes both with the event mixing technique and with the side windows.
3.3 Centrality selection
All results are studied as a function of the collision centrality. Events are divided into five centrality bins by using the charged tracks multiplicity as summarised in Table 1. The reconstructed minimum bias multiplicity distribution depends on the target because of acceptance, reconstruction efficiency and secondary particles contamination. The distributions in the seven targets are rescaled so that they overlap to that in the first target. The latter is then fitted with the multiplicity distribution obtained with a Glauber Monte Carlo simulation, assuming that the number of reconstructed tracks is proportional to the number of participants, with a smearing due to the resolution and inefficiencies of the detector. It is assumed that the effects due to acceptance, reconstruction efficiency and secondaries are embedded in the proportionality constant and smearing factor. The distributions and mean values of the number of participants and of the number of binary collisions , are obtained applying the same multiplicity cuts used in the real data to the simulated data. Alternatively, the real data can be corrected for acceptance, reconstruction efficiency and secondaries using a Monte Carlo simulation Floris:Phd ; Floris:2005ab . The number of measured tracks can be thus converted to the number of primary particles event by event, as a function of target and centrality. The distribution of primaries is then matched to the distribution of obtained by a Glauber Simulation. We find David:2005ab ; Arnaldi:2008er .
The difference on the mean and values for each bin obtained with the 2 methods is taken as an estimate of the systematic uncertainty and is found to be about 10% for the peripheral bins and 5% for the central bins.
| range | ||
|---|---|---|
| 15 | 14 | |
| 41 | 49 | |
| 78 | 110 | |
| 133 | 218 | |
| 177 | 317 |
3.4 Acceptance and reconstruction efficiency correction
After subtraction of the combinatorial background, the physical continuum and the fake tracks, the data are corrected for acceptance and reconstruction efficiency.
These are estimated with an overlay Monte Carlo simulation, using the real hit occupancy in the detector superimposed to Monte Carlo muon pairs. The same cuts used for the real data were applied to the simulated data. An overall 95% efficiency was assumed for the pixel detector. The input sources’ kinematics are generated using the Genesis event generator genesis , tracked through the apparatus using GEANT 3.21 and reconstructed using the NA60 analysis framework.
The study of the differential spectra would require a multi dimensional acceptance correction in rapidity, transverse momentum and Collins-Soper angle. Since the low populated bins in the phase space corners can introduce large errors, a fiducial cut should be applied, at the cost of reducing the effective statistics. To avoid this loss, a one dimensional correction is applied to each kinematic variable under study, integrating over the remaining ones. This requires a careful tuning of the Monte Carlo input kinematics which was adjusted with an iterative procedure to the measured distributions for each of the five centrality bins. To validate this procedure, the full analysis chain (event selection, reconstruction, acceptance correction, fitting) is applied to Monte Carlo events. It is verified that the corrected kinematic distributions and the estimated parameters are consistent with those used as input in the Monte Carlo.
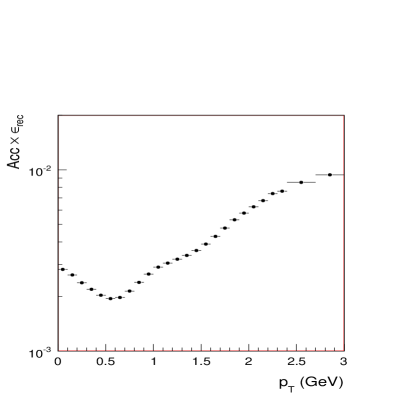
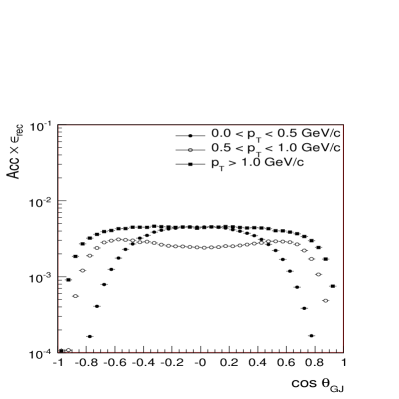
The acceptance times reconstruction efficiency for the as a function of is shown in Fig. 6. The apparatus has a good acceptance down to zero , due to the additional dipole field in the vertex region. Indeed, low mass and low dimuons, which would not be accepted by the muon spectrometer, are bent into the acceptance by the vertex dipole magnet, as opposed to NA50, which used the same muon spectrometer, but had no acceptance for . Further details on the rapidity and angular distribution acceptance will be given in the specific subsections on the results.
3.5 Systematic effects
The main sources of systematic error are the uncertainties on the input parameters of the Monte Carlo simulation (which reflect on an uncertainty in the acceptance) and on the estimate of the physical background below the . The former is estimated by changing the values of the parameters in the input Monte Carlo within of the measured value. The latter, by varying the side windows offset (from 50 MeV to 70 MeV) and width (from 30 MeV to 50 MeV). The contributions from these two factors are added in quadrature. Uncertainties in the combinatorial background and in the fake matches subtraction play a small role here, as the peak is very well resolved.
Several consistency checks were performed to test for the presence of hidden systematic effects Barlow : the matching cut was varied between 2 and 3, the kinematic cuts and were applied, the analysis was repeated independently in the 4 ACM/PT7 fields’ combinations, a 2-dimensional acceptance correction (vs. and ) was used and the different methods for fake subtraction were implemented. Most of those checks did not lead to significantly different results, with the exception of the matching cut variation. This leads to a small but not negligible difference which is added in quadrature to the systematic error. This difference is most likely due to the uncertainty in the energy loss compensation or to a small residual misalignment in the pixel telescope planes.
The results on the yield, mass and width are affected by further sources of systematics, due to the parameters needed for their computation. Details are given in sec. 4.4 and in sec. 4.6. The number of participants estimated with the Glauber model is affected by a 10% uncertainty in the peripheral bins, which decreases to in the most central, as explained in sec. 3.3.
4 Results
4.1 Rapidity
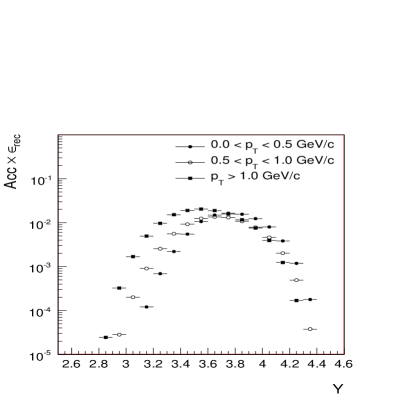
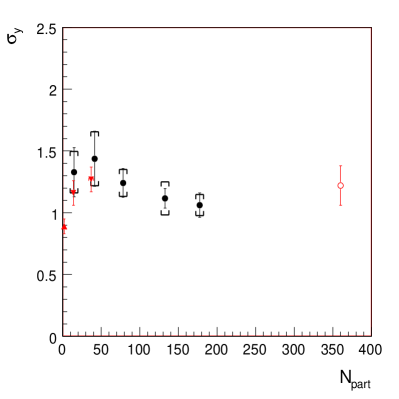
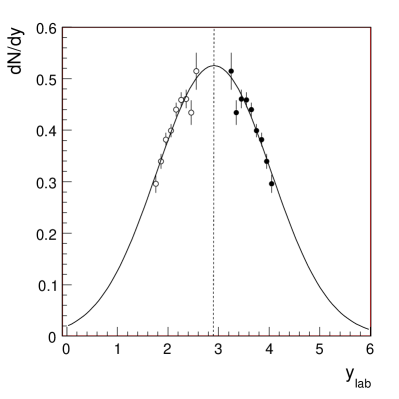
The rapidity acceptance for , and GeV is shown in Fig. 7. The apparatus has acceptance in the interval 3-4.2 depending on the target. There is a small correlation such that low tends to select larger . The rapidity is studied as a function of centrality and the width estimated with a gaussian fit in the range . The midrapidity value is fixed to 2.91. The width as a function of centrality is shown in Fig. 8 (left panel) and within the errors one can deduce either a constant or a slightly decreasing trend. The rapidity distribution integrated in centrality is shown in Fig. 8 (right panel). The resulting width is . This is in agreement with previous NA49 measurements in other collision systems at the same energy Alt:2004wc ; Afanasev:2000uu , as shown in Table 2.
| Experiment | System | |
|---|---|---|
| NA49 | p-p | |
| NA49 | C-C | |
| NA49 | Si-Si | |
| NA60 | In-In | |
| NA49 | Pb-Pb |
4.2 Angular distributions
In general, the angular distribution of the decay muons in the meson rest frame can be related to the elements of the spin density matrix.
In this paper the inclusive distributions are studied as a function of transverse momentum and centrality. The polar angle is the angle between the and the axis as measured in the following three widely used reference frames. In the helicity frame, the axis is defined as the direction of flight of the meson in the target-projectile rest frame. In the Gottfried-Jackson frame (GJ), the axis is defined as the projectile direction in the rest frame Gottfried:1964nx . Finally, in the Collins-Soper frame (CS) the axis is given by the bisector of the projectile and the negative target direction in the rest frame Collins:1977iv .
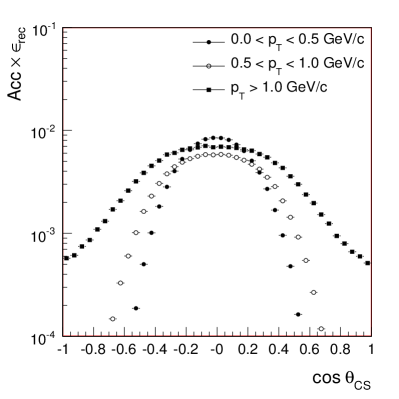
In all the three frames, the acceptance as a function of has a strong dependence on transverse momentum. In particular, the apparatus has zero acceptance for high and low . The acceptance vs for the windows , and GeV, is shown in Fig. 9 for the CS and GJ frames. The most critical situation occurs for the Collins-Soper angle, while the helicity frame is similar to the GJ frame.
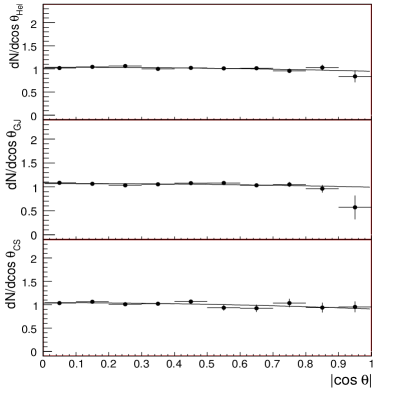
The distribution is fitted with the function where the parameter is related to the degree of polarization. The spectra, integrated in centrality and , are shown in the left panel of Fig. 10. The polarizations obtained from the fits are zero within errors in all cases: , , .
The polarization is then studied differentially in the three windows , and GeV, without centrality selection. No significant deviations from the integrated values are found.
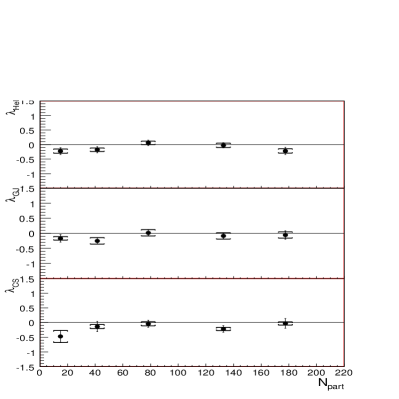
The results as a function of centrality and integrated in are shown in the right panels of Fig. 10. The polarization is compatible with zero in the helicity and Gottfried-Jackson frames, independent of centrality. In the Collins-Soper frame there is a hint for a negative polarization in the most peripheral bin. However, this is within compatible with zero and then consistent with the absence of any effect as seen in the other frames.
These results as a function of and centrality are consistent with the results integrated in centrality with reported in a previous analysis by NA60 Arnaldi:2008gp . They show the absence of polarization, supporting the fact that particles are produced from a thermalized medium. The absence of polarization extends down to peripheral events, suggesting that it could be zero also in elementary collisions at this energy.
4.3 Transverse momentum
| (MeV) | (MeV) | (MeV) | ||
|---|---|---|---|---|
| GeV | GeV | GeV | ||
| 15 | 24 | |||
| 41 | ||||
| 78 | 78 | |||
| 133 | 133 | |||
| 177 | 177 |
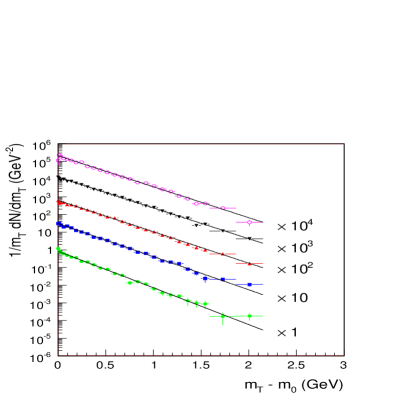
The acceptance-and-efficiency corrected transverse mass distributions are shown in the left panel of Fig. 11 for the different collision centralities, normalized in absolute terms.
The transverse momenta are first fitted in the range with the thermal ansatz:
| (1) |
The effective temperature as a function of the number of participants is depicted in the right panel Fig. 11. In general one can notice that the shows an initial rise followed by a saturation in the most central bins.
The exponential form assumes thermal emission from a static source. In heavy ion collisions, this is not correct due to the presence of radial flow, but eq. (1) was nevertheless used by several experiments to fit the data. Since the distributions are not purely exponential, The extracted from an exponential fit will depend in general on the fitted range. It can be shown that, at first order, the value at low is given by , where is the temperature at freeze-out, is the particle mass and is the average transverse velocity of the expanding source Heinz:2004qz . At high , on the other hand, the extracted from the exponential fit is approximated by Heinz:2004qz . Thus, what is measured is a dependent effective temperature, larger than the freeze-out temperature because of the radial flow.
The influence of radial flow is investigated by repeating the fits in two sub-ranges (low ) and (high ), which also correspond to the experimental windows covered by the NA49 and NA50 experiments, respectively. Since the statistics in the peripheral data at high is limited, the two most peripheral bins are integrated for the fit in the high range. The numerical values of as a function of centrality and of the different fit ranges are summarised in Tab. 3. An increase of the average can be noticed when the fit is restricted to the low range, while a flatter trend is observed from the fit in the high range. The difference between the effective temperatures obtained in the two fit ranges is around 10 MeV (average over the three most central bins). This pattern indicates the presence of radial flow but it is rather small, as expected from the small coupling of the to the “pion wind”Teaney:2001av ; Damjanovic:2008ta .
Further quantitative insight has been gained studying the spectra in the framework of the blast wave model Schnedermann:1993ws :
| (2) |
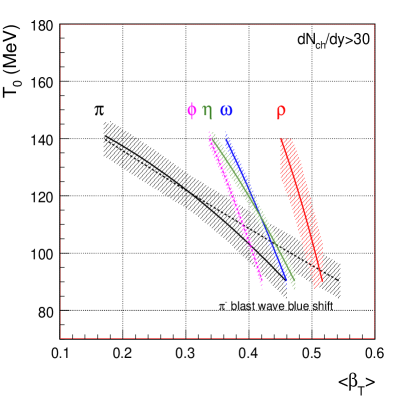
where and a linear velocity profile was assumed: . The slopes of the spectra define lines in the plane. is varied in the window 90-140 MeV. Transverse momentum distributions are then generated using eq. (2), with values tuned in order to reproduce the observed values. Fig. 12 shows the results for the and also for the negative charged hadrons (essentially pions), , and Damjanovic:2008ta . The study is performed for in order to exclude the rise in the low region seen in the excess spectra Arnaldi:2007ru . In addition, to perform a comparison with meaningful statistical accuracy with the other particles, data were integrated in centrality, excluding the most peripheral events. A clear hierarchy in the freeze out parameters, as a consequence of the particle coupling to the medium is visible. The is the least coupled particle, while the , being continuously produced in the medium via annihilation is maximally coupled. The freeze-out component of the receives the strongest radial flow boost, with a MeV, 50 MeV above the Damjanovic:2008ta ; Arnaldi:2007ru .
4.4 Yield
The average number of mesons per interaction is evaluated using the as a reference process. Once corrected for anomalous and nuclear absorption, scales with the number of binary collisions and can be written as
| (3) |
Here nb is the cross section in nucleon-nucleon collisions multiplied for the branching ratio. It was derived by the systematic study of production in pA collisions performed at 400 and 450 GeV, rescaling to 158 GeV and extrapolating to full phase space goncalo . The estimated nucleon-nucleon inelastic cross section at GeV is mb Amsler:2008zz .
can be evaluated from the experimental ratio:
| (4) |
where is the number of mesons observed in a given centrality bin, are the acceptance and reconstruction efficiency, is the branching ratio and incorporates the nuclear and anomalous absorption factors. The same centrality bins, selected using charged particle multiplicity as described in sec. 3.3, were used for both the and the . Invoking lepton universality, the value measured in the is used for the branching ratio, since it is known with better precision Amsler:2008zz . The nuclear absorption was accurately determined by several measurements in pA collisions at 400 and 450 GeV goncalo . The anomalous absorption was determined from the analysis of the same In-In data sample Arnaldi:2007zz . The overall correction factor comes from the product of the nuclear and anomalous absorption. One has to notice that recent preliminary p-A results from NA60 showed the nuclear absorption at 158 GeV is larger than previously assumed enrico-qm09 . However, since the anomalous absorption is defined relative to the nuclear one, the overall correction remains largely insensitive to relative changes of these two factors. The systematic uncertainty arising from the anomalous and nuclear absorption is 11% Arnaldi:2007zz . This is the dominating source of systematic uncertainty in the analysis of the yield.
By multiplying the ratio in eq. (4) by eq.(3), one obtains as a function of the number of binary collisions . The values of and of for each centrality bin are obtained by fitting the multiplicity distribution with a Glauber model, as described in sec. 3.3 and summarised in Tab. 1.
Processes having different scaling properties as a function of centrality, such as the and the , in general give rise to different multiplicity distributions and this could introduce a bias when using wide centrality bins. The analysis was repeated with a much finer centrality binning and this potential bias was found to be negligible.
The multiplicity integrated in centrality is .
| 14 | 0.172 | 0.007 | 0.021 |
| 41 | 0.690 | 0.025 | 0.074 |
| 78 | 1.48 | 0.04 | 0.15 |
| 132 | 3.10 | 0.08 | 0.2 |
| 177 | 5.0 | 0.17 | 0.2 |
The robustness of the measurement is checked repeating the analysis integrated in centrality, with a different method having largely independent systematics. The cross section is determined with the formula:
| (5) |
where is the integrated luminosity, is the event selection efficiency, is the trigger efficiency, is the efficiency related to the DAQ live-time. The integrated luminosity is given by , where is the number of incident ions as measured by the ZDC and Beam Tracker detectors, while is the effective number of indium atoms in the target system Lourenco:2007 . The latter is affected by a systematic uncertainty of , because the transverse profile of the beam is wider than the targets (except for the first one which had a radius of 0.6 cm). The trigger efficiency was determined with special runs taken without the dimuon trigger. It is 81% and is affected by a 6% systematic error.
The average yield is then obtained dividing the cross section by the fraction of total In-In inelastic cross section, corresponding to the cut , as estimated with the Glauber Monte Carlo (see sec. 3.3). The total inelastic cross section calculated with the Glauber model is b, and has a 10% uncertainty, mostly due to the uncertainties on the nuclear density profiles. The centrality integrated cross section is b. This leads to , in agreement with the result based on the standard method, taking into account only the unrelated systematic errors in the two approaches.
The results as a function of centrality, obtained by taking the average of the two methods weighted by the systematic error, are summarised in Tab. 4. The ratio is seen to increase with the collision centrality indicating the presence of an enhancement as in other collision systems.
4.5 Discussion of the results on and yield
As mentioned in the introduction, the discrepancies in absolute yields and values observed by NA49 and NA50 became historically known as the puzzle Shuryak:1999zh ; Rohrich:2001qi . To explain those differences, it was originally proposed that in-medium effects and kaon absorption or rescattering could prevent the reconstruction of in-matter decays, in particular at low transverse momentum, while the mesons decaying in the lepton channel would not be affected. This would lead to reduced yields and enhanced values in the channel as compared to the channel. In this section, all the measurements performed at the SPS, including the new one in In-In, are compared and the hypothesis of the physical mechanism described above is critically reviewed, considering the facts in favour of and against it.
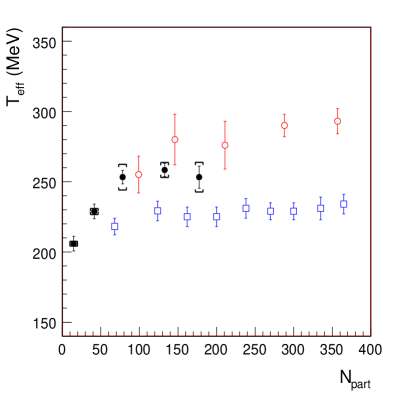
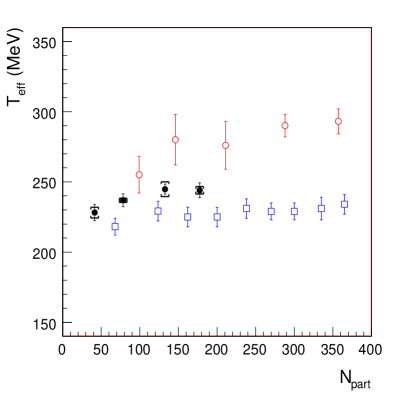
Fig. 13 shows the NA60 obtained performing the fits in the windows corresponding to the coverage of NA49 (left) and NA50 (right). As mentioned in sec. 4.3, the difference of the temperature in the two windows in In-In is around 10 MeV, indicating a modest radial flow effect. Although a similar pattern is observed in Pb-Pb collisions – a stronger increase at low (NA49) and a flattening at high (NA50) – the maximum difference is, for the most central Pb-Pb collisions, about 70 MeV. This difference seems not to be consistent with the variation implied by radial flow as observed in the NA60 data.
In the common fit range, the NA60 values in In-In are MeV larger than those measured by NA50, while there is a seeming agreement between NA60 and NA49 in the common fit range. However, the NA49 errors are large in this region and, in addition, a direct comparison of the values of between NA60 and the Pb-Pb experiments for the same is not straightforward, due to the different geometry of the collision (the relative weight of the thin nuclear halo is higher in peripheral Pb-Pb collision than in a smaller system).
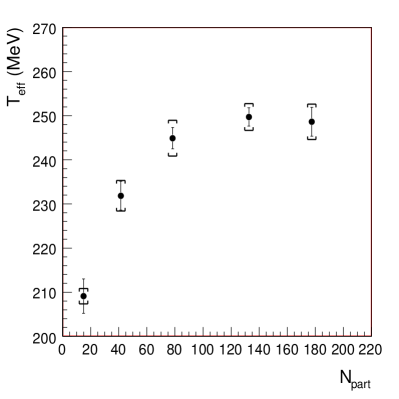
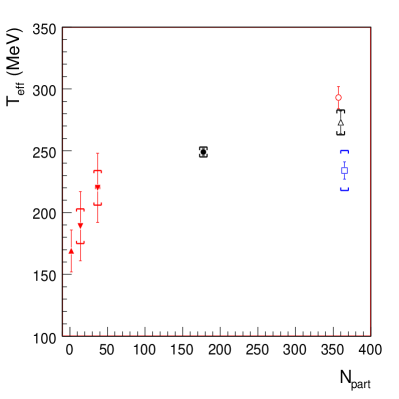
The temperature variation in different collision systems, when restricting to central collisions only, is shown in Fig. 14. This picture includes also the NA49 results for C-C, Si-Si and the CERES result in the kaon channel for central Pb-Pb (the dielectron measurement has a very large error). The NA49 and CERES Pb-Pb points are above the In-In point by MeV. Part of this difference can be related to radial flow, since in Pb-Pb a larger lifetime of the fireball would lead to a larger effect in central collisions. However, the measured for central Pb-Pb collisions is MeV, very close to that of the proton Alt:2006dk . The blast-wave analysis of the NA60 data, on the other hand, shows a clear hierarchy in the freeze-out, with the having a maximal flow due to its coupling to pions and the being the least coupled meson (Fig. 12). The temperature of the freeze-out component of the in In-In reaches 300 MeV or more, 50 MeV above the . One would therefore expect an even larger difference in Pb-Pb collisions between the of the and of the proton, which is strongly coupled to the pions via the resonance and with a mass larger than the . This suggests that the high seen by NA49 and CERES in the kaon channel cannot be ascribed entirely to radial flow.
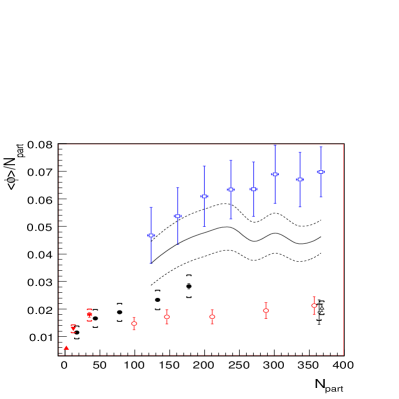
The enhancement in In-In is compared to previous SPS measurements Friese:2002re ; Alt:2004wc ; Alessandro:2003gy ; Adamova:2005jr in Fig. 15.
An unambiguous comparison to the NA50 result in full phase space is not possible, due to lack of consensus on the value of the parameter in Pb-Pb collisions, but in general the NA50 enhancement is considerably higher than what is seen in In-In at any centrality. An extrapolation to full with the NA50 values ( MeV independent of centrality) leads to values higher by a factor 2 or more with respect to In-In. Even extrapolating with the NA49 values ( MeV) would lead to values significantly higher (as shown by the continuous line in Fig. 15, the dashed lines represent the propagated uncertainty on these values).
The NA49 measurements111NA49 has characterized centrality of the collision using 2 quantities: the “number of wounded nucleons” and the “number of participants”. The one directly comparable to our is the number of wounded nucleons. The values for the different Pb-Pb bins are taken from Ref. Alt:2006dk . show that the breaks scaling and that , for central collisions as a function of the colliding system, already saturates for Si-Si. The enhancement in In-In is closer to NA49 than NA50, but it is not in agreement either. The two In-In most peripheral points are in agreement with C-C and Si-Si. However, for increasing centrality there is no saturation in In-In, while the NA49 Pb-Pb points show a flatter trend, which remains consistently smaller at any centrality. One could ask whether the increase of the yield ratio NA60/NA49 as a function of centrality could be ascribed to a suppression mechanism present in Pb-Pb that tends to decrease the overall enhancement. Restricting the comparison among In-In and Pb-Pb central collisions, the dimuon NA60 measurement remains larger than the kaon Pb-Pb points.
Summarizing, the large NA49/NA50 difference in central collisions for (70 MeV) and the yield (a factor 4), was hardly accounted for by theoretical models. A difference, though smaller, is also present in central collisions in and yield, when considering the NA60 muon measurement. This difference remains difficult to explain and hints for the presence of a physical effect. Whether this is present also in In-In, or peculiar only to Pb-Pb, would require the comparison to in In-In. Preliminary NA60 results of suggest that there are no differences within the errors among the two channels in In-In adf-qm09 .
One has to notice that the CERES dielectron and kaon points for central Pb-Pb are in agreement and in addition, both the NA50 and yield do not agree with NA60 either. Thus, at the moment it is not possible to include into a coherent picture all the measurements performed so far in the different collision systems.
4.6 Mass and width
As mentioned in the introduction, the spectral function of the could be modified in the medium, resulting in changes of its mass and width. The lifetime of the is fm, larger than the estimated fireball lifetime ( fm). Any medium modified component would therefore sit under a large unmodified peak produced after freeze-out. In order to distinguish a possible in-medium component from instrumental effects, a careful tuning of the Monte Carlo simulation is required. This was not strictly necessary in previous analysis of the low mass region excess Damjanovic:2008ta ; Damjanovic:2006 , as this structure, mostly due to , represents a large fraction of the total yield (the lifetime of the is fm).
Uncertainties in the detectors alignment, materials, energy loss compensation and precision of the magnetic field maps lead to residual differences between the Monte Carlo and the real data. These were compensated by fine-tuning the Monte Carlo against the peripheral data, where no in-medium effects are expected. The tuning was performed considering the whole mass spectrum below 1 GeV and required a global mass shift and a change in the mass resolution (previous NA60 analyses only included the mass shift correction). The uncertainties in this tuning are the main source of systematic error for the results discussed in this section.
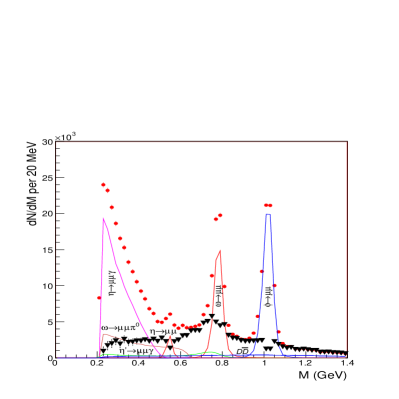
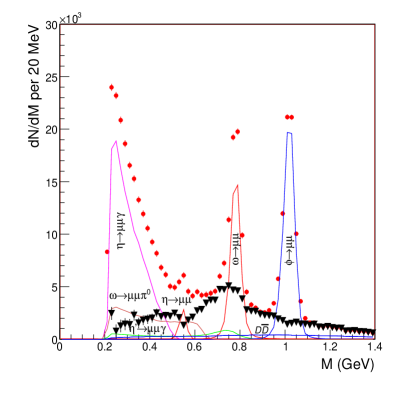
In order to look for an in-medium component around the peak, the excess was isolated using the same subtraction procedure already extensively used for the low mass region Damjanovic:2006 . The , and Dalitz were subtracted from the total data using the Monte Carlo shapes and fixing the yield using solely local criteria; the Dalitz and the two body were then subtracted by binding them to these processes via branching ratios. The quality of the subtraction can be judged in Fig. 16 which shows, for data integrated over centrality, the excess before and after the fine tuning. While the tuning is essentially constrained by the narrow peak, it improves the subtraction over the whole mass spectrum: the evident artifacts visible in the left panel around all the narrow resonances (, and ) disappear after the tuning. The continuum left after the subtraction under the peak is smooth: no evidence for a medium modified can be seen in this figure. Indeed, an in-medium broadened component would manifest itself as broader tails extending to the sides. In this case, the subtraction of the vacuum component should not leave a smooth continuum, but rather a broad structure or a dip, which is not observed.
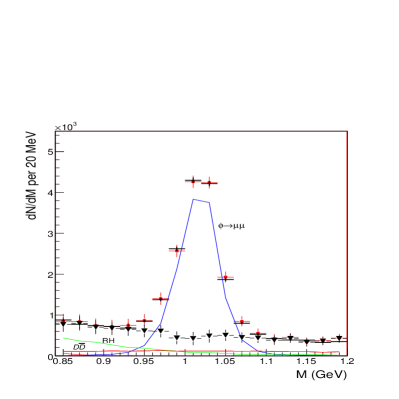
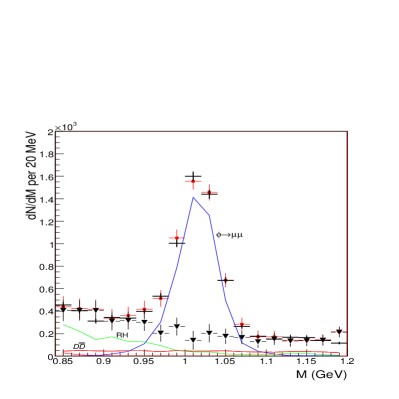
As mentioned in the introduction, the KEK-PS E325 experiment reported evidence for a large excess to the left of peak in p-Cu at 12 GeV for , corresponding to a produced moving very slowly inside the heavy target nucleus at rest. This situation is not directly comparable to the high energy regime discussed in this paper. Here, a fireball is produced with particle momenta boosted in the forward direction, therefore the relevant variable to select mesons mostly sensing the medium is transverse momentum. Moreover, in a high energy heavy ion collision, as opposed to p-A, the can be produced not only at chemical freeze-out, but also in the hot hadronic medium via kaon reactions. Fig. 17 shows the region around the mass peak for different and centrality selections: the left panel shows the two most central bins and for GeV, while the right panel shows the data integrated in centrality for GeV. The continuum from the subtraction is smooth also in this case. Furthermore, a fit was performed using the Monte Carlo shapes for the different processes. The continuum was described with the model of Ref.vanHees:2007th , which includes, besides the in-medium , multi-pion and partonic processes relevant in this mass region. The model of Ref. Ruppert:2007cr , having different weights for the multi-pion and partonic processes, does not change the conclusions, since it produces a similar yield below the peak. The is in all cases. There is no evidence of any mass shift or broadening, even at high centrality and low , where one would expect to observe the strongest in-medium effects.
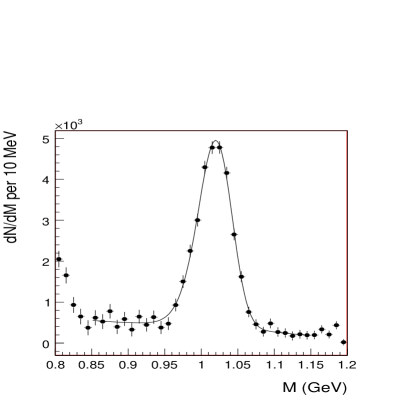
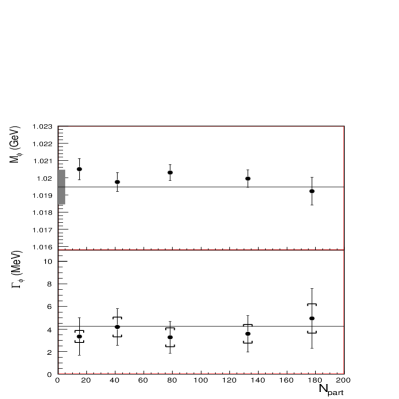
In order to estimate quantitatively the pole mass and total width of the peak, data were fitted with the convolution of a relativistic Breit-Wigner and of a function parametrizing the detector response, on top of a linear background. In a first step, the parameters of the detector response were adjusted on the Monte Carlo simulation. The data are then fitted leaving the mass and width of the Breit-Wigner as free parameters. The quality of the fit is very good, as shown in the left panel of Fig. 18, corresponding to the semi-central bin, . The results the mass and width as a function of centrality are shown in the right panel of Fig. 18. The systematic error was estimated changing the fit range, the background function and propagating the uncertainties in the Monte Carlo tuning. The mass and width are compatible with the PDG values and independent of centrality, although our sensitivity on the width is limited by the mass resolution, which is much larger than the natural width (this is reflected in the large statistical error in the right panel of Fig. 18).
While the data can be described by a vacuum , we set an upper limit on a modified component using the only existing prediction for in-medium production of in 158 AGeV In-In collisions vanHees:2007th . This corresponds to an in-medium spectral function folded over the phase-space fireball evolution up to freeze-out and appears significantly broadened ( MeV), so that the data should have sufficient sensitivity - in terms of mass resolution - to discriminate it. The region around the peak was fitted adding an in-medium component to the unmodified one. In the centrality integrated data, the fraction in-medium/vacuum is compatible with zero within one sigma with an upper limit of at 95% confidence level. In the two most central bins the fraction remains compatible with zero within one sigma and the upper limit increases to , due the larger statistical uncertainty. The fraction predicted by Ref. vanHees:2007th for semi-central data (roughly equivalent to centrality integrated data) is %. The limitation in statistics prevents us from setting a meaningful upper limit at high centrality and low .
5 Conclusions and outlook
In this paper a complete characterization of production in In-In collisions has been provided by measuring the differential spectra, yield, mass and width.
The rapidity distribution width does not depend on centrality within errors, and is found to be compatible with previous SPS measurements. The decay angle distributions show no evidence for polarization in any of the reference frames used, independent of centrality and . This confirms the lack of anisotropy previously reported by NA60. This is a necessary though not sufficient condition for particle production from a thermalized medium. Indeed, the centrality dependence suggest that the polarization is zero or very close to zero also in peripheral collisions, close to the limit of p-p like interactions.
The study of the transverse momentum distributions shows a small dependence of the parameter on the window considered, to be ascribed presumably to radial flow. A blast wave analysis shows a clear hierarchy of the freeze-out, with the being the least coupled particle to the medium. The difference between measured in Pb-Pb collisions by NA49 and NA50 is much larger and cannot be explained by the different windows explored. The value for most central collisions in In-In remains significantly lower than the kaon point in Pb-Pb measured by NA49 and CERES.
The yield measured by NA50 at high , when extrapolated to full , exceeds the NA60 data points for the same number of participants and seems to lie outside of the general systematics. The NA60 yield, on the other hand, remains consistently larger than the NA49 and CERES Pb-Pb measurement.
The new measurements in and yield, when compared to the kaon channel in Pb-Pb, suggest that there may be a physical effect leading to a difference in the two channels. Further clarification may come from the NA60 measurement of the channel in In-In collisions, which is currently in progress and will be reported in a forthcoming paper. At the moment, it is not possible to include all the existing SPS measurements in a coherent framework.
The mass and width were studied as a function of centrality and transverse momentum. No evidence for in-medium modifications was found. Our data were also compared to the only existing prediction for in-medium , produced in In-In collisions at 158 AGeV. The yield of such a component is compatible with zero, with an upper limit of about 8% for the centrality integrated data.
Acknowledgments
We acknowledge support from the BMBF (Heidelberg group) as well as from the C. Gulbenkian Foundation and the Swiss Fund Kidagan (YerPHI group).
References
- (1) J. Rafelski, B. Muller, Phys. Rev. Lett. 48, 1066 (1982)
- (2) A. Shor, Phys. Rev. Lett. 54, 1122 (1985)
- (3) F. Becattini, M. Gazdzicki, J. Sollfrank, Eur. Phys. J. C5, 143 (1998), doi:10.1007/s100520050256, hep-ph/9710529
- (4) A. Andronic, P. Braun-Munzinger, K. Redlich, et al., Phys. Lett. B571, 36 (2003)
- (5) F. Becattini, J. Manninen, M. Gazdzicki, Phys. Rev. C73, 044905 (2006)
- (6) F. Becattini, J. Manninen, J. Phys. G35, 104013 (2008)
- (7) B. I. Abelev, et al. (STAR), Phys. Lett. B673, 183 (2009), doi:10.1016/j.physletb.2009.02.037, 0810.4979
- (8) G. E. Brown, M. Rho, Phys. Rev. Lett. 66, 2720 (1991)
- (9) T. Hatsuda, S. H. Lee, Phys. Rev. C46, 34 (1992)
- (10) S. Pal, C. M. Ko, Z.-w. Lin, Nucl. Phys. A707, 525 (2002)
- (11) H. van Hees, R. Rapp, Nucl. Phys. A806, 339 (2008)
- (12) D. Cabrera, M. J. Vicente Vacas, Phys. Rev. C67, 045203 (2003)
- (13) E. Oset, A. Ramos, Nucl. Phys. A679, 616 (2001)
- (14) E. V. Shuryak, Nucl. Phys. A661, 119 (1999)
- (15) S. C. Johnson, B. V. Jacak, A. Drees, Eur. Phys. J. C18, 645 (2001)
- (16) E. Santini, G. Burau, A. Faessler, et al., Eur. Phys. J. A28, 187 (2006)
- (17) R. Muto, et al. (KEK-PS-E325), Phys. Rev. Lett. 98, 042501 (2007)
- (18) V. Friese (NA49), Nucl. Phys. A698, 487 (2002)
- (19) C. Alt, et al. (NA49), Phys. Rev. Lett. 94, 052301 (2005)
- (20) S. V. Afanasev, et al. (NA49), Phys. Lett. B491, 59 (2000)
- (21) B. Alessandro, et al. (NA50), Phys. Lett. B555, 147 (2003)
- (22) D. Rohrich, J. Phys. G27, 355 (2001)
- (23) D. Jouan, et al. (NA50), J. Phys.s G35, 104163+ (2008)
- (24) L. Holt, K. Haglin, J. Phys. G31, S245 (2005)
- (25) D. Adamova, et al. (CERES), Phys. Rev. Lett. 96, 152301 (2006)
- (26) J. R. Ellis, M. Karliner, D. E. Kharzeev, et al., Phys. Lett. B353, 319 (1995)
- (27) H. Dijkstra, et al. (ACCMOR), Z. Phys. C31, 375 (1986)
- (28) H. Dijkstra, et al. (ACCMOR), Z. Phys. C31, 391 (1986)
- (29) R. Arnaldi, et al. (NA60) (2008), submitted to Phys.Rev.Lett., nucl-ex/0812.3100
- (30) G. Usai, et al. (NA60), Eur. Phys. J. C43, 415 (2005)
- (31) M. C. Abreu, et al. (NA50), Phys. Lett. B410, 327 (1997), doi:10.1016/S0370-2693(97)00914-3
- (32) K. Banicz, et al., Nucl. Instrum. Meth. A539, 137 (2005)
- (33) K. Wyllie, et al. Prepared for 5th Workshop on Electronics for the LHC Experiments (LEB 99), Snowmass, Colorado, 20-24 Sep 1999, pp. 93-97
- (34) J. J. van Hunen, et al. (ALICE) 7th Workshop on Electronics for LHC Experiments, Stockholm, Sweden, 10 Sep 2001, CERN-ALI-2001-015
- (35) M. Keil, et al., Nucl. Instrum. Meth. A546, 448 (2005)
- (36) P. Rosinsky, et al., Nucl. Instrum. Meth. A511, 200 (2003)
- (37) V. Palmieri, K. Borer, S. Janos, et al., Nucl. Instrum. Meth. A413, 475 (1998)
- (38) R. Arnaldi, et al., Nucl. Instrum. Meth. A411, 1 (1998)
- (39) A. Colla, Study of charmonium production and suppression in Indium-Indium collisions at 158 GeV/nucleon, Ph.D. thesis, Università di Torino (2004)
- (40) R. Arnaldi, et al. (NA60), Eur. Phys. J. (2008), in press
- (41) R. Shahoian, et al. (NA60), Eur. Phys. J. C43, 209 (2005)
- (42) M. Floris, Charged Particle Multiplicity in Nucleus-Nucleus collisions at the CERN SPS, Ph.D. thesis, Università degli Studi di Cagliari, Cagliari, Italy (2005)
- (43) M. Floris, et al. (NA60), J. Phys. Conf. Ser. 5, 55 (2005)
- (44) A. David (2006), CERN-THESIS-2006-007
- (45) S. Damjanovich, A. De Falco, H. Whoeri, Genesis: A hadron decay cocktail generator for the study of low mass dilepton production (2005)
-
(46)
R. Barlow, in Advanced Statistical Techniques in Particle Physics
(2002), advanced Statistical Techniques in Particle Physics, Grey College,
Durham, 18 - 22 March 2002,
URL http://www.ippp.dur.ac.uk/old/Workshops/02/
statistics/proceedings//barlow.pdf - (47) K. Gottfried, J. D. Jackson, Nuovo Cim. 33, 309 (1964)
- (48) J. C. Collins, D. E. Soper, Phys. Rev. D16, 2219 (1977)
- (49) U. W. Heinz (2004), hep-ph/0407360
- (50) D. Teaney, J. Lauret, E. V. Shuryak (2001)
- (51) S. Damjanovic (NA60), J. Phys. G35, 104036 (2008)
- (52) E. Schnedermann, J. Sollfrank, U. W. Heinz, Phys. Rev. C48, 2462 (1993)
- (53) R. Arnaldi, et al. (NA60), Phys. Rev. Lett. 100, 022302 (2008)
- (54) G. Borges, J/psi and psi’ Production in p–A Collisions at 400 GeV and S–U interactions at 200 GeV/nucleon, Ph.D. thesis, Universidade Tecnica de Lisboa, Instituto Superior Tecnico (December 2005)
- (55) C. Amsler, et al. (Particle Data Group), Phys. Lett. B667, 1 (2008)
- (56) R. Arnaldi, et al. (NA60), Phys. Rev. Lett. 99, 132302 (2007)
- (57) E. Scomparin, et al. (NA60), in proceedings of the 21st International Conference on Ultra-Relativistic Nucleus-Nucleus Collisions (Quark Matter 2009) (2009)
-
(58)
C. Lourenço, Measuring absolute production cross sections from the
proton-nucleus data collected by NA60 (2007), NA60 Note 2007-1,
URL http://na60.cern.ch/www/experiment/notes/2007/
cc7.pdf - (59) C. Alt, et al. (NA49), Phys. Rev. C73, 044910 (2006)
- (60) A. De Falco, et al. (NA60), in proceedings of the 21st International Conference on Ultra-Relativistic Nucleus-Nucleus Collisions (Quark Matter 2009) (2009)
- (61) R. Arnaldi, et al., Phys. Rev. Lett. 96, 162302 (2006)
- (62) J. Ruppert, C. Gale, T. Renk, et al., Phys. Rev. Lett. 100, 162301 (2008)