To What Extent Iron-Pnictide New Superconductors Have Been Clarified:
A Progress Report
Abstract
In this review, the authors present a summary of experimental reports on newly discovered iron-based superconductors as they were known at the end of 2008. At the same time, this paper is intended to be useful for experimenters to know the current status of superconductors. The authors introduce experimental results that reveal basic physical properties in the normal and superconducting states. The similarities and differences between iron-pnictide superconductors and other unconventional superconductors are also discussed.
1 Introduction
The discovery of the iron-based layered superconductor LaFeAs(O1-xFx) reported by Kamihara et al. on 23rd February 2008 had a great impact to researchers in condensed-matter physics[1]. This is partly because the compound containing one of the most familiar ferromagnetic atom “” shows superconductivity at a relatively high temperature of 26 K in LaFeAs(O0.89F0.11). In addition, Takahashi et al. reported that the superconducting transition temperature of this compound increases to 43 K under a high pressure of 4GPa[2]. Soon after these discoveries, researchers reported that the of FeAs(O1-xFx) ( = Ce, Pr, Sm, Nd etc) jumps up to 50 K, which is the highest except for high- cuprates[3, 4, 5, 6]. After these discoveries, many researchers have been interested in these “iron-pnictide” superconductors, and some have been actually studying them and checking cond-mat every day in order to catch up with the progress in research on iron pnictides. The situation is very similar to that when the cuprate superconductor was discovered. Owing to such competitive research activities, new iron-pnictide superconductors with different crystal structures such as (Ba,K)Fe2As2[7], LiFeAs[8] and FeSe1-δ[9] have been discovered within a short period.
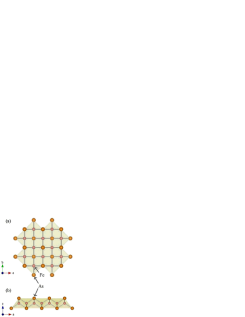
All iron-pnictide superconductors include a two-dimensional (2-D) Fe (Pn: pnictogen atom) layer with a tetragonal structure at room temperature, which is shown in Fig. 1. Therefore, their physical properties are considered to be highly two-dimensional, similarly to those of cuprate, ruthenate and cobaltate superconductors.
We will try to give a comprehensive review of existing experimental reports on iron-pnictide superconductors. The aim of this study is to review the physical properties of such superconductors in the normal and superconducting states. This article is principally concerned with experiments, and we have not attempted to produce a complete review of theoretical works on iron-pnictide superconductors.
The content of this article is as follows: First, we introduce the material variation and phase diagram of iron-pnictide superconductors and review the key experimental results in their normal and superconducting states, particularly for magnetic properties in the normal state and gap structures in the superconducting state. Theoretical models, which are considered to be promising for interpreting iron-pnictide superconductors, are also introduced. On the basis of these experimental results, we summarize their normal and superconducting properties.
2 Material Variation and Phase diagram
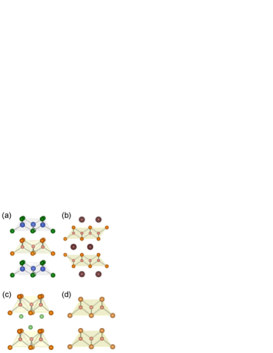
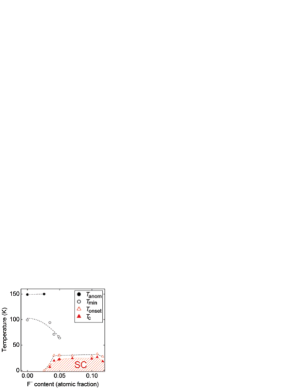
There are four crystal structures of iron-pnictide superconductors that have been reported so far. These are shown in Fig. 2. The first one is FeAsO with the ZrCuSiAs type structure (space group P4/nmm), which is shown in Fig. 2(a). This is called the “1111” structure in this article. It has been reported that approximately 300 O compounds (: rare earth, : late-transition metal, and : pnictogen) belong to this type of structure to date[10]. The O and FeAs layers are stacked along the -axis. The first discovered iron-pnictide superconductor LaFeAs(O1-xFx) has this structure, and various rare-earth elements such as Ce, Pr, and Nd can enter the site. Undoped FeAsO is non-superconducting and shows an antiferromagnetic transition at approximately 150 K. In some compounds, further magnetic anomalies originating from rare-earth moments occur at lower temperatures. Magnetic properties in the undoped “1111” structure will be discussed below. Superconductivity emerges when 3% oxygen is replaced by fluorine (FeAs(O1-xFx)) or when oxygen deficiency is introduced (FeAsO1-δ)[11]. Figure 3 shows the F-doping dependence of in LaFeAs(O1-xFx)[1], in which anomalies defined in resistivity are also plotted. After superconductivity appears, is nearly unchanged up to 0.14. This tendency of has been observed in other FeAs(O1-xFx) systems. The maximum of each FeAs(O1-xFx), and the F concentration giving the maximum are listed in Table I. The highest = 55 K was reported in SmFeAs(O1-xFx)[12]. Quite recently, superconductivity has also been observed in the “1111’-structure (Fe1-xCox)AsF ( = Ca and Sr) with electron doping. The maximum is 22 K ( = Ca with )[13] and 4 K ( = Sr with )[14], respectively.
| La | Ce | Pr | Nd | Sm | Gd | Tb | Dy | |
|---|---|---|---|---|---|---|---|---|
| [K] | 28 | 41 | 52 | 52 | 55 | 36 | 46 | 45 |
| 0.11 | 0.16 | 0.11 | 0.11 | 0.1 | 0.17 | 0.1 | 0.1 | |
| Ref. | [1] | [15] | [5] | [4] | [12] | [6] | [16] | [16] |
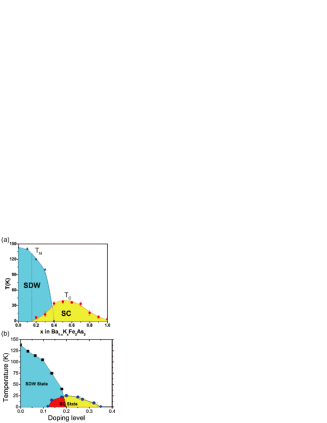
The second iron-pnictide family possesses the ThCr2Si2-type structure, which is shown in Fig. 2(b). This structure is abbreviated as “122”, and is well-known in “heavy-fermion (HF)” compounds, since the first discovered HF superconducting CeCu2Si2[17] and metamagnetic CeRu2Si2 have this structure. The (O2)2+ layer in FeAsO is replaced by a single divalent ion () layer, and thus the electron count is not altered. Fe2As2 becomes superconducting with hole doping, achieved through the partial substitution of the site with monovalent (()Fe2As2) ( = Ba, Sr, Ca, = K, Cs, Na)[18, 19]. Superconductivity also emerges by electron doping via partial substitution of cobalt for iron ((Fe1-xCox)2As2)[20]. The undoped parent “122” compounds show a similar antiferromagnetic ordering as the “1111” compounds. Phase diagrams of (Ba1-xKx)Fe2As2 and BaFe2-xCoxAs2 were developed from electric resistivity measurements, as shown in Figs. 4(a) and 4(b)[21, 22]. In these phase diagrams, the coexistence of antiferromagnetic ordering with superconductivity was observed in the “122” compounds. However, SR measurements clarified the phase separation into the superconducting and magnetic phases in (Ba1-xKx)Fe2As2[23] as well as in LaFeAs(O1-xFx)[24, 25] and Ca(Fe1-xCox)AsF[26]. It was suggested that the volumetric expansion of superconducting domains upon electron doping to the Fe2As2 layers might be understood by the formation of a “swiss-cheese” superconducting phase[27]. It was also reported that superconductivity is induced by pressure[28], as well as by partial substitution. From the resistivity measurements of SrFe2As2 under pressure, Kotegawa et al. reported that superconductivity with a sharp resistive transition appears, accompanied by the suppression of the antiferromagnetic state[29]. In contrast, the phase diagram in which covers has been reported from the pressure study of BaFe2As2[30]. The relationship between antiferromagnetism and pressure-induced superconductivity has been debated.
The third structure was reported in superconducting LiFeAs[8], called the “111” structure and is shown in Fig. 2 (c). LiFeAs crystallizes into the Cu2Sb-type tetragonal structure containing the FeAs layer with an average iron valence of like those for the “1111” or “122” parent compounds. Wang et al. reported that superconductivity was observed in Li-deficient compounds (Li1-δFeAs) synthesized with a high-pressure method. Highest = 18 K was reported in Li0.6Fe2As2[8]. In contrast, it was reported that single-crystal LiFeAs is not in the magnetically ordered state, but exhibits a superconducting transition at = 18 K, with electron-like carriers[31, 32]. It seems that superconductivity realized in LiFeAs seems to be very sensitive to sample preparation, and that further investigation is needed. It was reported that NaFeAs with the “111” structure also shows superconductivity at K[33].
Recently, superconductivity has been reported at 8 K in -FeSe compounds with the -PbO-type structure, which is shown in Fig. 2(d). This structure, shortened as the “11” structure, has the same planar crystal sublattice equivalent to the FeAs layer in the above three structure[9]. It has been clarified that a clean superconducting phase exists only in those samples prepared with intentional Se deficiency (Se-deficient FeSe is thermodynamically stable in the Fe-Se system). It was reported that the application of pressure raises the onset temperature of superconducting transition as high as 27 K at 1.5 GPa[34]. It was also found that Te substitution for Se enhances up to 15.2 K in FeSe0.5Te0.5, although FeTe is non-superconducting[35]. This “11” structure has attracted attention owing to its being the simplest among the four structures.
The structural parameters of the four structures are summarized in Table II.
| LaFeAsO | BaFe2As2 | LiFeAs | FeSe0.91 | |
|---|---|---|---|---|
| Space group | ||||
| (Å) | 4.03007 | 3.9625 | 3.7914 | 3.77376 |
| (Å) | 8.7368 | 13.0168 | 6.364 | 5.52482 |
| (Å) | 2.84969 | 2.802 | 2.6809 | 2.668 |
| (Å) | 2.407 | 2.403 | 2.4204 | 2.38 |
3 Physical Properties
3.1 Normal-state results
In this section, the normal-state properties, particularly of the “1111” and “122” structures, studied with band calculations and various experimental techniques, are reviewed.
3.1.1 Electronic structure
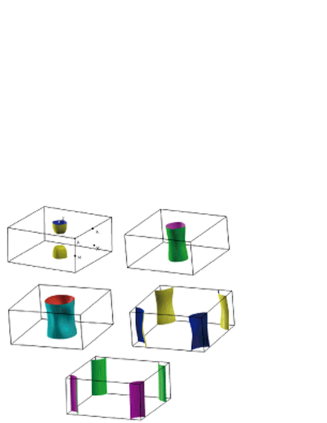
To understand the bulk electronic properties in the metallic state, it is important to determine electronic structure. After the discovery of superconductivity in LaFePO[38], Lebègue performed calculations of the electronic band structure using the density functional theory[39]. Lebègue showed that the Fermi surfaces of LaFePO consist of five sheets mainly originating from five-fold degenerated Fe orbitals: four of them are cylindrical sheets parallel to the direction, in which two hole cylinders are centered along the - Z direction while the two electron cylinders are centered along the M - A line, and the fifth sheet consists of a distorted sphere centered at the Z high-symmetry point. The Fermi surfaces reported by Lebègue are shown in Fig. 5. Some of the Fermi surfaces were observed experimentally through quantum oscillation experiments[40, 41].
The Fermi surfaces of the undoped LaFeAsO were discussed on the basis of the results of the density functional studies by Singh and Du[42]. They showed that the Fermi surfaces of LaFeAsO is quite similar to those of LaFePO: two high-velocity electron cylinders around the zone edge line, two lower-velocity hole cylinders around the zone center, and an additional heavy 3D hole pocket, which intersects and anticross with the hole cylinders, is centered at . The heavy 3D pocket is derived from the Fe state, which hybridizes sufficiently with As and La orbitals to yield a 3D pocket. It is quite interesting that the ground states of LaFePO (superconductivity) and LaFeAsO (stripe antiferromagnet) are quite different, although the Fermi surfaces and band structures near of two compounds are very similar. From the calculation[42], it was shown that both compounds are on the border of magnetic instability. Nakamura et al. discussed the electronic structures of LaFeAsO and LaFePO on the basis of first-principle calculations[43]. Although the interactions parameters do not exhibit noticeable differences between the two compounds, they pointed out the difference in bandwidth (the bandwidth of LaFeAsO is slightly (20%) narrower than that of LaFePO) and the difference in a band close to the Fermi surface at the point (LaFeAsO has a two-dimensional dispersion with the character and LaFePO has a three-dimensional one with the character).
The electronic structures and Fermi surfaces of the BaFe2As2 “122” and LiFeAs “111” phases were investigated with the density functional calculations[44]. The Fermi surfaces of BaFe2As2 are also similar to those in LaFeAsO, but the hole Fermi surface at the point is flattened out, suggesting a more three-dimensional character than that in the “1111” and “111” structures.
As an important feature of the Fermi surfaces in these compounds, the cylinders at the and M points are nearly nested and can yield strong nesting peaked at () in the folded Brillouin zone (two Fe atoms in the unit cell). This can lead in general to enhanced spin fluctuations in this nesting vector and, if these fluctuations are sufficiently strong, they can cause stripe-type SDW ordering. From similar band calculations in other transition-metal pnictides LaAsO ( Cr, Mn, Co and Ni), it was found that the Fermi surface nesting only occurs in LaFeAsO, which makes LaFeAsO distinct from the others[45]. Indeed, this stripe-type SDW state appears as the ground state for the parent iron pnictide as discussed in section §3.1.3.
The main effect of doping is suggested to be a reduction in the degree of nesting of the Fermi surfaces, which seems consistent with the experimental fact that the phase diagram is approximately symmetric against hole doping and electron doping.
3.1.2 Transport properties
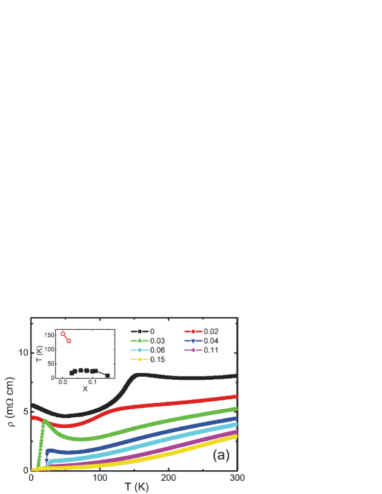
Dong et al. investigated the systematic F-content dependence of the electrical resistivity of LaFeAs(O1-xFx), which is shown in Fig. 7[46]. The resistivity of undoped LaFeAsO shows a weak temperature dependence with a high value at high temperatures, and exhibits a steep drop at approximately 150 K with an upturn below 50 K. The resistivity of the 2% F-doped sample decreases and the 150 K anomaly shifts to a lower temperature and becomes less pronounced. In the 3% F-doped sample, no anomaly was observed and a superconducting transition occurs at 17 K. With further F-doping, superconducting-transition temperature increases, leading to the highest K for 10% F doping. A quite similar F-doping dependence of was also observed in other FeAs(O1-xFx) ( = Ce and Sm) systems[15, 3].
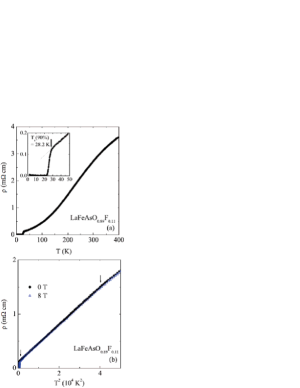
Using polycrystalline LaFeAs(O0.89F0.11) with an onset transition temperature = 28.2 K, Sefat et al. investigated the normal- and superconducting-state properties[47]. The resistivity exhibits a quadratic temperature dependence below 200 K with m cm, and mcmK-2. is independent of applied magnetic field. The behavior of below 200 K indicates the importance of the umklapp process of electron-electron scattering and is consistent with the formation of a Fermi-liquid state. The values are comparable to those of semi heavy-fermion compounds such as CePd3 and UIn3[48].
The temperature dependence of Hall coefficient in LaFeAs(O0.89F0.11) was measured at a magnetic field of 8 T[47]. The Hall coefficient is negative and weakly temperature-dependent down to 130 K, below which it is approximately constant. If a single band is assumed, the carrier concentrations are electrons/cm3 at room temperature, and electrons/cm3 just above , which is consistent with the band calculations[42]. These calculations also predict the presence of high-velocity electron bands and heavy-hole bands near the Fermi energy, with the electron bands dominating in-plane transport[47].
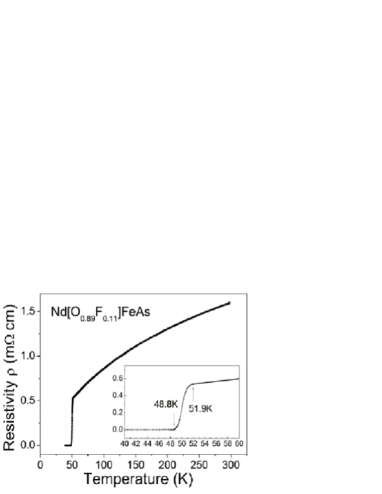
In contrast, no behavior was observed in FeAs(O0.89F0.11) with = Nd, Sm, Gd, etc. Figure 9 shows the temperature dependence of the electrical resistivity of NdFeAs(O0.89F0.11) with the onset resistivity transition at 51.9 K[4]. is roughly proportional to temperature down to 200 K, and shows a downward curvature at approximately 150 K. A quite similar temperature dependence was also observed in oxygen-deficient FeAsO1-δ with greater than 50 K, but the dependence of was reported in PrFeAsO1-δ with K[49]. It seems that the behavior is observed in lower- compounds of the “1111” system.
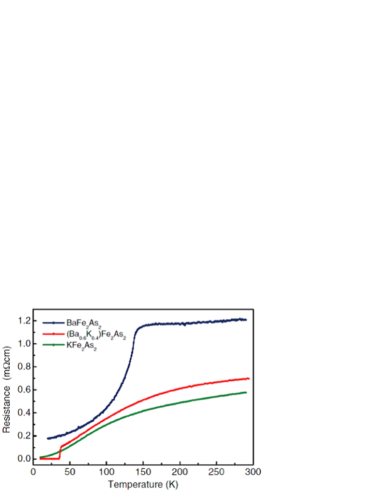
Figure 10 shows the temperature dependence of the electrical resistivity of polycrystalline (Ba1-xKx)Fe2As2 ( = 0, 0.4 and 1.0) with the “122” structure[18]. BaFe2As2 has the highest resistance among the three and shows a decrease at 140 K, which originates from SDW and structural anomalies. The resistance of KFe2As2 is considerably smaller and decreases smoothly with temperature, as is typical for a normal metal. The temperature dependence of the resistivity of K-doped (Ba0.6K0.4)Fe2As2 is similar to that of KFe2As2 and shows no sign of anomaly at approximately 140 K. The resistance drops abruptly to zero at 38 K, which clearly indicates superconductivity. No behavior was observed, but -linear behavior was observed down to below 100 K in (Ba0.6K0.4)Fe2As2. The resistivity of (Ba0.6K0.4)Fe2As2 is quite similar to that of FeAs(O1-xFx) with higher .
3.1.3 Magnetic ordering and physical properties of the parent compounds
As mentioned above, the resistivities of undoped LaFeAsO and BaFe2As2 show an anomaly at approximately 150 K, which is related to the magnetic and structural transitions.
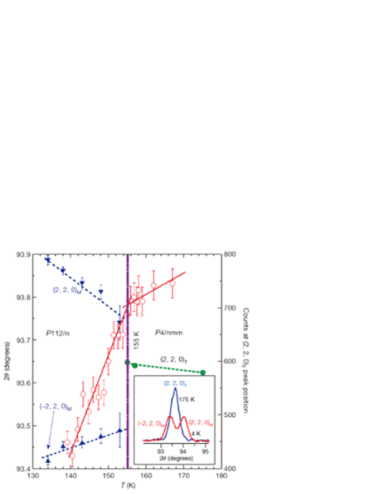
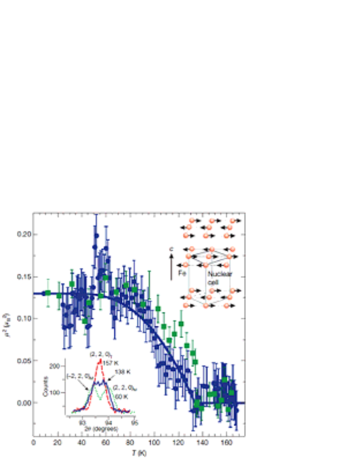
Cruz et al. reported careful neutron-scattering experiments that reveal the physical properties of the resistive anomaly in LaFeAsO[36]. Figure 11 shows the temperature dependence of the (2,2,0) nuclear reflection, indicative of a structural phase transition at K in LaFeAsO. This result demonstrates that LaFeAsO undergoes an abrupt structural distortion below 155 K, and the symmetry changes from tetragonal (space group ) to orthorhombic (space group ) at low temperatures (in the original paper, Cruz et al. denoted “monoclinic” (space group ), which becomes the primitive cell of Nomura et al.’s space group[50] if the z values of Fe[z(Fe)] and O[z(O)] are assumed to be exactly 0.5 and 0, respectively. See supplemental information[36]). Furthermore, they found the magnetic (1, 0, 3) Bragg peak at 8 K, and an ordered iron moment was estimated to be 0.36(5) /Fe. They carried out order parameter measurements on the strongest (1,0,3) magnetic peak in order to determine whether or not the ordered magnetic scattering at low temperatures in LaFeAsO is indeed associated with structural-phase transition. Figure 12 shows the temperature dependence of the square of the ordered moments measured at the Bragg peak. The ordered magnetic moment vanishes at 137 K, approximately 18 K lower than the temperature at which the structural phase transition occurs. The presence of the lattice distortion above the Nèel temperature is established conclusively in the bottom-left inset of Fig. 12, where a clear lattice distortion is apparent at 138 K. Therefore, the resistive anomaly at approximately 150 K is caused by the structural distortion. In contrast, neither structural nor magnetic anomaly was observed in superconducting LaFeAs(O0.92F0.08). The disappearance of the static antiferromagnetic order and lattice distortion in the doped superconducting materials suggest that the physical properties of this class of superconductors may have important similarities to those of high- cuprates. The top-right inset in Fig. 12 shows a simple stripe-type antiferromagnetic structure within the -plane doubled along the -axis. It should be noted that the moment of 0.36(5) per iron atom is much smaller than the predicted value of per iron atom, although the magnetic structure is consistent with the theoretical prediction[51]. The presence of magnetic frustrations and/or spin fluctuations was suggested to interpret the reduced ordered moment[52, 53].
Further evidence of the static magnetic ordering at 138 K in LaFeAsO was obtained with 57Fe Mössbauer[54, 55], SR[54] and 139La-NMR experiments[56]. These experiments detected a static internal field and clearly show that magnetic ordering is in a commensurate spin structure. The internal field abruptly develops below , which is much steeper than the usual temperature dependence. This steep increase in internal field might originate from the two-dimensionality of magnetic fluctuations, because a similar rapid growth was reported in the cuprate antiferromagnet La2CuO4[57].
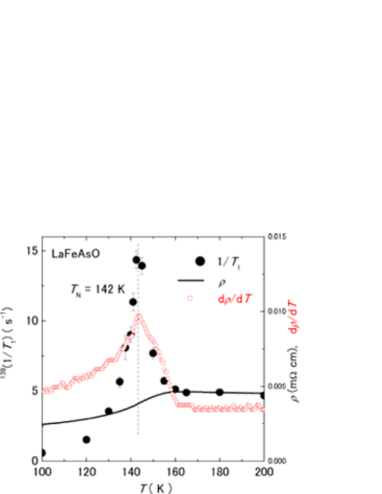
From the 139La-NMR experiment, it is shown that the magnetic ordering is highly related to the structural distortion[56]. Figure 13 shows the temperature dependence of nuclear spin-lattice relaxation rate of La, along with electrical resistivity and its temperature derivative . starts to increase below 160 K, where shows a kink owing to the structural transition. The temperature derivative of shows a sharp peak at , which coincides with the peak of . The result indicates that magnetic fluctuations start to slow down below 160 K where the structural transition occurs, and magnetic character becomes static below 142 K. The relationship between the structural and magnetic transitions suggests importance of the spin Jahn-Teller effect in LaFeAsO, where the direction of the ordered moments are determined in order to lower magnetic energy after the structural distortion occurs.
Similar structural and magnetic transitions were observed in other rare-earth parent compound FeAsO. The structural transition, antiferromagnetic transition temperature, and magnetic ordered moments, as well as the ordering temperature of the rare-earth moments and the direction of the rare-earth moments are summarized in Table III.
| sample | ref. | [K] | [K] | [] | [K] | |
| LaFeAsO | [36] | 155 | 137 | 0.36 | ||
| CeFeAsO | [58] | 155 | 140 | 0.83 | 4 | -plane |
| PrFeAsO | [59] | 153 | 127 | 0.48 | 14 | -axis |
| NdFeAsO | [60] | 150 | 141 | 0.9 | 2 | -plane |
| CaFeAsF | [13, 61] | 134 | 114 | 0.49 | ||
| SrFeAsF | [14, 62] | 175 | 120 | |||
| CaFe2As2 | [63] | 173 | 173 | 0.8 | ||
| SrFe2As2 | [64, 65] | 220 | 220 | |||
| BaFe2As2 | [66] | 140 | 140 | 0.9 |
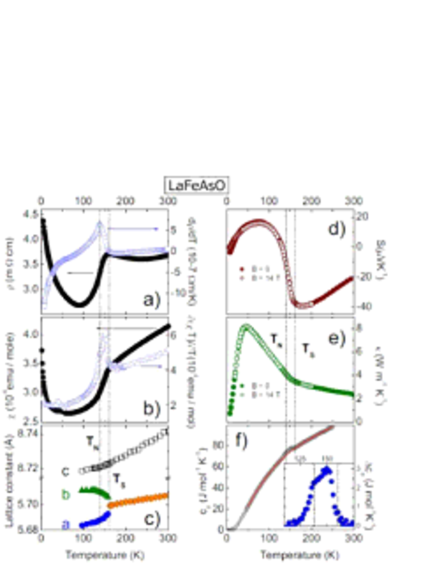
Kondrat et al. reported the temperature dependences of the electrical resistivity , the dc magnetic susceptibility, the lattice constants and , the specific heat , the Seebeck coefficient , and the thermal conductivity of the parent compound LaFeAsO, as summarized in Fig. 14[67]. Both phase transitions are visible in , which measures the total entropy changes. In the inset of Fig. 14(f), the background-subtracted data is shown in order to highlight these anomalies. The data confirms a jump in at , which is indicative of a second-order phase transition and an additional anomaly at . The similarities between and indicates that the total entropy change connected with both transitions is proportional to that of magnetic origin.
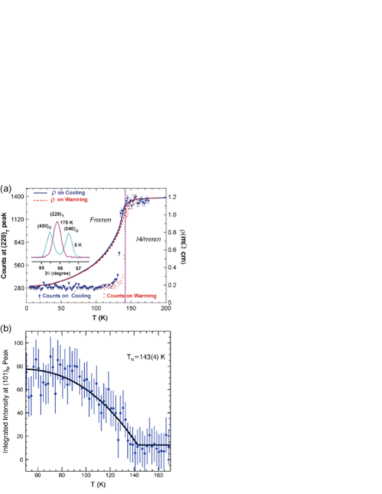
Magnetic ordering was also reported in BaFe2As2 with the “122” structure from neutron-diffraction measurements[66]. Figure 15(a) shows the temperature dependence of the electrical resistivity and intensity of the neutron diffraction peak at (2,2,0)T. The discontinuity in the intensity of the Bragg reflection and the hysteresis observed during a cooling-and-warming cycle imply that the structural phase transition possesses a first-order character. In addition, a transition to a long-ranged antiferromagnetic state occurs at K, where a structural transition from tetragonal to orthorhombic also occurs. The magnetic and structural phase transitions occur simultaneously, which is in contrast to the “1111”-type compounds. The first-order character of the transition was also suggested from the absence of critical magnetic fluctuations as well as from an abrupt change of the 75As-NMR intensity with hysteresis obtained in a single-crystal sample[68]. The ordered magnetic moment 0.87(3) per Fe at 5 K in BaFe2As2 is substantially larger than the saturated moment 0.36(5) in LaFeAsO, but is comparable to the moment 0.9 in NdFeAsO[69] and the moment 1.01 in the same “122” structure SrFe2As2[65]. The first-order structural transition accompanied with the antiferromagnetic transition seems to be a common feature of the “122” compounds.
3.1.4 Fermi surface experiments
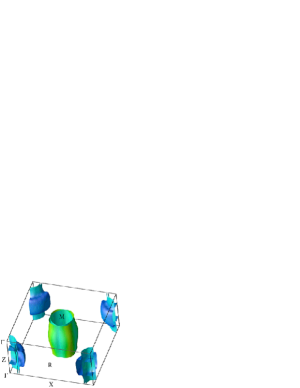
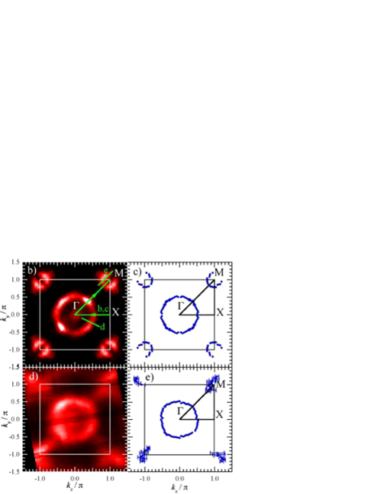
Angle resolved photoemission spectroscopy (ARPES) is a powerful technique for investigating electronic properties. Liu et al. performed ARPES experiments on large-grain superconducting NdFeAsO0.9As0.1 ( K), and reported that well-defined Fermi surfaces consist of a cylindrical large hole pocket at the Brillouin zone center (0,0,0) and a smaller electron pocket at each corner of the Brillouin zone (M points), as shown in Fig. 16[70]. Although some band calculations yield an ellipsoidal Fermi surface around Z (0,0,1), this was not observed for the studied photon energies. The overall location and shape of the Fermi surface reasonably agree with band calculations; however, the band dispersion is quite complicated with many flat bands located just below the chemical potential.
The Fermi surfaces of Ba1-xKxFe2As2 with the “122” structure have been investigated by several groups.[71, 72, 73, 74, 75, 76, 77, 78] It was found that the Fermi surfaces of the undoped BaFe2As2 consist of hole pockets at (0,0,0) and larger electron pockets at M points, in general agreement with full-potential linearized plane wave calculation[73]. Upon K doping, the hole pocket expands and the electron pocket becomes smaller and the bottom of the electron Fermi surface almost approaches . Such an evolution of the Fermi surface is consistent with hole doping within a rigid-band shift model. Furthermore, Sato et al. have performed ARPES measurements of the end-member compound KFe2As2, in which holes are heavily doped[78]. Although hole pockets around the point are qualitatively similar to those of optimally doped Ba0.4K0.6Fe2As2 with =37 K, the electron pockets around the M point are completely absent owing to excess hole doping. They suggest that the interband scattering via the antiferromagnetic wave vector is suppressed by the absence of an electronic pocket around the M point, and is essentially related to in the overdoped region.
3.1.5 Normal-state magnetic properties in LaFeAs(O1-xFx)
Systematic bulk susceptibility measurements in LaFeAs(O1-xFx) were performed by Kohama et al.[79] and Klingeler et al[80]. The of LaFeAs(O1-xFx) is independent of local-moment effects by rare-earth elements, and is affected only by the iron electrons. In both reports, the of LaFeAsO shows a gradual decrease from room temperature and exhibits a small drop at where the structural transition occurs. Below approximately 50 K, shows an upturn behavior, which would be ascribed to an impurity contribution. Antiferromagnetic anomaly at was visible in the temperature derivative of as shown in Fig. 14, which corresponds to a magnetic specific heat.
The temperature dependences of the of the F-doped compounds are different between the above two reports. The of the F-doped sample reported by Kohama et al.[79] shows an increasing behavior with decreasing temperature, but that reported by Klingeler et al.[80] shows a gradual decrease with decreasing temperature as in the undoped LaFeAsO. Since the temperature dependence of the 75As-Knight shift is scaled to the latter behavior[81, 82, 83], the former temperature dependence is considered to be significantly affected by impurity phases. Klingeler et al. also reported that the temperature dependences of well above and are barely unchanged in a wide doping region, although the ground state changes from an orthorhombic antiferromagnetic poor metal to a tetragonal nonmagnetic superconductor upon F doping.
The dynamical susceptibility arising from the Fe- spin dynamics has been investigated by measuring the nuclear spin-lattice relaxation rate with a nuclear-magnetic-resonance (NMR) technique[56, 81, 82, 84, 85, 83]. is related to the -integral of the low-energy component of spin fluctuations, that is,
where and are the -dependent hyperfine coupling constant at the observed site arising from the Fe- spin and the dynamical susceptibility, respectively, and the sum is taken over the 1st Brillouin zone.
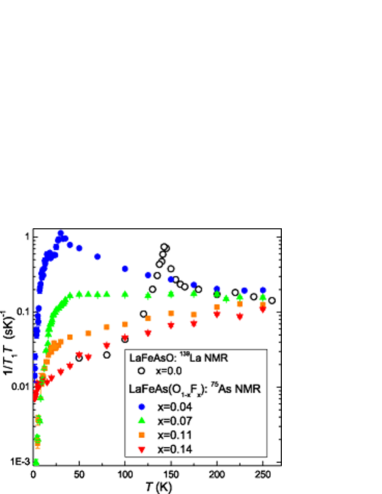
Systematic measurements of in LaFeAs(O1-xFx) were performed by Nakai et al. Figure 17 shows the temperature dependence of the of LaFeAs(O1-xFx)[86]. In this figure, the of 139La in undoped LaFeAsO is normalized to that of 75As using the ratio of hyperfine coupling constants. The of undoped LaFeAsO shows a clear peak at K, which is in contrast to the tiny anomaly in . These are characteristic features of an itinerant antiferromagnet, in which the ordered -vector is far from . As shown in Fig. 13, the magnetic fluctuations are related to the structural phase transition occurring below .
The magnetic fluctuations are significantly suppressed upon F doping. In the F4%-doped sample, shows a kink at approximately 30 K, which is ascribed to a magnetic anomaly, and then exhibits a sharp decrease owing to the superconducting transition at 16 K. It was revealed that two anomalies are observed in the F4%-doped sample. In the F7%-doped sample, is nearly constant from room temperature, and starts to decrease at 40 K, which is far above 20 K. The decrease in above becomes significant upon further F doping, and the of the F11%-doped sample shows a continuous decrease from room temperature. The decrease in far above is reminiscent of the pseudogap behavior observed in underdoped cuprates[87]. This pseudogap behavior was first pointed out by Ahilan et al. from their F-NMR measurement on LaFeAs(O0.89F0.11)[81]. By using the empirical formula
the magnitude of the pseudogap is estimated to be K with (s-1K-1) and (s-1K-1) for the F11%-doped sample and K with (s-1K-1) and (s-1K-1) for the F14%-doped sample. The estimated pseudogap energies of the F11%- and F14%-doped samples are almost the same within experimental errors[86, 83]. One of the significant differences between the iron oxypnictides and the cuprates is that the pseudogap behavior becomes more pronounced in the heavily F-doped region in LaFeAs(O1-xFx), whereas it does in the underdoped region in the cuprate superconductors.
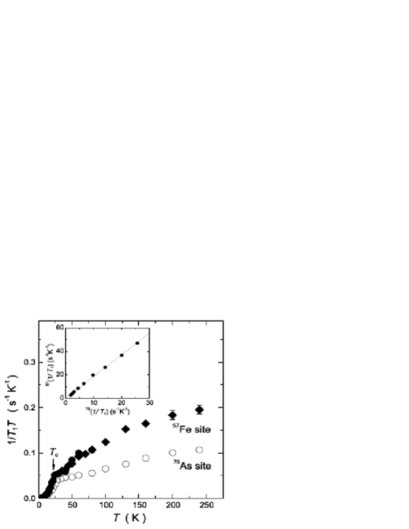
In addition, Terasaki et al. performed 57Fe and 75As-NMR measurements in LaFeAsO0.7, and reported that the of 57Fe shows a similar temperature dependence to that of 75As, as shown in Fig. 18[85]. This indicates that the magnitudes of pseudogap at the Fe and As sites are almost identical, and that low-energy spin fluctuations are suppressed over the whole -space with decreasing temperature, since the of Fe is determined by the spin fluctuations over the entire -space. These systematic 75As-NMR measurements of LaFeAs(O1-xFx) and 57Fe-NMR in LaFeAsO1-δ suggest that the psuedogap cannot be ascribed to antiferromagnetic fluctuations. Recently, it has been proposed that the pseudogap originates from the characteristic band structure near [88]. A hole Fermi surface around in the unfolded BZ, existing just near , sinks down with electron doping. Then, thermally excited electrons can contribute to at higher temperatures, resulting in the observed pseudogap behavior in the electron-doped region. This scenario is consistent with the experimental data. For further clarification of the origin of the pseudogap, particularly measurements in the hole-doped region are desired.
3.1.6 Normal-state magnetic properties in Ba(Fe1-xCox)2As2
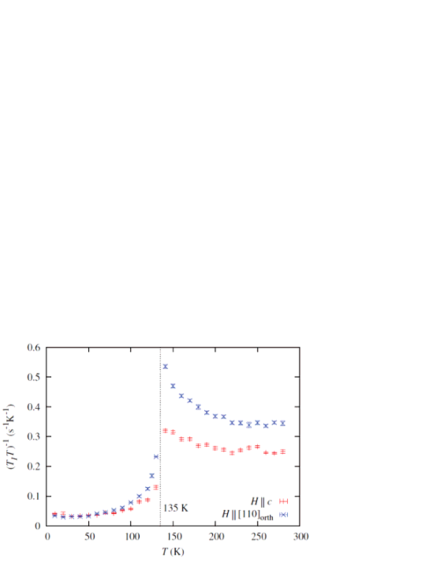
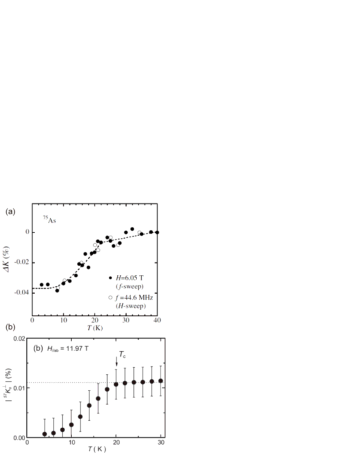
NMR studies of single-crystal and poly-crystal BaFe2As2 with the “122” structure were performed by several groups[89, 68, 90]. In contrast with LaFeAsO, Kitagawa et al. reported a first-order-type antiferromagnetic transition from the splitting of 75As NMR lines in BaFe2As2, which is accompanied by the simultaneous structural transition as evidenced by a sudden large change in the electric field gradient tensor at the As site[68]. From the analyses of the hyperfine field at the As site, a spin structure in the antiferromagnetic state was microscopically determined: a stripe structure with the antiferromagnetic moments directed perpendicular to the stripe is formed. This stripe structure is fully consistent with the results of neutron-diffraction experiments. The anisotropic temperature dependence of was observed in the paramagnetic state, which is shown in Fig. 19. for increases with decreasing temperature, while for is nearly constant down to 175 K. This anisotropy in is explained in terms of the fluctuations of the hyperfine field along the -direction, which can be generated only from the above stripe-type spin fluctuations along the -direction.
The evolution of normal-state magnetic properties with electron doping was systematically studied by Ning et al. from the 75As-NMR measurements in single-crystal Ba(Fe1-xCox)2As2, where superconductivity emerges upon doping Co at the Fe site[91, 92]. The intrinsic spin susceptibility and low-energy spin dynamics were investigated by measuring the Knight shift and at 0.00 ( = 135 K), 0.04 ( = 66 K), 0.08 ( = 22 K), and 0.105 ( = 15 K). Figure 20 shows the and temperature dependences of the Knight shift. In the figure, the spin susceptibility is shown on the right vertical axis, which was estimated using,
Here, () is the spin (orbital) part of the Knight shift, and is the hyperfine coupling constant. It was shown that decreases with decreasing temperature and is suppressed by electron doping. Ning et al. pointed out that the some energy scale such as the effective spin-spin exchange interaction or pseudogap increases with electron doping in Ba(Fe1-xCox)2As2. This tendency seems to be consistent with that in LaFeAs(O1-xFx), but is opposite to that in high- cuprates, where such an energy scale is suppressed by hole doping[92].
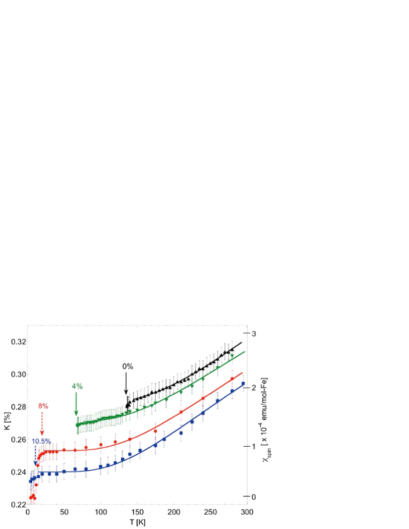
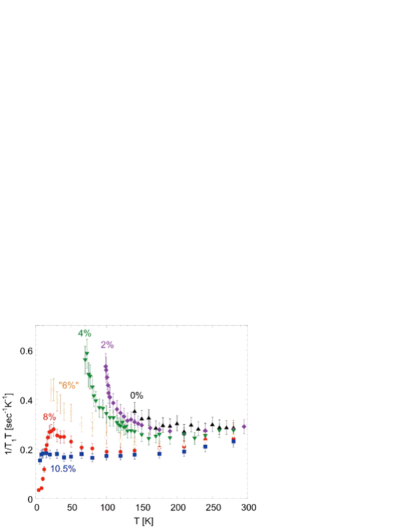
Figure 21 shows the Co concentration and temperature dependences of in Ba(Fe1-xCox)2As2[91, 92]. Although 0.02 and 0.04 samples show a divergent behavior of due to critical slowing down of spin fluctuations toward , at = 0.105 levels off after a monotonic decrease with decreasing temperature, and exhibits no evidence for enhancement owing to low-energy antiferromagnetic fluctuations. Considering that is also suppressed below 300 K for all concentrations, it is considered that low-energy spin fluctuations are suppressed with decreasing except near , i.e. Ba(Fe1-xCox)2As2 exhibit pseudogap behavior for broad concentrations as in LaFeAs(O1-xFx).
3.2 Superconducting properties
Superconducting properties have been investigated through various experiments. Here, some key experimental results are reviewed.
3.2.1 Upper critical field
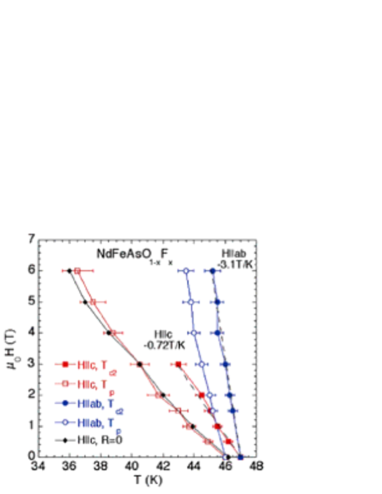
In the early stage, Hunte et al. reported resistive measurements of polycrystalline LaFeAsO0.89F0.11 at high magnetic fields of up to 45 T, that show a remarkable increase in the upper critical field compared with values expected from the slopes d/d T/K near at low temperatures[93]. Since this enhancement behavior is similar to that observed in dirty MgB2 films, they suggested that superconductivity in LaFeAsO0.89F0.11 results from two bands (i.e. a nearly two-dimensional diffusive electron band and a more isotropic heavy hole band), and that the enhancement behavior can be interpreted by a two-gap scenario. However, to confirm these issues, it seems that single-crystal measurements are highly desired. Welp et al. reported the upper critical field of single-crystal NdFeAs(O1-xFx) with K from specific-heat measurements[94]. Figure 22 shows a phase diagram of NdFeAs(O1-xFx) as determined from the field dependence of superconducting anomalies in specific-heat and resistivity measurements. The average slopes of for the - and -axes are respectively T/K and T/K, resulting in a modest superconducting anisotropy of [94]. Using the ordinary single-band Ginzburg-Landau relations for the upper critical field, i.e, and , and the single-band Werthamer-Helfand-Hohenberg (WHH) expression[95] , T, T, nm, and nm are evaluated.
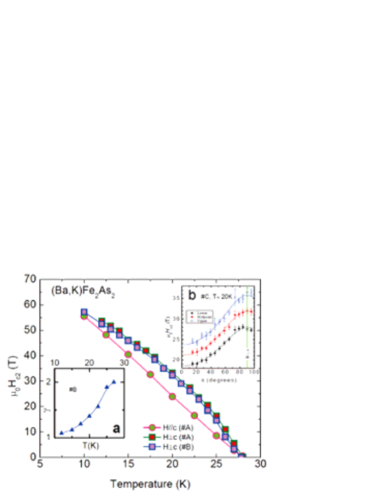
of single-crystal (BaK)Fe2As2 was investigated by Yuan et al[96]. Figure 23 displays the determined at the resistive midpoint vs temperature for two different single-crystalline samples of (Ba,K)Fe2As2 (#A and #B) up to 60 T. Although their residual resistivities are different ( mcm and mcm), the two samples have almost identical K) and behaviors. This suggests that superconductivity in (Ba,K)Fe2As2 is not so sensitive to disorder or impurity scattering, in contrast to some other unconventional superconductors. The most remarkable aspect in Fig. 23 is the fact that the of (Ba,K)Fe2As2 extrapolates to a similar value of 70 T as , irrespective of directions for applied magnetic fields. This is in great contrast to the behavior of other quasi-2D superconductors such as organic superconductors or cuprates, where the in-plane critical fields are much larger than fields applied perpendicular to the planes. A superconducting anisotropy at about was also investigated in Ba0.6K0.4Fe2As2. Unexpectedly, a small was reported at about [97], which is lower than that of NdFeAs(O1-xFx)[94]. The small anisotropic might be understood in terms of the 3D-like Fermi surfaces of (Ba,K)Fe2As2: larger corrugations in the Fermi surfaces are sufficient to permit closed orbits at all field orientations; hence, orbital limiting effects will persist at all field angles, leading to the rather isotropic upper critical field observed.
The superconducting parameters for single crystals of NdFeAs(O1-xFx) and (Ba1-xKx)Fe2As2 are summarized in Table IV.
| sample | Ref. | [K] | [T] | [K/T] | [K/T] | [nm] | [T] | [T] | |
|---|---|---|---|---|---|---|---|---|---|
| NdFeAs(O0.82F0.18) | [94] | 47 | 0.9 | 3.7 | 23 | 100 | |||
| NdFeAs(O0.82F0.18) | [98] | 50 | 62-70 | 304 | |||||
| NdFeAs(O0.7F0.3) | [99] | 50 | 0.26 | 2.3 | |||||
| (Ba0.6K0.4)Fe2As2 | [97] | 36.5 | 138 | 235 | |||||
| (Ba0.55K0.45)Fe2As2 | [100] | 32 | |||||||
| (Ba1-xKx)Fe2As2 | [96] | 28.5 |
3.2.2 ARPES measurements in the superconducting state
ARPES in the superconducting state is an excellent method for investigating the symmetry of the order parameter, since ARPES can directly measure the dependence of superconducting gap. At present, since available high-quality single crystals are (BaK)Fe2As2 and NdFeAs(O1-xFx), ARPES measurements have been performed in these compounds[101, 70, 71, 72, 73, 74, 75, 76, 77].
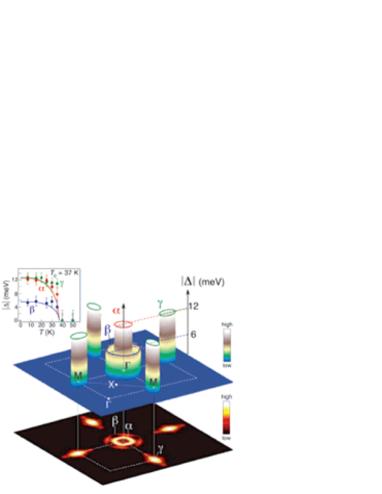
Ding et al. have performed ARPES measurements on the superconducting Ba0.6K0.4Fe2As2 ( K), and the results are summarized in Fig. 24[71]. Two superconducting gaps with different values were observed : a larger gap (12meV) on small hole-like and electron-like Fermi-surface sheets, and a small gap (6meV) on the larger hole-like Fermi-surface sheet, which are shown in the main panel. Both superconducting gaps are nearly isotropic without nodes, and close simultaneously at the bulk , as shown in the inset. Since the large superconducting gap ascribed to strong pairing interactions is observed in the two small hole and electron Fermi surfaces connected by the (,0) spin-density-wave vector, Ding et al. suggest that the pairing mechanism originates from the inter-band interactions between these two nested Fermi-surface sheets. Similar experimental results have been reported from different groups[72, 73, 74, 75, 76, 77].
In the “1111” system, ARPES measurements have been performed in the superconducting NdFeAsO0.9F0.1[101, 70]. It was found that the hole-like Fermi surface around the point is fully gapped below and that the superconducting gap is meV at an anisotropy smaller than 20% of the SC gap. The superconducting gap at the electron-like Fermi surface is not reported at present. These ARPES measurements of Ba1-xKxFe2As2 and NdFeAsO0.9F0.1 strongly suggest that 1) the superconducting gap is nodeless, which excludes the -wave and -wave pairing states with nodes of the gap on the Fermi surfaces but consistent with -wave pairing, and that 2) the magnitude of superconducting gap is orbital-dependent.
3.2.3 Magnetic penetration-depth measurements
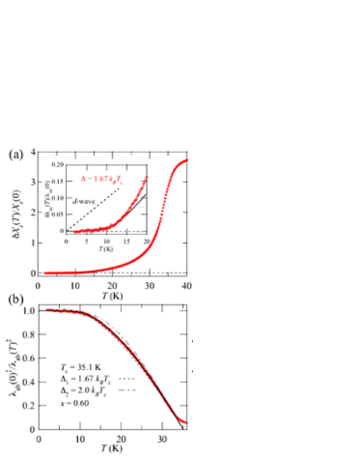
Nodeless superconducting gap was also suggested from magnetic penetration-depth measurements. Hashimoto et al. measured the in-plane microwave penetration depth in underdoped single crystals of PrFeAsO1-δ ( K), and reported that shows a flat temperature dependence at low temperatures, as shown in Fig. 25[49]. This result is incompatible with the presence of nodes and suggests a nodeless superconducting gap with 1.6 all over Fermi surface. However, it was reported that the whole temperature dependence of the penetration depth cannot be reproduced by the single superconducting gap estimated from the low-temperature behavior, but by two different isotropic gaps with = 1.67 and 2.0. This simple model was successfully used for the two-gap -wave superconductor MgB2, and suggests the presence of two different gaps also in PrFeAsO1-δ. A similar two-nodeless-gap model is also applied in SmFeAsO1-xFx ( K)[102], but the result suggesting a single fully gapped order parameter with a small anisotropy was reported in single crystals of NdFeAsO0.9F0.1[103].
High-sensitive microwave measurements of the in-plane penetration depth were performed in several single crystals of the hole-doped superconductor Ba1-xKxFe2As2[104]. It was reported that the temperature dependence of is sensitive to degrees of disorder inherent in the crystals. The exponential temperature dependence consistent with a fully opened gap was observed at the penetration depth for the cleanest crystal at low temperatures, which contradicts the -linear dependence expected in clean -wave superconductors with line nodes. The overall temperature dependence of the penetration depth cannot be fully reproduced by a single gap calculation, but can be successfully explained by a two-gap model with = 1.17 and = 2.40. In addition, a linear relation between the low-temperature scattering rate and the density of quasiparticles was observed, which is also in contrast to that in the case of -wave cuprate superconductors with nodes in the gap, but is consistent with the case of -wave superconductors without nodes, since and in an -wave superconductor are both expected to follow the exponential dependence at low temperatures, resulting in a linear relation between these two quantities. A similar two-isotropic-gap state was also suggested from penetration-depth measurements with the SR method[105].
3.2.4 NMR in the superconducting state
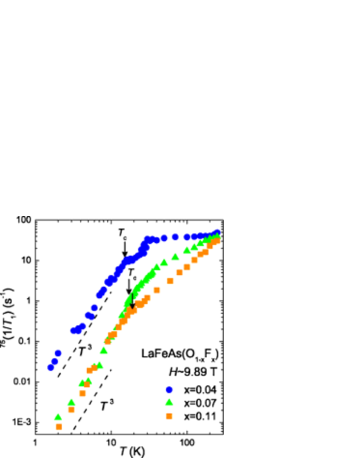
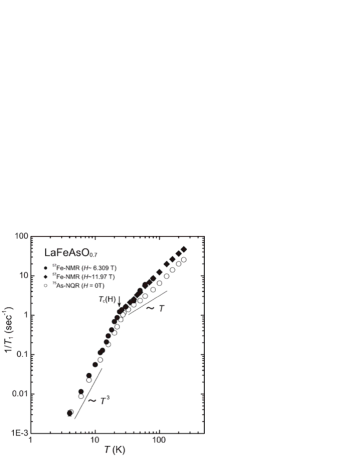
Up to now, several NMR groups have reported the temperature dependence of the nuclear spin-lattice relaxation rate in the superconducting state, which is related to the superconducting-gap structure[56, 86, 81, 82, 84, 85, 91, 92, 83, 106, 107, 108]. Nakai et al. reported the -dependences of of 75As for , 0.07 and 0.11, which were measured in T parallel to the -plane[56, 86]. The experimental results of are shown in Fig. 26. It was found that decreases suddenly without showing a Hebel-Slichter (coherence) peak, and that a dependence was observed in in the superconducting state for = 0.07 and 0.11 samples as seen in Fig. 26. In order to determine whether or not this dependence is modified by applying external fields, of the sample was measured in various magnetic fields. It was found that the behavior holds down to 4 K () in the measured field range of T within experimental error, indicative of the behavior being intrinsic in the superconducting state. The absence of a coherence peak and the robust dependence in were also reported in LaFeAs(O0.9F0.1) by Grafe et al. In addition, a similar behavior down to 4 K was also reported from 75As-NQR measurements in oxygen-deficient LaFeAsO0.6, where was measured in zero field[84]. This also suggests that the behavior below is intrinsic, which is not affected by applied fields. Quite recently, Terasaki et al. have reported that the same temperature dependence of is observed not only at the As site but also at the Fe site where the pairing interaction is considered to arise[85]. The temperature dependence of in LaFeAsO0.7 with K is displayed in Fig. 27. It is interesting that a similar temperature dependence of was also observed in the - FeSe superconductor through a Se NMR[109].
The observed dependence of for LaFeAs(O0.89F0.11) can be reproduced using a two-dimensional line-node () model with [56]. However, Nakai et al. pointed out that a residual density of states (DOS) suggested from the Korringa behavior at low temperatures is not observed in LaFeAs(O1-xFx)[56, 86]. In non -wave superconductors with line nodes crossing the Fermi surface, the residual DOS is easily induced by a small amount of impurities and crystal imperfections, and was observed in most unconventional superconductors[110, 111]. In addition, it is known in anisotropic superconductors with nodes that the applied magnetic field induces the extra relaxation rate at low temperatures, which originates from the Volvik effect[112]. It is pointed out that a quasiparticle state would extend outside the vortex cores with an ungapped spectrum in a -wave superconductor, which gives rise to a field-induced relaxation rate. However, no such field-induced relaxation rate was observed, as seen in Figs. 26 and 27. The absence of the residual DOS and the field-induced relaxation at low temperatures seems to be in contrast to that for non--wave models. It should be noted that the robust behavior in the superconducting state has been observed only in high-quality samples of the unconventional superconductors under zero field.
Alternatively, recent theoretical studies have suggested that the absence of the coherence peak is consistent with the fully gapped state and that the dependence in the superconducting state can be reconciled with this state with an impurity effect[113, 114, 115, 116, 117]. Here, in this state, the sign of the superconducting gap is reversed in the hole and electron Fermi surfaces and each superconducting gap is nodeless. In other recent theoretical studies, it was shown that a fully gapped anisotropic -wave superconductivity with some impurity effect can account for the NMR results[117]. In order to check these scenarios, further measurements using high-quality samples and iron-pnictide superconductors other than the “1111” system are crucial, particularly low-temperature measurements.
Another important information from NMR measurements in the superconducting state is the symmetry of the superconducting pair, which is obtained through Knight-shift measurements, because the Knight-shift measurement is the most accurate method of measuring spin susceptibility in the superconducting state. Up to date, the Knight shift measurements in the superconducting state have been reported by several groups[85, 91, 106, 118].
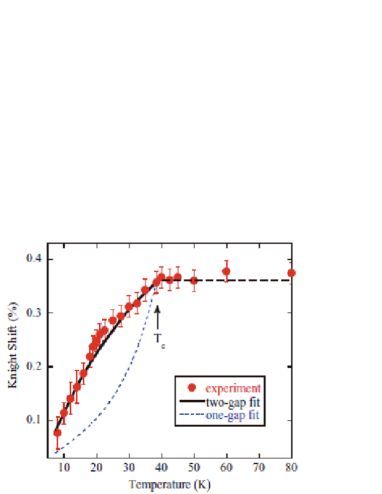
Matano et al. reported the temperature dependence of the Knight shift in PrFeAsO0.85F0.15 with K. Figure 28 shows the temperature dependence of the Knight shift below 80 K[106]. The Knight shift decreases below down to 20 K, followed by a still sharper drop below 20 K. Although the Knight shift decreases to almost zero, indicative of spin-singlet pairing, the temperature dependence of the Knight shift is quite different from the behavior seen in conventional spin-singlet superconductors. From the temperature dependences of both the Knight shift and at the F site in the superconducting state, Matano et al. suggested that there are two gaps opening below , which possess nodes in the gap function[106]. They suggested that a similar two-gap model is applicable to the analysis of the temperature dependence of below in LaFeAs(O0.92F0.08) (=23 K)[107].
Kawabata et al. and Terasaki et al. reported temperature dependences of Knight shift that are different from that reported by Matano et al[118, 85]. Figure 29(a) shows the temperature dependence of the 75As Knight shift below measured by using a powder sample of LaFeAs(O0.89F0.11) ( 26 K)[118]. In contrast to that shown in Fig. 28, Knight shift decreases below , but no additional decrease in the Knight shift suggesting a two-gap opening was observed. A similar temperature dependence of the Knight shift in the superconducting state was observed at the Fe site in LaFeAsO0.7 with K, as shown in Fig. 29(b) [85]. Terasaki et al. estimated the spin part of the Knight shift by comparing the Knight shifts at various different sites, and showed that the spin-part of the Knight shift decreases to almost zero at , indicative of the spin-singlet pairing state. The spin-singlet pairing state was also confirmed from the measurements of Knight-shift in different directions in Ba(Fe1-xCox)2As2.
3.2.5 Isotope effect
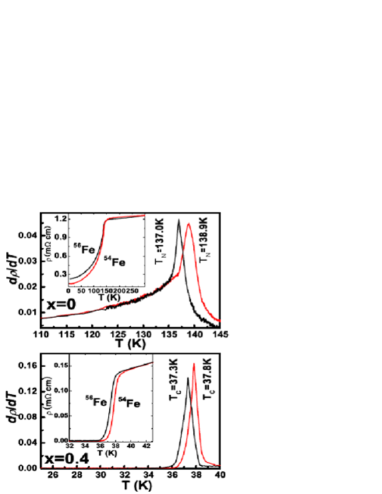
It is widely accepted that isotope effects on provide a strong evidence of the superconducting mechanism that electron-phonon interaction is responsible for superconductivity in the framework of the BCS theory. Liu et al. reported the effect of isotropic substitution on and an antiferromagnetic transition temperature in SmFeAsO1-xFx by replacing 16O with isotope 18O and Ba1-xKxFe2As2 by replacing 56Fe with isotope 54Fe[119]. Although and were found to change by approximately 0.61 and 0.75% for oxygen isotope exchange in SmFeAsO1-xFx with and 0.15, these changes are 1.39 and 1.34% for Fe isotope exchange in Ba1-xKxFe2As2 with and 0.4, respectively, as shown in Fig. 30. The effect of the oxygen isotope is much smaller than that of the iron isotope, which suggests that the FeAs layer is a conducting layer responsible for superconductivity. An iron isotope component was estimated to be about 0.4, being close to 0.5 for the full isotope effect in the framework of the BCS theory. These results seem to suggest that the electron-phonon interaction plays an important role in superconductivity of the pnictide superconductors. Since these results are crucial for understanding the mechanism of iron pnictide superconductivity, further experiments showing the variation in in several experimental runs are highly desired.
As for the local lattice structure, an extended X-ray absorption fine structure (EXAFS) measurement[120] revealed that the mean-square relative displacements of the Fe-As bond in LaFeAs(O0.93F0.07) exhibit a sharp drop at the onset, implying a significant electron-lattice interaction.
3.2.6 Relationship between superconductivity and crystal structure
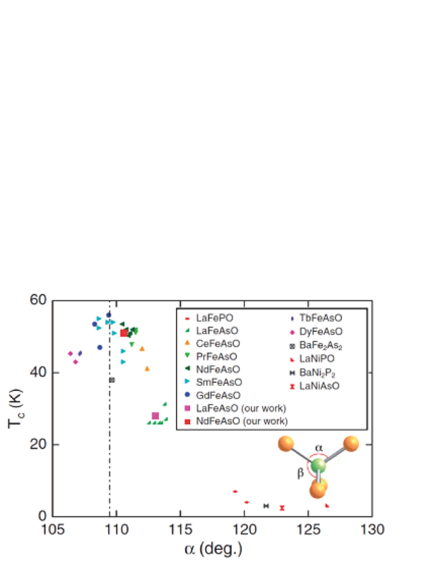
Lee et al. have investigated the crystal structures of FeAsO1-δ ( La and Nd) by powder neutron diffraction analysis[121]. Atomic parameters of FeAsO1-δ were determined by Rietveld refinements of the neutron powder diffraction data, and the selected crystal structural parameters were obtained from the estimation of the bond lengths. The La and Nd series differ in a doping dependence of the thickness of the FeAs layer, which is determined by the distance between the As sites and the plane through the Fe sites. This As-Feplane distance increases more rapidly in the Nd-based compounds than in the La-based compounds. The As-Fe-As bond angle of the Nd-based compounds, which is shown in the inset of Fig. 31, varies more rapidly with increasing oxygen deficiency. The FeAs4 tetrahedron approaches a regular tetrahedron in which the angle is 109.47∘. Figure 31 shows the relationship between the As-Fe-As bond angle and in various pnictide superconductors. The parameters of the samples showing an almost maximum in each system are selected to eliminate the effect of carrier doping. It was revealed that becomes maximum when the FeAs4 lattice forms a regular tetrahedron. A similar conclusion was also derived by Zhao et al.. They found a good correlation between and Fe-As/P-Fe angle in the “1111” compounds[58], suggesting that the structural perfection of the Fe-As tetrahedron is important for high- superconductivity. These findings suggest that local symmetry around the Fe and As is the crucial parameter controlling .
4 Theoretical models
Up to now, many theoretical studies of the iron-pnictide superconductors have been reported. As for the superconducting pairing state, most of them have proposed the -pairing state. Here, we introduce two early works suggesting the -pairing state, which were reported just after the discovery of the superconductors
Mazin et al. argued that superconductivity realized in the iron-pnictide compounds is unconventional and mediated by antiferromagnetic spin fluctuations. Its pairing state is an extended -wave pairing with a sign reversal of the order parameter between different Fermi surface sheets[122]. They claimed that doped LaFeAsO represents the first example of multigap superconductivity with a discontinuous sign change in order parameter between the bands, which is principally different from the multi-band -wave superconductivity discovered in MgB2. Their scenario is based on the calculated Fermi surfaces for undoped LaFeAsO, which is shown in Fig. 6, and the superconductivity is induced by the nesting-related antiferromagnetic spin fluctuations near the wave vectors connecting the electron and hole pockets.
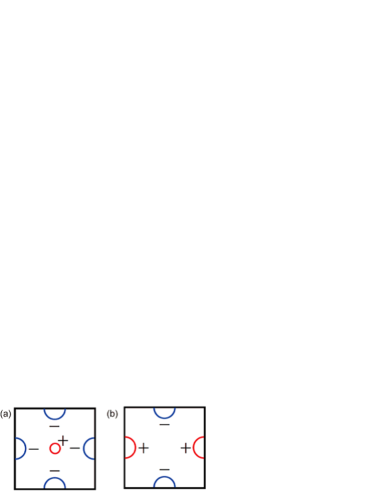
Kuroki et al. constructed a minimal model, where all the necessary five -bands are included, and calculated spin and charge susceptibilities within random phase approximation[123]. Furthermore, they investigated superconducting properties using the linearized Eliashberg equation, and concluded that the multiple spin-fluctuation modes arising from the nesting across the disconnected Fermi surfaces realize an extended -wave pairing, in which the gap changes sign between the hole and electron Fermi surfaces across the nesting vector. This unconventional -wave pairing is the same as the state proposed by Mazin et al., which is schematically shown in Fig. 32(a). Kuroki et al. also suggest that a -wave pairing, in which the gap changes sign between the electron Fermi surfaces as shown in Fig. 32(b), can also be another candidate, if the hole Fermi surfaces around are absent (or less effective). To identify the mechanism of iron-pnictide superconductivity, the determination of the presence or absence of nodes in the superconducting gap is quite important.
In the above pairing mechanisms, the antiferromagnetic fluctuations with the stripe-type correlation, which originate from the nesting between the hole- and electron Fermi surfaces, play an important role in superconductivity in the FeAs compounds. However, as shown in , the highest was observed in LaFeAs(O1-xFx) when the low-energy ( mK order) antiferromagnetic fluctuations probed with the NMR measurements are suppressed over the entire -space. The NMR results indicate the absence of magnetic fluctuations in the low-energy region in the high- samples and is considered to be incompatible with the above scenarios. However, when the characteristic magnetic fluctuations exceed the energy window of NMR measurements, the NMR measurements might be unable to detect the magnetic fluctuations with such high energies. Therefore, inelastic neutron-scattering measurements, which can investigate the energy and dependences of magnetic fluctuations, are important for fully understanding the relationship between magnetic fluctuations and superconductivity.
Quite recently, Ikeda has investigated the interplay between magnetic fluctuations and superconductivity in the effective five-band Hubbard model by the fluctuation-exchange approximation[88]. It was shown by solving the superconducting Eliashberg equation that the most probable candidate for pairing symmetry is the sign-changed -wave spin-singlet state. In addition, he showed that the eigenvalue is not so sensitive to carrier doping, and seems to be irrelevant with antiferromagnetic spin fluctuations if Hund’s coupling is reasonably small. In this case, the correlation between and the antiferromagnetic fluctuations are weak and then is insensitive to carrier doping, in agreement with the experimental results. In his scenario, in addition to the magnetic fluctuations, the correlation between spins and spin quadrupoles cooperatively contributes to the pairing interaction.
5 Summary
On the basis of the above experimental results. we summarize the physical properties of iron-pnictide superconductors.
-
1.
The parent compounds of iron-pnictide superconductors show metallic behavior in electric resistivity, differently from the insulating parent compounds of cuprate superconductors. In addition, the tetragonal- orthorhombic transition and antiferromagnetic transition were observed at and . In FeAsO ( : rare-earth elements), is slightly higher than , and the magnetic transition seems to be induced by the structural transition. In the Fe2As2 (: Ba, Ca, and Eu), two transitions occur simultaneously with a first-order character. The antiferromagnetic vectors are in the unfolded Brillouin zone, which corresponds to a stripe-type magnetic structure. The relationship between the structural transition and spin-density-wave type antiferromagntic transition is a key issue for understanding the mechanism of the magnetic order in the parent compounds.
-
2.
The magnetic ordering in the undoped “1111” compounds is suppressed by F-doping or oxygen deficiency, both of which correspond to electron doping. Superconductivity emerges when 3% F is doped to the oxygen site in LaFeAs(O1-xFx), and is nearly unchanged up to 14 % with a maximum K at approximately F11%. The “122”-structure Fe2As2 becomes superconducting with hole doping by the partial substitution of the site with monovalent (()Fe2As2) ( = Ba, Sr, Ca, = K, Cs, Na), and by electron doping via partial substitution of cobalt for iron ((Fe1-xCox)2As2). Superconductivity was also observed in electron-doped (Fe1-xCox)AsF ( = Ca and Sr) with the “1111”structure.
-
3.
The multiband properties of Fermi surfaces suggested by the band calculations have been confirmed by the ARPES measurements of single crystals of NdFeAs(O1-xFx) and (Ba1-xKx)Fe2As2. The characteristic wave vectors in the antiferromagnetic state seem to originate from the nesting between hole and electron Fermi pockets.
-
4.
The superconducting anisotropy of is rather small (4.3 and 2 in single-crystal NdFeAs(O1-xFx) and (Ba1-xKx)Fe2As2, respectively). This is quite different from the two-dimensional superconductivity observed in cuprate and organic superconductors.
-
5.
The ARPES measurements of (Ba1-xKx)Fe2As2 reveal the presence of two superconducting gaps with different values: a larger gap (12meV) on the small hole-like and electron-like Fermi surface sheets, and a smaller gap (6meV) on the larger hole-like Fermi surface sheet. These gaps are nearly isotropic without nodes, and close simultaneously at the bulk . The isotropic gap was also suggested from the measurements of penetration depth with microwave and SR measurements.
-
6.
From the Knight-shift measurements in the superconducting state, the symmetry of the superconducting pairing is concluded to be in the spin-singlet state. in the superconducting state shows the absence of a coherence peak just below and the temperature dependence down to . The dependence in the La-based “1111” compounds suggests highly anisotropic superconducting gaps with gap-zero regions along lines, which contradicts with the isotropic-gap state suggested from other experiments. The absence of the coherence peak in just below can be interpreted in terms of the wave model.
-
7.
From the measurements of the undoped LaFeAsO and BaFe2As2, the stripe-type magnetic fluctuations revealed by the neutron-scattering experiments are shown. From the F concentration and temperature dependences of , the low-energy magnetic fluctuations are strongly suppressed by electron doping, and the pseudogap behavior is observed in for LaFeAs(O1-xFx) and LaFeAsO1-δ with the maximum . in LaFeAs(O1-xFx) significantly depends on F-concentration, whereas is insensitive to within a range from 0.04 to 0.14. This suggests that the low-energy spin fluctuations detected at do not play an important role in superconductivity of the iron-pnictide compounds.
-
8.
From the measurements of LaFeAs(O1-xFx), the pseudogap behavior becomes pronounced with F (electron)-doping. The doping dependence of the psuedogap behavior is opposite to that observed in the cuprate superconductors, in which the pseudogap behavior is significant in the underdoped region. It is considered that the pseudogap behavior is not ascribed to the antiferromagnetic correlations discussed in the cuprates, but to the character of the band structure near in iron-pnictide superconductors.
-
9.
The neutron diffraction measurements revealed that becomes maximum when FeAs4 forms a regular tetrahedron or when the Fe-As/P-Fe angle approaches 109.4∘. In addition, it was reported that the iron isotope component was estimated to be approximately 0.4 (although more data showing the variation in in several experimental runs are highly desired), being close to 0.5 for the full isotope effect in the framework of the BCS theory, and that the oxygen-isotope effect is much smaller than the iron-isotope effect, indicative of the FeAs layer being responsible for superconductivity. These data suggest that the local geometry around Fe and As is related to superconductivity, particularly the local electron-phonon interaction originating from iron atoms.
Acknowledgment
One of the authors (Y. N.) is financially supported as a JSPS Research Fellow. The authors were supported by a Grant-in-Aid for “Transformative Research-project on Iron Pnictides (TRIP)” from Japan Science and Technology Agency (JST), a Grant-in-Aid for Scientific Research on Innovative Areas ”Heavy Electrons” (No. 20102006) from The Ministry of Education, Culture, Sports, Science, and Technology (MEXT) of Japan, a Grant-in-Aid for the Global COE Program “The Next Generation of Physics, Spun from Universality and Emergence” from MEXT of Japan, and the Grants-in-Aid for Scientific Research from Japan Society for Promotion of Science (JSPS).
References
- [1] Y. Kamihara, T. Watanabe, M. Hirano, and H. Hosono: J. Am. Chem. Soc. 130 (2008) 3296.
- [2] H. Takahashi, K. Igawa, K. Arii, Y. Kamihara, M. Hirano, and H. Hosono: Nature 453 (2008) 376.
- [3] X. H. Chen, T. Wu, G. Wu, R. H. Liu, H. Chen, and D. F. Fang: Nature 453 (2008) 761.
- [4] Z.-A. Ren, J. Yang, W. Lu, W. Yi, X.-L. Shen, Z.-C. Li, G.-C. Che, X.-L. Dong, L.-L. Sun, F. Zhou, and Z.-X. Zhao: Europhys. Lett. 82 (2008) 57002.
- [5] Z.-A. Ren, J. Yang, W. Lu, W. Yi, G.-C. Che, X.-L. Dong, L.-L. Sun, and Z.-X. Zhao: Materials Research Innovations 12 (2008) 106.
- [6] P. Cheng, L. Fang, H. Yang, X. Zhu, G. Mu, H. Luo, Z. Wang, and H.-H. Wen: Science in China G 51 (2008) 719.
- [7] M. Rotter, M. Tegel, D. Johrendt, I. Schellenberg, W. Hermes, and R. Pöttgen: Phys. Rev. B 78 (2008) 020503.
- [8] X.C.Wang, Q. Liu, Y. Lv, W. Gao, L.X.Yang, R.C.Yu, F.Y.Li, and C. Jin: Solid. State. Comm. 148 (2008) 538.
- [9] F.-C. Hsu, J.-Y. Luo, K.-W. Yeh, T.-K. Chen, T.-W. Huang, P. M. Wu, Y.-C. Lee, Y.-L. Huang, Y.-Y. Chu, D.-C. Yan, and M.-K. Wu: Proc. Nat. Acad. Sci.(USA) 105 (2008) 14262.
- [10] R. Pottgen and D. Johrendt: Z. Naturforsch. 63b (2008) 1135.
- [11] H. Kito, H. Eisaki, and A. Iyo: J. Phys. Soc. Jpn. 77 (2008) 063707.
- [12] Z.-A. Ren, W. Lu, J. Yang, W. Yi, X.-L. Shen, Z.-C. Li, G.-C. Che, X.-L. Dong, L.-L. Sun, F. Zhou, and Z.-X. Zhao: Chin. Phys. Lett. 25 (2008) 2215.
- [13] S. Matsuishi, Y. Inoue, T. Nomura, H. Yanagi, M. Hirano, and H. Hosono: J. Am. Chem. Soc. 130 (2008) 14428.
- [14] S. Matsuishi, Y. Inoue, T. Nomura, M. Hirano, and H. Hosono: J. Phys. Soc. Jpn 77 (2008) 113709.
- [15] G. F. Chen, Z. Li, D. Wu, G. Li, W. Z. Hu, J. Dong, P. Zheng, J. L. Luo, and N. L. Wang: Phys. Rev. Lett. 100 (2008) 247002.
- [16] J.-W. G. Bos, G. B. S. Penny, J. A. Rodgers, D. A. Sokolov, A. D. Huxley, and J. P. Attfield: Chem. Commun. 31 (2008) 3634.
- [17] F. Steglich, J. Aarts, C. D. Bredl, W. Lieke, D. Meschede, W. Franz, and H. Schäfer: Phys. Rev. Lett. 43 (1979) 1892.
- [18] M. Rotter, M. Tegel, and D. Johrendt: Phys. Rev. Lett. 101 (2008) 107006.
- [19] K. Sasmal, B. Lv, B. Lorenz, A. M. Guloy, F. Chen, Y.-Y. Xue, and C.-W. Chu: Phys. Rev. Lett. 101 (2008) 107007.
- [20] A. S. Sefat, R. Jin, M. A. McGuire, B. C. Sales, D. J. Singh, and D. Mandrus: Phys. Rev. Lett. 101 (2008) 117004.
- [21] H. Chen, Y. Ren, Y. Qiu, W. Bao, R. H. Liu, G. Wu, T. Wu, Y. L. Xie, X. F. Wang, Q. Huang, and X. H. Chen: Europhys. Lett. 85 (2009) 17006.
- [22] X. F. Wang, T. Wu, G. Wu, H. Chen, R. H. Liu, H. Chen, Y. L. Xie, and X. H. Chen: arXiv:0811.2920 (2008) .
- [23] A. A. Aczel, E. Baggio-Saitovitch, S. L. Budko, P. C. Canfield, J. P. Carlo, G. F. Chen, P. Dai, T. Goko, W. Z. Hu, G. M. Luke, J. L. Luo, N. Ni, D. R. Sanchez-Candela, F. F. Tafti, N. L. Wang, T. J. Williams, W. Yu, and Y. J. Uemura: Phys. Rev. B 78 (2008) 214503.
- [24] H. Luetkens, H. H. Klauss, M. Kraken, F. J. Litterst, T. Dellmann, R. Klingeler, C. Hess, R. Khasanov, A. Amato, C. Baines, J. Hamann-Borrero, N. Leps, A. Kondrat, G. Behr, J. Werner, and B. Buechner: arXiv:0806.3533 (2008) .
- [25] S. Takeshita, R. Kadono, M. Hiraishi, M. Miyazaki, A. Koda, Y. Kamihara, , and H. Hosono: J. Phys. Soc. Jpn. 77 (2008) 103703.
- [26] S. Takeshita, R. Kodono, M. Hiraishi, M. Miyazaki, A. Koda, S. Matsuishi, and H. Hosono: arXiv:0812.1670 (2008) .
- [27] S. Takeshita and R. Kadono: arXiv:0812.2323v2 (2009) .
- [28] P. L. Alireza, Y. T. C. Ko, J. Gillett, C. M. Petrone, J. M. Cole, G. G. Lonzarich, and S. E. Sebastian: J. Phys.: Condensed Matter 21 (2009) 012208.
- [29] H. Kotegawa, H. Sugawara, and H. Tou: J. Phys. Soc. Jpn. 78 (2009) 013709.
- [30] H. Fukazawa, N. Takeshita, T. Yamazaki, K. Kondo, K. Hirayama, Y. Kohori, K. Miyazawa, H. Kito, H. Eisaki, and A. Iyo: J. Phys. Soc. Jpn. 77 (2008) 105004.
- [31] J. H. Tapp, Z. Tang, B. Lv, K. Sasmal, B. Lorenz, P. C. W. Chu, and A. M. Guloy: Phys. Rev. B 78 (2008) 060505.
- [32] M. J. Pitcher, D. R. Parker, P. Adamson, S. J. C. Herkelrath, A. T. Boothroyd, R. M. Ibberson, M. Brunelli, and S. J. Clarke: Chem. Commun. (2008) 5918.
- [33] D. R. Parker, M. J. Pitcher, and S. J. Clarke: arXiv:0810.3214 (2008) .
- [34] Y. Mizuguchi, F. Tomioka, S. Tsuda, T. Yamaguchi, and Y. Takano: Appl. Phys. Lett. 93 (2008) 152505.
- [35] K.-W. Yeh, T.-W. Huang, Y. lin Huang, T.-K. Chen, F.-C. Hsu, P. M. Wu, Y.-C. Lee, Y.-Y. Chu, C.-L. Chen, J.-Y. Luo, D.-C. Yan, and M.-K. Wu: Europhys. Lett. 84 (2008) 37002 (4pp).
- [36] C. de la Cruz, Q. Huang, J. W. Lynn, J. Li, W. R. II, J. L. Zarestky, H. A. Mook, G. F. Chen, J. L. Luo, N. L. Wang, and P. Dai: Nature 453 (2008) 899.
- [37] S. Margadonna, Y. Takabayashi, M. T. McDonald, K. Kasperkiewicz, Y. Mizuguchi, Y. Takano, A. N. Fitch, E. Suard, and K. Prassides: Chem. Commun. (2008) 5607.
- [38] Y. Kamihara, H. Hiramatsu, M. Hirano, R. Kawamura, H. Yanagi, T. Kamiya, and H. Hosono: J. Am. Chem. Soc. 128 (2006) 10012.
- [39] S. Lebègue: Phys. Rev. B 75 (2007) 035110.
- [40] A. Coldea, J. Fletcher, A. Carrington, J. Analytis, A. Bangura, J.-H. Chu, A. Erickson, I. Fisher, N. Hussey, and R. McDonald: Phys. Rev. Lett. 101 (2008) 216402.
- [41] H. Sugawara, R. Settai, Y. Doi, H. Muranaka, K. Katayama, H. Yamagami, and Y. Onuki: J. Phys. Soc. Jpn. 77 (2008) 113711.
- [42] D. J. Singh and M.-H. Du: Phys. Rev. Lett. 100 (2008) 237003.
- [43] K. Nakamura, R. Arita, and M. Imada: J. Phys. Soc. Jpn. 77 (2008) 093711.
- [44] D. J. Singh: Phys. Rev. B 78 (2008) 094511.
- [45] F. Ma and Z.-Y. Lu: Phys. Rev. B 78 (2008) 033111.
- [46] J. Dong, H. J. Zhang, G. Xu, Z. Li, G. Li, W. Z. Hu, D. Wu, G. F. Chen, X. Dai, J. L. Luo, Z. Fang, and N. L. Wang: Europhys. Lett. 83 (2008) 27006.
- [47] A. S. Sefat, M. A. McGuire, B. C. Sales, R. Jin, J. Y. Howe, and D. Mandrus: Phys. Rev. B 77 (2008) 174503.
- [48] K. Kadowaki and S. B. Woods: Solid State Physics 58 (1986) 507.
- [49] K. Hashimoto, T. Shibauchi, T. Kato, K. Ikada, R. Okazaki, H. Shishido, M. Ishikado, H. Kito, A. Iyo, H. Eisaki, S. Shamoto, and Y. Matsuda: Phys. Rev. Lett. 102 (2009) 017002.
- [50] T. Nomura, S. W. Kim, Y. Kamihara, M. Hirano, P. V. Sushko, K. Kato, M. Takata, A. L. Shluger, and H. Hosono: Supercond. Sci. Technol. 21 (2008) 125028.
- [51] S. Ishibashi, K. Terakura, and H. Hosono: J. Phys. Soc. Jpn. 77 (2008) 053709.
- [52] T. Yildirim: Phys. Rev. Lett. 101 (2008) 057010.
- [53] Q. Si and E. Abrahams: Phys. Rev. Lett. 101 (2008) 076401.
- [54] H.-H. Klauss, H. Luetkens, R. Klingeler, C. Hess, F. J. Litterst, M. Kraken, M. M. Korshunov, I. Eremin, S.-L. Drechsler, R. Khasanov, A. Amato, J. Hamann-Borrero, N. Leps, A. Kondrat, G. Behr, J. Werner, and B. Büchner: Phys. Rev. Lett. 101 (2008) 077005.
- [55] S. Kitao, Y. Kobayashi, S. Higashitaniguchi, M. Saito, Y. Kamihara, M. Hirano, T. Mitsui, H. Hosono, and M. Seto: J. Phys. Soc. Jpn. 77 (2008) 103706.
- [56] Y. Nakai, K. Ishida, Y. Kamihara, M. Hirano, and H. Hosono: J. Phys. Soc. Jpn. 77 (2008) 073701.
- [57] D. E. MacLaughlin, J. P. Vithayathil, H. B. Brom, J. C. J. M. de Rooy, P. C. Hammel, P. C. Canfield, A. P. Reyes, Z. Fisk, J. D. Thompson, and S.-W. Cheong: Phys. Rev. Lett. 72 (1994) 760.
- [58] J. Zhao, Q. Huang, C. de la Cruz, S. Li, J. W. Lynn, Y. Chen, M. A. Green, G. F. Chen, G. Li, Z. Li, J. L. Luo, N. L. Wang, and P. Dai: Nature Materials 7 (2008) 953.
- [59] J. Zhao, Q. Huang, C. de la Cruz, J. W. Lynn, M. D. Lumsden, Z. A. Ren, J. Yang, X. Shen, X. Dong, Z. Zhao, and P. Dai: Phys. Rev. B 78 (2008) 132504.
- [60] Y. Qiu, W. Bao, Q. Huang, T. Yildirim, J. Simmons, J. Lynn, Y. Gasparovic, J. Li, M. Green, T. Wu, G. Wu, and X. Chen: Phys. Rev. Lett. 101 (2008) 257002.
- [61] Y. Xiao, Y. Su, R. Mittal, T. Chatterji, T. Hansen, C. M. N. Kumar, S. Matsuishi, H. Hosono, and T. Brueckel: Phys. Rev. B 79 (2008) 060504 (R).
- [62] P. J. Baker, I. Franke, T. Lancaster, S. J. Blundell, L. Kerslake, and S. J. Clarke: Phys. Rev. B 79 (2009) 060402(R).
- [63] A. I. Goldman, D. N. Argyriou, B. Ouladdiaf, T. Chatterji, A. Kreyssig, S. Nandi, N. Ni, S. L. Bud’ko, P. C. Canfield, and R. J. McQueeney: Phys. Rev. B 78 (2008) 100506.
- [64] J. Zhao, W. Ratcliff, II, J. W. Lynn, G. F. Chen, J. L. Luo, N. L. Wang, J. Hu, and P. Dai: Phys. Rev. B 78 (2008) 140504.
- [65] A. Jesche, N. Caroca-Canales, H. Rosner, H. Borrmann, A. Ormeci, D. Kasinathan, H. H. Klauss, H. Luetkens, R. Khasanov, A. Amato, A. Hoser, K. Kaneko, C. Krellner, and C. Geibel: Phys. Rev. B 78 (2008) 180504.
- [66] Q. Huang, Y. Qiu, W. Bao, J. Lynn, M. Green, Y. Chen, T. Wu, G. Wu, and X. Chen: Phys. Rev. Lett. 101 (2008) 257003.
- [67] A. Kondrat, J. E. Hamann-Borrero, N. Leps, M. Kosmala, O. Schumann, J. Werner, G. Behr, M. Braden, R. Klingeler, B. Buchner, and C. Hess: arXiv:0811.4436 (2008) .
- [68] K. Kitagawa, N. Katayama, K. Ohgushi, M. Yoshida, and M. Takigawa: J. Phys. Soc. Jpn. 77 (2008) 114709.
- [69] Y. Chen, J. W. Lynn, J. Li, G. Li, G. F. Chen, J. L. Luo, N. L. Wang, P. Dai, C. dela Cruz, and H. A. Mook: Phys. Rev. B 78 (2008) 064515.
- [70] C. Liu, T. Kondo, M. E. Tillman, R. Gordon, G. D. Samolyuk, Y. Lee, C. Martin, J. L. McChesney, S. Bud’ko, M. A. Tanatar, E. Rotenberg, P. C. Canfield, R. Prozorov, B. N. Harmon, and A. Kaminski: arXiv:0806.2147 (2008) .
- [71] H. Ding, P. Richard, K. Nakayama, K. Sugawara, T. Arakane, Y. Sekiba, A. Takayama, S. Souma, T. Sato, T. Takahashi, Z. Wang, X. Dai, Z. Fang, G. F. Chen, J. L. Luo, , and N. L. Wang: Europhys. Lett. 83 (2008) 47001.
- [72] L. Zhao, H. Liu, W. Zhang, J. Meng, X. Jia, G. Liu, X. Dong, G. F. Chen, J. L. Luo, N. L. Wang, G. Wang, Y. Zhou, Y. Zhu, X. Wang, Z. Zhao, Z. Xu, C. Chen, and X. J. Zhou: Chin. Phys. Lett. 25 (2008) 4402.
- [73] C. Liu, G. D. Samolyuk, Y. Lee, N. Ni, T. Kondo, A. F. Santander-Syro, S. L. Bud’ko, J. L. McChesney, E. Rotenberg, T. Valla, A. V. Fedorov, P. C. Canfield, B. N. Harmon, and A. Kaminski: Phys. Rev. Lett. 101 (2008) 177005.
- [74] H. Liu, W. Zhang, L. Zhao, X. Jia, J. Meng, G. Liu, X. Dong, G. F. Chen, J. L. Luo, N. L. Wang, W. Lu, G. Wang, Y. Zhou, Y. Zhu, X. Wang, Z. Xu, C. Chen, and X. J. Zhou: Phys. Rev. B 78 (2008) 184514.
- [75] L. X. Yang, Y. Zhang, H. W. Ou, J. F. Zhao, D. W. Shen, B. Zhou, J. Wei, F. Chen, M. Xu, C. He, Y. Chen, Z. D. Wang, X. F. Wang, T. Wu, G. Wu, X. H. Chen, M. Arita, K. Shimada, M. Taniguchi, Z. Y. Lu, T. Xiang, and D. L. Feng: arXiv:0806.2627 (2008) .
- [76] Y. Zhang, J. Wei, H. W. Ou, J. F. Zhao, B. Zhou, F. Chen, M. Xu, C. He, G. Wu, H. Chen, M. Arita, K. Shimada, H. Namatame, M. Taniguchi, X. H. Chen, and D. L. Feng: arXiv:0808.2738 (2008) .
- [77] H. Ding, K. Nakayama, P. Richard, S. Souma, T. Sato, T. Takahashi, M. Neupane, Y.-M. Xu, Z.-H. Pan, A. Federov, Z. Wang, X. Dai, Z. Fanga, G. Chen, J. Luo, and N. Wang: arXiv:0812.0534 (2008) .
- [78] T. Sato, K. Nakayama, Y. Sekiba, P. Richard, Y.-M. Xu, S. Souma, T. Takahashi, G. Chen, J. L. Luo, N. Wang, and H. Ding: arXiv:0810.3047 (2008) .
- [79] Y. Kohama, Y. Kamihara, M. Hirano, H. Kawaji, T. Atake, and H. Hosono: Phys. Rev. B 78 (2008) 020512(R).
- [80] R. Klingeler, N. Leps, I. Hellmann, A. Popa, C. Hess, A. Kondra, J. Hamann-Borrero, G. Behr, V. Kataev, and B. Buechner: arXiv:0808.0708v1 (2008) .
- [81] K. Ahilan, F. L. Ning, T. Imai, A. S. Sefat, R. Jin, M. A. McGuire, B. C. Sales, and D. Mandrus: Phys. Rev. B 78 (2008) 100501(R).
- [82] H.-J. Grafe, D. Paar, G. Lang, N. J. Curro, G. Behr, J. Werner, J. Hamann-Borrero, C. Hess, N. Leps, R. Klingeler, and B. Büchner: Physi. Rev. Lett. 101 (2008) 047003.
- [83] T. Imai, K. Ahilan, F. Ning, M. A. McGuire, A. S. Sefat, R. Jin, B. C. Sales, and D. Mandrus: J. Phys. Soc. Jpn. 77 Suppl. C (2008) 47.
- [84] H. Mukuda, N. Terasaki, H. Kinouchi, M. Yashima, Y. Kitaoka, S. Suzuki, S. Miyasaka, S. Tajima, K. Miyazawa, P. Shirage, H. Kito, H. Eisaki, and A. Iyo: J. Phys. Soc. Jpn. 77 (2008) 093704.
- [85] N. Terasaki, H. Mukuda, M. Yashima, Y. Kitaoka, K. Miyazawa, P. M. Shirage, H. Kito, H. Eisaki, and A. Iyo: J. Phys. Soc. Jpn. 78 (2009) 013701.
- [86] Y. Nakai, S. Kitagawa, K. Ishida, Y. Kamihara, M. Hirano, and H. Hosono: arXiv:0810.3569 (2008) .
- [87] M. Takigawa, A. P. Reyes, P. C. Hammel, J. D. Thompson, R. Heffner, Z. Fisk, and K.C.Ott: Phys. Rev. B 43 (1991) 247.
- [88] H. Ikeda: J. Phys. Soc. Jpn. 77 (2008) 123707.
- [89] H. Fukazawa, K. Hirayama, K. Kondo, T. Yamazaki, Y. Kohori, N. Takeshita, K. Miyazawa, H. Kito, H. Eisaki, and A. Iyo: J. Phys. Soc. Jpn. 77 (2008) 093706.
- [90] S. H. Baek, T. Klimczuk, F. Ronning, E. D. Bauer, N. J. Curro, and J. D. Thompson: Phys. Rev. B 78 (2008) 212509.
- [91] F. L. Ning, K. Ahilan, T. Imai, A. S. Sefat, R. Jin, M. A. McGuire, B. C. Sales, and D. Mandrus: J. Phys. Soc. Jpn. 77 (2008) 103705.
- [92] F. L. Ning, K. Ahilan, T. Imai, A. S. Sefat, R. Jin, M. A. McGuire, B. C. Sales, and D. Mandrus: J. Phys. Soc. Jpn. 78 (2009) 013711.
- [93] F. Hunte, J. Jaroszynski, A. Gurevich, D. C. Larbalestier, R. Jin, A. S. Sefat, M. A. McGuire, B. C. Sales, D. K. Christen, and D. Mandrus: Nature 453 (2008) .
- [94] U. Welp, R. Xie, A. E. Koshelev, W. K. Kwok, P. Cheng, L. Fang, and H.-H. Wen: Phys. Rev. B 78 (2008) 140510(R).
- [95] N. R. Werthamer, E. Helfand, and P. C. Hohenberg: Phys. Rev. 147 (1966) 295.
- [96] H. Q. Yuan, J. Singleton, F. F. Balakirev, G. F. Chen, J. L. Luo, and N. L. Wang: Nature 457 (2009) 565.
- [97] Z.-S. Wang, H.-Q. Luo, C. Ren, and H.-H. Wen: Phys. Rev. B 78 (2008) 140501.
- [98] Y. Jia, P. Cheng, L. Fang, H. Luo, H. Yang, C. Ren, L. Shan, C. Gu, and H.-H. Wen: Appl. Phys. Lett. 93 (2008) 032503.
- [99] J. Jaroszynski, F. Hunte, L. Balicas, Y. jung Jo, I. Raičević, A. Gurevich, D. C. Larbalestier, F. F. Balakirev, L. Fang, P. Cheng, Y. Jia, and H. H. Wen: Phys. Rev. B 78 (2008) 174523.
- [100] M. Altarawneh, K. Collar, C. H. Mielke, N. Ni, S. L. Bud’ko, and P. Canfield: arXiv:0807.4488 (2008) .
- [101] T. Kondo, A. F. Santander-Syro, O. Copie, C. Liu, M. E. Tillman, E. D. Mun, J. Schmalian, S. L. Bud’ko, M. A. Tanatar, P. C. Canfield, and A. Kaminski: Phys. Rev. Lett. 101 (2008) 147003.
- [102] L. Malone, J. Fletcher, A. Serafi, A. Carrington, N. Zhigadlo, Z. Bukowski, S. Katrych, and J. Karpinski: arXiv:0806.3908 (2008) .
- [103] C. Martin, R. T. Gordon, M. A. Tanatar, M. D. Vannette, M. E. Tillman, E. D. Mun, P. C. Canfield, V. G. Kogan, G. D. Samolyuk, J. Schmalian, and R. Prozorov: arXiv:0807.0876 (2008) .
- [104] K. Hashimoto, T. Shibauchi, S. Kasahara, K. Ikada, T. Kato, R. Okazaki, C. J. van der Beek, M. Konczykowski, H. Takeya, T. Terashimas, and Y. Matsuda: arXiv:0810.3506 (2008) .
- [105] M. Hiraishi, R. Kadono, S. Takeshita, M. Miyazaki, A. Koda, H. Okabe, and J. Akimitsu: J. Phys. Soc. Jpn. 78 (2008) 023710.
- [106] K. Matano, Z. A. Ren, X. L. Dong, L. L. Sun, Z. X. Zhao, and G. qing Zheng: Euro. Phys. Lett. 83 (2008) 57001.
- [107] S. Kawasaki, K. Shimada, G. F. Chen, J. L. Luo, N. L. Wang, and G. qing Zheng: Phys. Rev. B 78 (2008) 220506 (R).
- [108] H.-J. Grafe, G. Lang, F. Hammerath, D. Paar, K. Manthey, K. Koch, H. Rosner, N. J. Curro, G. Behr, J. Werner, N. Leps, R. Klingeler, and B. Buchner: arXiv:0811.4508 (2008) .
- [109] H. Kotegawa, S. Masaki, Y. Awai, H. Tou, Y. Mizuguchi, and Y. Takano: J. Phys. Soc. Jpn. 77 (2008) 113703.
- [110] K. Ishida, H. Mukuda, Y. Kitaoka, Z. Q. Mao, Y. Mori, and Y. Maeno: Phys. Rev. Lett. 84 (2000) 5387.
- [111] N. J. Curro, T. Calwell, E. D. Bauer, L. A. Morales, M. J. Graf, Y. Bang, A. V. Balatsky, J. D. Thompson, and J. L. Sarrao: Nature 434 (2005) 622.
- [112] G.-q. Zheng, H. Ozaki, Y. Kitaoka, P. Kuhns, A. P. Reyes, and W. G. Moulton: Phys. Rev. Lett. 88 (2002) 077003.
- [113] D. Parker, O. V. Dolgov, M. M. Korshunov, A. A. Golubov, and I. I. Mazin: Phys. Rev. B 78 (2008) 134524.
- [114] A. V. Chubukov, D. V. Efremov, and I. Eremin: Phys. Rev. B 78 (2008) 134512.
- [115] M. M. Parish, J. Hu, and B. A. Bernevig: Phys. Rev. B 78 (2008) 144514.
- [116] Y. Bang and H.-Y. Choi: 79 .
- [117] Y. Nagai, N. Hayashi, N. Nakai, H. Nakamura, M. Okumura, and M. Machida: New J. Phys. 10 (2008) 103026.
- [118] A. Kawabata, S. C. Lee, T. Moyoshi, Y. Kobayashi, and M. Sato: J. Phys. Soc. Jpn 77 (2008) 103704.
- [119] R. H. Liu, T. Wu, G. Wu, H. Chen, X. F. Wang, Y. L. Xie, J. J. Yin, Y. J. Yan, Q. J. Li, B. C. Shi, W. S. Chu, Z. Y. Wu, and X. H. Chen: arXiv:0810.2694 (2008) .
- [120] C. J. Zhang, H. Oyanagi, Z. H. Sun, Y. Kamihara, and H. Hosono: Phys. Rev. B 78 (2008) 214513.
- [121] C.-H. Lee, A. Iyo, H. Eisaki, H. Kito, M. T. Fernandez-Diaz, T. Ito, K. Kihou, H. Matsuhata, M. Braden, and K. Yamada: J. Phys. Soc. Jpn. 77 (2008) 083704.
- [122] I. I. Mazin, D. J. Singh, M. D. Johannes, and M. H. Du: Phys. Rev. Lett. 101 (2008) 057003.
- [123] K. Kuroki, S. Onari, R. Arita, H. Usui, Y. Tanaka, H. Kontani, and H. Aoki: Phys. Rev. Lett. 101 (2008) 087004.