Ice XV: a new thermodynamically stable phase of ice
Abstract
A new phase of ice, named ice XV, has been identified and its structure determined by neutron diffraction. Ice XV is the hydrogen-ordered counterpart of ice VI and is thermodynamically stable at temperatures below 130 K in the 0.8 to 1.5 GPa pressure range. The regions of stability in the medium pressure range of the phase diagram have thus been finally mapped, with only hydrogen-ordered phases stable at 0 K. The ordered ice XV structure is antiferroelectric (P1̄), in clear disagreement with recent theoretical calculations predicting ferroelectric ordering (Cc).
pacs:
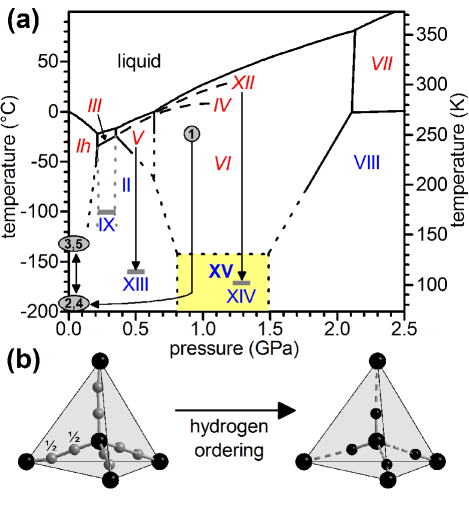
64.60.Cn, 61.05.fm, 64.70.kt, 61.50.KsWhen water freezes, hydrogen-disordered phases of ice crystallize which exhibit orientational disorder of the hydrogen bonded water molecules Pauling (1935); Petrenko and Whitworth (1999). Upon isobaric cooling, these phases are expected to undergo transitions to hydrogen-ordered phases in which the water molecules adopt the energetically most favored orientations (cf. Fig. 1). However, because of the highly cooperative nature of molecular reorientation in ice, the sluggish kinetics of molecular reorientation at low temperatures often prevent these ordering transitions occurring, and the formation of ‘orientational glasses’ is observed instead Suga (1997); Salzmann et al. (2008).
The region in the phase diagram at temperatures below the stability domain of ice VI is still ‘uncharted territory’ (cf. Fig. 1(a)); it is unknown which phase is thermodynamically stable under these conditions Petrenko and Whitworth (1999). Ice VI is hydrogen-disordered, and extending its region of stability down to 0 K would result in the problematic situation that a phase, with configurational entropy greater than zero, would be stable at 0 K. The transition of ice VI to a hydrogen-ordered phase upon cooling would be a way out of this dilemma. Alternatively, it could be that the ice II/VI and ice VI/VIII equilibrium lines meet above 0 K at an ice II/VI/VIII triple point below which the ordered ices II and VIII would be the stable phases Petrenko and Whitworth (1999). Based on unpublished neutron diffraction data, Kamb suggested the formation of a partially hydrogen-ordered ice VI phase Kamb (1973). Also, Johari and Whalley reported observing a very slow transformation upon cooling ice VI Johari and Whalley (1979). However, no diffraction data were obtained in that study. Subsequent neutron diffraction measurements concluded that no significant structural changes were observed when pure ice VI was cooled to low temperatures Kuhs et al. (1984). In agreement with this conclusion, Raman spectroscopic measurements of ice VI at low temperatures also did not reveal the features expected for hydrogen ordering Minceva-Sukarova et al. (1986), even when the sample was doped with potassium hydroxide Minceva-Sukarova et al. (1988), a recipe found to promote hydrogen ordering of ice Ih Tajima et al. (1982). Recently, it was shown that doping the hydrogen-disordered ices V and XII with minute amounts of hydrochloric acid helps maintaining dynamic states to low enough temperatures so that the phase transitions to the hydrogen-ordered ices XIII and XIV could be observed Salzmann et al. (2006).
The ordering processes in ice lead to either ferroelectric structures, with the water dipole moments adding up to yield a net moment, or antiferroelectric structures in which the water dipole moments cancel each other. The existence of ferroelectric ice would have consequences for the geochemistry and mineral physics of icy comets, moons and planets Mitra (2004). So far, one ferroelectric ice phase has been observed experimentally (ice XI) Tajima et al. (1982); Leadbetter et al. (1985). However, computational studies have predicted that the hydrogen-ordered counterpart of ice VI should be ferroelectric as well Knight and Singer (2005); Kuo and Kuhs (2006).
In this Letter we show that hydrochloric acid doped ice VI transforms to a new, hydrogen-ordered phase of ice, named ice XV, upon cooling. The crystal structure of ice XV is determined by neutron diffraction and compared to the computational predictions Knight and Singer (2005); Kuo and Kuhs (2006). Finally, the thermodynamic stability of ice XV is analysed, and the revised phase diagram of water and ice is presented.
DCl doped D2O ice VI samples were prepared by freezing a 0.01 mol L-1 solution and transferring the finely ground sample into a Paris-Edinburgh pressure cell Besson et al. (1992) which was precooled to liquid nitrogen temperature, then pressurized and heated to 250 K at about 0.9 GPa. The crystallization of ice VI was followed in-situ by recording powder neutron diffraction patterns on the PEARL beamline at ISIS. The sample was then slow-cooled to 80 K at 0.2 K min-1 under pressure and the pressure subsequently released (cf. Fig. 1(a)). After this, the sample was recovered from the pressure cell for further analysis on the GEM diffractometer.
Figure 2(a) shows the changes of the lattice constant c upon heating the sample at ambient pressure from 80 K to 138 K. The lattice constant starts to contract at about 124 K upon first heating. This change was found to be reversible upon slow-cooling to 80 K at 0.1 K min-1, with c expanding discontinuously starting at about 130 K. Subsequent heating showed again reversible behavior, and c reached the value obtained after the first heating. The stepwise change upon second heating was almost three times larger than observed upon first heating. It was recently shown that hydrogen order / disorder phase transitions in ices may be accompanied by such discontinuous changes in the lattice constants and that the magnitude of a step correlates with the degree of order in the hydrogen-ordered phase Salzmann et al. (2006, 2007). The behaviour shown in Fig. 2(a) therefore suggests that a hydrogen order / disorder phase transition may be occurring.
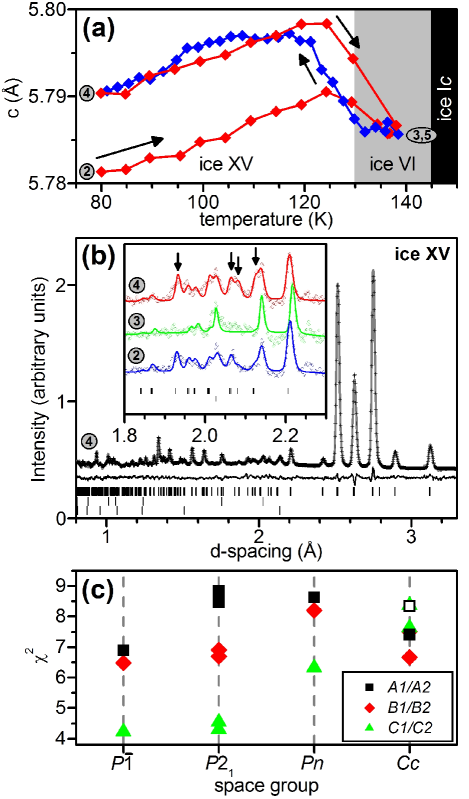
The inset in Fig. 2(b) shows the powder diffraction data recorded between the various heating and cooling steps. For the sample after slow-cooling under pressure, Bragg peaks (indicated by arrows) were observed which are either not permitted by the space group symmetry of ice VI, P42/nmc, or which have zero intensity in that structure. These peaks disappeared upon heating to 138 K and reappeared upon slow-cooling to 80 K. In fact, after slow-cooling at ambient pressure, the new peaks were more intense than after slow-cooling under pressure. In agreement with the changes observed of the lattice constant c (cf. Fig. 2(a)), this further suggests the formation of a more highly hydrogen-ordered structure after slow-cooling at ambient pressure.
The tetragonal unit cell of ice VI comprises ten water molecules belonging to two independent but interpenetrating hydrogen bonded networks (cf. Fig. 3(a)) Petrenko and Whitworth (1999). Hence, the ice VI structure can be regarded as a ‘self-clathrate’ Kamb (1965); Kuhs et al. (1984). The central structural motifs of each network are ‘water hexamers’ which share corners along the crystallographic c direction and are hydrogen bonded to each other along the a and b directions. The P42/nmc space group symmetry requires ice VI to be fully hydrogen disordered, which means that the fractional occupancies of the hydrogen positions are restricted to Kamb (1965); Kuhs et al. (1984). Consequently, any change in hydrogen order has to be associated with breaking of the space group symmetry Kamb (1973).
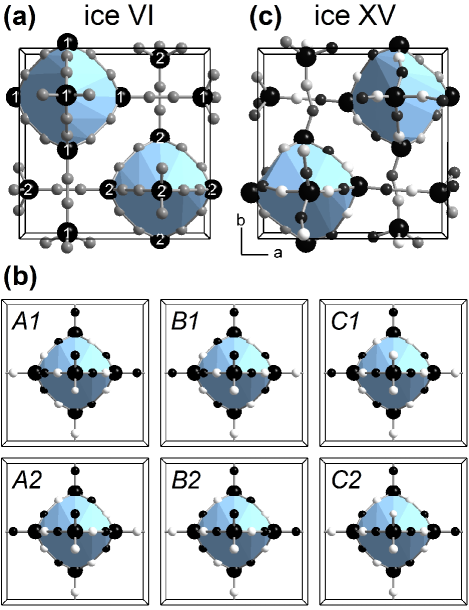
For a single hydrogen bonded network there are six different ways in which the structure can become hydrogen ordered as shown in Fig. 3(b). Due to the chirality of the ordered hexameric units, the structures can be grouped into pairs which are related by mirror symmetry (A1/A2, B1/B2 and C1/C2). The A1/A2 and B1/B2 structures are polarized in the a-b plane only, whereas the C1/C2 structures show additional polarization in the c direction. The space groups which can accommodate two symmetry-related, fully ordered networks are Cc, Pn, P21 and P1̄. Complete cancelation of the polarities of the two networks, and thus antiferroelectrity, is only achieved in P1̄. The other space group symmetries yield ferroelectric structures. Space group Cc can be excluded conclusively due to the presence of a new Bragg peak at 1.93 Å which is forbidden in Cc (cf. inset in Fig. 2(b)). Similarly, the new weak peak at 2.08 Å cannot be indexed in the Pn space group.
Our powder diffraction data collected after slow-cooling at ambient pressure were initially fitted by performing Rietveld refinements using the different possible fully ordered structural models. The values obtained after convergence of the refinements indicate the quality of the fits and are shown in Fig. 2(c). Consistent with the absence of the new Bragg peaks, the structural models with Cc and Pn space group symmetries produce unsatisfactory fits. For the P21 and P1̄ models, a clear preference emerges for ordered structures containing the C1 or C2 enantiomers, either as a true racemate (P1̄) or as a racemic mixture (P21). For the fully ordered structures, the best fits in P21 and P1̄ are of similar quality; however, P1̄ yields a significantly better agreement with the data when the occupancies of the hydrogen atom sites are refined. For the P21 structures, the occupancies of some of the hydrogen positions increased above 1 or fell below 0 during the refinement while others converged close to , behavior which indicates incorrect structural models. We therefore assign P1̄ space group symmetry to the new hydrogen-ordered phase. Unlike P21, space group P1̄ can be obtained by a single irreducible representation of the high-symmetry space group P42/nmc. Therefore, Landau theory Landau and Lifshitz (1958); Franzen (1990) permits a one-step, weakly first order transition such as the one observed here, where the order parameter is a scalar field representing the departure from half occupancy of the hydrogen sites. Out of all the possible ordered structures, the experimental structure contains the most polarized networks (C1 and C2) and its space group symmetry allows for the most effective canceling of the network polarities.
On the basis of the reduced space group symmetry, and the reversible and discontinuous change in the lattice constant, we identify this as a new phase of ice to which we assign the Roman numeral XV. Table I shows the refined atomic site occupancies, which are, consistent with the changes in the lattice constant, more ordered after cooling at ambient pressure than after cooling under pressure, and therefore closer to the thermodynamic limit of complete hydrogen order. The pseudo-orthorhombic unit cell of ice XV with slightly distorted hexameric units is shown in Fig. 3(c).
| atom | U | occ. | |||
|---|---|---|---|---|---|
| O1 | 0.2750 | 0.2515 | 0.2465 | 1.48 | 1 |
| O2 | 0.2351 | 0.5201 | 0.6193 | 1.48 | 1 |
| O3 | 0.2474 | 0.9667 | 0.6206 | 1.48 | 1 |
| O4 | 0.9610 | 0.2394 | 0.8750 | 1.48 | 1 |
| O5 | 0.5254 | 0.2715 | 0.8428 | 1.48 | 1 |
| D8 | 0.4507 | 0.2611 | 0.0172 | 2.28 | 0.853 (0.833) |
| D9 | 0.0279 | 0.2755 | 0.0046 | 2.28 | 0.819 (0.585) |
| D10 | 0.2616 | 0.3493 | 0.3728 | 2.28 | 0.794 (0.666) |
| D11 | 0.2349 | 0.1184 | 0.3358 | 2.28 | 0.901 (0.773) |
| D15 | 0.2844 | 0.6761 | 0.6384 | 2.28 | 0.616 (0.500) |
| D16 | 0.6784 | 0.2568 | 0.8845 | 2.28 | 0.853 (0.733) |
| D18 | 0.3679 | 0.4559 | 0.7073 | 2.28 | 0.804 (0.908) |
| D19 | 0.3866 | 0.0134 | 0.6779 | 2.28 | 0.926 (0.674) |
| D20 | 0.1413 | 0.0444 | 0.7009 | 2.28 | 0.581 (0.594) |
| D24 | 0.0434 | 0.3439 | 0.7612 | 2.28 | 0.634 (0.758) |
Density functional theory approaches have successfully predicted the structure of hydrogen-ordered ice XIV Tribello et al. (2006) and have produced results consistent with the experimental ice XIII structure being the energetic ground state in the appropriate p/T ranges Knight and Singer (2008). To our knowledge, there are two independent computational predictions of the hydrogen-ordered structure of ice XV Knight and Singer (2005); Kuo and Kuhs (2006). Both studies propose that the hydrogen-ordered ground state is ferroelectric with A1 / A2 hydrogen-ordered networks and Cc space group symmetry, which is in clear disagreement with the experimental structure reported here. The reasons for this disagreement are not understood at present.
Upon isobaric cooling, the increase in free energy of a phase correlates with its entropy, . It follows that at temperatures below the ordering temperature (130 K from Fig. 2(a)), hydrogen-ordered ice XV will have a lower free energy than ice VI Sal . Since the ordering transition takes place in what was previously thought to be the stability region of ice VI, the lower temperature part of the ice VI region of stability is now assigned to the stability region of ice XV. The phase boundaries of ice XV with ices II and VIII can be constructed by considering the Clapeyron equation, , which requires approximately vertical phase boundaries between two hydrogen-ordered phases of different density (II/XV and XV/VIII), and approximately horizontal phase boundaries between a hydrogen-disordered and a hydrogen-ordered phase of similar density (VI/XV). The shaded area in Fig. 1(a) indicates the region in the phase diagram in which ice XV is expected to be thermodynamically more stable than any other of the currently known phases.
In summary, we have prepared a new, hydrogen-ordered phase of ice, named ice XV, and solved its crystal structure. Ice XV is antiferroelectric, thermodynamically stable at low temperatures in the 0.8 to 1.5 GPa pressure range and forms upon slow-cooling hydrochloric acid doped ice VI. The revised phase diagram is now finally consistent with only hydrogen-ordered phases of ice being the stable phases at 0 K. The crystal structure of ice XV once again underlines the importance of experimental results to serve as benchmarks for computational models of water and to test their abilities to reproduce the lowest energy states. Such studies could lead to improved theoretical descriptions of the interactions of water with itself, and with more complex inorganic and organic molecules.
We thank the ISIS Facility for access to the PEARL and GEM instruments, M. Tucker and W. Marshall for assistance with the PEARL experiment, B. Slater and G. Tribello for discussions and the Austrian Academy of Sciences for financial support through the APART program (C.G.S.).
References
- Pauling (1935) L. Pauling, J. Am. Chem. Soc. 57, 2680 (1935).
- Petrenko and Whitworth (1999) V. Petrenko and R. Whitworth, Physics of ice (Oxford University Press, 1999).
- Suga (1997) H. Suga, Thermochim. Acta 300, 117 (1997).
- Salzmann et al. (2008) C. Salzmann, P. Radaelli, J. Finney, and E. Mayer, Phys. Chem. Chem. Phys. 10, 6313 (2008).
- Kamb (1973) B. Kamb, in Physics and Chemistry of Ice, edited by E. Whalley, S. Jones, and L. Gold (Royal Society of Canada, 1973).
- Johari and Whalley (1979) G. Johari and E. Whalley, J. Chem. Phys. 70, 2094 (1979).
- Kuhs et al. (1984) W. Kuhs, J. Finney, J. Vettier, and D. Bliss, J. Chem. Phys. 81, 3612 (1984).
- Minceva-Sukarova et al. (1986) B. Minceva-Sukarova, G. Slark, and W. Sherman, J. Mol. Struct. 143, 87 (1986).
- Minceva-Sukarova et al. (1988) B. Minceva-Sukarova, G. Slark, and W. Sherman, J. Mol. Struct. 175, 289 (1988).
- Tajima et al. (1982) Y. Tajima, T. Matsuo, and H. Suga, Nature 299, 810 (1982).
- Salzmann et al. (2006) C. Salzmann, P. Radaelli, A. Hallbrucker, E. Mayer, and J. Finney, Science 311, 1758 (2006).
- Mitra (2004) S. Mitra, High-pressure Geochemistry and Mineral Physics (Elsevier, 2004).
- Leadbetter et al. (1985) A. J. Leadbetter, R. C. ward, J. W. Clark, P. A. Tucker, T. Matsuo, and H. Suga, J. Chem. Phys. 82, 424 (1985).
- Knight and Singer (2005) C. Knight and S. Singer, J. Phys. Chem. B 109, 21040 (2005).
- Kuo and Kuhs (2006) J.-L. Kuo and W. Kuhs, J. Phys. Chem. B 110, 3697 (2006).
- Besson et al. (1992) J. Besson, R. Nelmes, G. Hamel, J. Loveday, G. Weill, and S. Hull, Physica B 180, 907 (1992).
- Salzmann et al. (2007) C. Salzmann, P. Radaelli, A. Hallbrucker, E. Mayer, and J. Finney, in Physics and Chemistry of Ice, edited by W. Kuhs (The Royal Society of Chemistry, 2007).
- Larsen and Dreele (1985) A. Larsen and R. V. Dreele, GSAS - General Structure Analysis System, University of California (1985).
- Kamb (1965) B. Kamb, Science 150, 205 (1965).
- Landau and Lifshitz (1958) L. Landau and E. Lifshitz, Statistical Physics (Pergamon Press, 1958).
- Franzen (1990) H. Franzen, Chem. Mater. 2, 486 (1990).
- Tribello et al. (2006) G. Tribello, B. Slater, and C. Salzmann, J. Am. Chem. Soc. 128, 12594 (2006).
- Knight and Singer (2008) C. Knight and S. Singer, J. Chem. Phys. 129, 164513 (2008).
- (24) The H2O transition takes place in the same temperature range according to preliminary calorimetric studies.