2 JILA, Campus Box 440, University of Colorado, Boulder, CO 80309-0440, USA;
3 Instituto de Astronomia, Universidad Nacional Autonomica de Mexico, Apartado Postal 70-264, 04510 Mexico DF;
4 University Paris 7, APC, Lab. Astroparticule et Cosmologie, UMR7164 CNRS, 10 rue Alice Domon et LÂonie Duquet 75205 Paris Cedex 13;
5 INAF, Osservatorio Astronomico di Brera, via E. Bianchi 46, 23807 Merate (LC), Italy;
6 Laboratoire Astroparticule et Cosmologie, 10 rue A. Domon et L. Duquet, 75205 Paris Cedex 13, France;
7 Service d’Astrophysique, DSM/DAPNIA/SAp, CEA-Saclay, 91191 Gif-sur-Yvette, France;
8 School of Cosmic Physics, DIAS, 31 Fitzwilliam Place, Dublin 4, Ireland;
9 School of Physical Sciences and NCPST, DCU, Glasnevin, Dublin 9, Ireland;
10 Dunsink Observatory, Castleknock, Dublin 15, Ireland;
UVES/VLT high resolution absorption spectroscopy of the GRB080330 afterglow: a study of the GRB host galaxy and intervening absorbers ††thanks: Based on observations collected at the European Southern Observatory, ESO, the VLT/Kueyen telescope, Paranal, Chile, in the framework of programs 080.A-0398
Abstract
Aims. We study the Gamma Ray Burst (GRB) environment and intervening absorbers by analyzing the optical absorption features produced by gas surrounding the GRB or along its line of sight.
Methods. We analyzed high resolution spectroscopic observations (R=40000, S/N) of the optical afterglow of GRB080330, taken with UVES at the VLT hours after the GRB trigger.
Results. The spectrum illustrates the complexity of the ISM of the GRB host galaxy at z = 1.51 which has at least four components in the main absorption system. We detect strong Fe II, Si II, and Ni II excited absorption lines associated with the bluemost component only. In addition to the host galaxy, at least two more absorbers lying along the line of sight to the afterglow have been detected in the redshift range , each exhibiting Mg II absorption. For the bluemost component in the host galaxy, we derive information about its distance from the site of the GRB explosion. We do so by assuming that the excited absorption lines are produced by indirect UV pumping, and compare the data with a time dependent photo-excitation code. The distance of this component is found to be pc, which is lower than found for other GRBs ( kpc). We identify two additional Mg II absorbers, one of them with a rest frame equivalent width larger than 1Å.
Conclusions. The distance between the GRB and the absorber measured in this paper confirms that the power of the GRB radiation can influence the conditions of the interstellar medium up to a distance of at least several hundred pc.
For the intervening absorbers, we confirm the trend that on average one strong intervening system is found per afterglow, as has been noted in studies exhibiting an excess of strong Mg II absorbers along GRB sightlines compared to quasars.
Key Words.:
gamma rays: bursts - cosmology: observations - galaxies: abundances - ISM1 Introduction
The study of the interstellar medium (ISM) of z galaxies has so far relied upon observation of Lyman-break galaxies (LBGs) at z (see e.g. Steidel et al. 1999) and galaxies that happen to be along lines of sight to bright background quasars (or QSOs, see e.g., Prochaska et al. 2003). However, LBGs are characterized by significant star formation and their inferred chemical abundances may not be representative of typical high-z galaxies. Weak metal-line systems along the line of sight to quasars probe mainly galaxy haloes, rather than their bulges or discs. Taking advantage of ultra-deep Gemini multi-object spectrograph observations, Savaglio et al. (2004, 2005) studied the ISM of a sample of faint K-band selected galaxies at 1.4z2.0, finding MgII and FeII abundances much higher than in QSO systems but similar to those in GRB host galaxies (Prochaska et al. 2007). These studies can hardly be extended to higher redshift with the present generation of 8m class telescopes, because of the faintness of high-z galaxies. Since the discovery that Gamma-Ray Bursts (GRBs) are extragalactic, we are now able to use an independent tool to study the ISM of high-z galaxies.
The main difference between QSO and GRB absorption spectroscopy is that QSOs are stationary in their emission, while GRBs are the most variable and violent phenomena in the Universe known to date. Thus, while the QSO has already ionized the ISM along its line of sight, the physical, dynamical, and chemical status of the circumburst medium in the star-forming region hosting the GRB progenitor can be modified by the explosive event, by shocks and ionizing photons. The presence of blue-shifted absorbers may indicate that the GRB and its afterglow can not only ionize the interstellar medium, but further radiatively and/or collisionally accelerate it. Circumstellar absorption lines in GRB afterglow spectra can be used to determine the main properties of the stellar progenitors (van Marle, Langer, & Garcia-Segura 2005). The variability in the intensity of absorption lines can be used to determine the location and density of the absorber, following Perna & Loeb (1998), Boettcher, Fryer & Dermer (2002), Draine & Hao (2002), Mirabal et al. (2002), Perna & Lazzati (2002), and Perna, Lazzati & Fiore (2003).
Occasionally, extremely bright optical transient emission is associated with a GRB event, offering a superb opportunity to investigate high–z galaxies by means of high resolution spectroscopy of the optical transient.
Fiore et al. (2005) presented the first high-resolution spectroscopic data of GRB afterglows. Their study of the UVES/VLT spectra of GRB020813 and GRB021004 showed that the ISM of GRB host galaxies is complex when resolved down to a width of a few tens of km/s, many velocity components contributing to each main absorption system and spanning a total velocity range of up to thousands of km/s.
Since the launch of Swift, which now allows a prompt reaction to a GRB event, a dozen afterglows have been observed at high resolution. The first published high resolution observations in the Swift era were those of the GRB051111 and GRB050730 afterglows (Chen et al. 2005; Prochaska, Chen & Bloom 2006; Penprase et al. 2006). They confirm the complex nature of the ISM of the GRB host galaxies, and velocity ranges of hundreds of km/s are found with the spectra obtained with MIKE at the MagellanII and HIRES at the Keck. GRB050730 was also observed using UVES at the VLT (D’Elia et al. 2007): the ISM is inferred to have a clumpy nature from the presence of six components in the high resolution spectrum, each representing a different layer of absorbing gas. The capability of resolving the absorbing gas into components of different velocity allows us to separate the contribution of the circumburst environment from that of regions in the host galaxy far away and less affected by the GRB afterglow, as in the case of GRB 050922C (Piranomonte et al. 2008). Fine structure and other excited levels of the species O I and the ions Fe II, Ni II, Si II, and C II, are routinely identified in GRB spectra. These lines are most probably excited by the intense UV flux coming from the afterglow, since strong variation is observed when multi-epoch, high resolution spectroscopy is available. This variation is inconsistent with a pure infrared excitation or collisional processes (Vreeswijk et al. 2007, D’Elia et al. 2009). Thus, by assuming UV pumping as the responsible mechanism for the production of these lines, we can compute the distance of the gas from the GRB. This distance is found to be of the order of a few kpc (see Vreeswijk et al. 2007 for GRB060418) or even larger, as in the case of the naked-eye GRB080319B (D’Elia et al. 2009), for which the inferred distance of 6 kpc to the farthermost component allows speculation about a possible extragalactic origin of part of the excited gas.
GRB high resolution spectroscopy is also suitable for studying the systems lying along the line of sight to GRBs, and not only their host galaxies. Surprisingly, the number density of Mg II intervening absorbers in GRB spectra is nearly 4 times higher than that along QSO sightlines (Prochter et al. 2006), while the C IV absorbers do not show any statistical difference (Sudilovsky et al. 2007; Tejos et al. 2007). The reason for the Mg II excess in GRB spectra is still uncertain, and a larger sample is required to properly address this issue.
In this paper, we discuss high resolution spectroscopy of GRB080330. We investigate both the local medium surrounding the GRB, and the intervening systems. For what concerns the host galaxy, we focus in particular on the analysis of the absorption lines produced by the excited levels of the atoms and ions constituting the absorbing gas. The comparison of these absorption features and their corresponding ground states yields information about the gas distance from the GRB explosion site, based on the assumption of indirect UV pumping production of the excited levels. A full analysis of the intervening absorbers lying along the line of sight to the GRB afterglow is also presented.
The paper is organized as follows. Section summarizes of the GRB080330 detection and observations. Section presents the high resolution observations and data reduction. Section is devoted to the study of the absorbers located in the host galaxy, and in particular to the analysis of their excited levels. Section presents a full analysis of the absorbing systems identified in the spectrum. Finally, in Sect. the results are discussed and conclusions are drawn.
2 GRB080330
GRB080330 was discovered by Swift-BAT on March 30, 2008, at 03:41:16 UT (Mao et al. 2008). Less than 100s later, both XRT and UVOT detected the afterglow, which had a magnitude of 18.8 (white filter). Even before the distribution of the XRT position, the TAROT and ROTSE robotic telescopes had detected the optical afterglow at the position RA: 11:17:04.5 Dec: +30:37:24.0 (J2000). The magnitude of the object was roughly 17.5 22s after the trigger, and reached a peak of R=16.8 at 300s (Klotz et al. 2008; Schaefer & Guver 2008). The redshift of the host galaxy was first secured by NOT observations (Malesani et al. 2008), and then confirmed by Cucchiara et al. (2008), using Hobby-Eberly Telescope observations. The afterglow was also detected in the infrared band (J, H, and K) by PAIRITEL (Bloom & Starr 2008) and GROND (Clemens et al. 2008), and in the -band (20 keV - 1 MeV) by Konus-Wind (Golenetskii et al. 2008). For a detailed analysis of the multi-band properties of the prompt and afterglow emission evolution, we refer the reader to Guidorzi et al (2009).
3 Observations and data reduction
In the framework of the ESO program 080.A-0398, we observed the afterglow of GRB080330 with the high resolution UV-visual echelle spectrograph (UVES, Dekker et al. 2000), mounted at the VLT-UT2 telescope. Observations began on 30 March 30 2008 at 05:06:32 UT (h after the GRB) for a net exposure time of 45 minutes, when the magnitude of the afterglow was . Because of observational and scheduling constraints, only the UVES dichroic 1 was used, when employing the red as well as the blue arm. The slit width was set to be 1” (which corresponds to a resolution of R=40000) and the read-out mode was rebinned to 2 2 pixels. The achieved spectral range covers the bands from 3300Å to 3870Å, 4780Å to 5750Å, and 5830Å to 6810Å. The data below 3500Å is dominated totally by noise. Table 1 provides a summary of the UVES setups used.
| Setup (nm) | Wavelength (Å) | Slit width | Spec. Resolution | S/N |
|---|---|---|---|---|
| Dic 1, 346 | 3300 - 3870 | 1” | 40 000 | |
| Dic 1, 580 | 4780 - 6810 | 1” | 40 000 |
The data reduction was performed using the UVES pipeline (Ballester et al. 2000). The final resolution was km/s for the blue arm and km/s for the red arm; this slight loss of resolution in the blue band is caused by a rebinning to increase the signal-to-noise ratio per pixel, which ranges from at 3800Å to at 6800Å. The noise spectrum, used to determine the errors in the best-fit line parameters, was calculated from the real, background-subtracted spectrum, using line-free regions. This, therefore, takes into account both statistical and systematic errors in the pipeline processing as well as the background subtraction.
In the following two sections, we discuss the absorption features related to the main system, i.e., the host galaxy (Sect. 4), and those produced by other intervening systems (Sect. 5).
4 The main absorption system
This system has the greatest number of features and is produced by the gas residing in the GRB host galaxy. The spectrum exhibits a large number of metal-absorption lines, of both neutral (Mg I) and low ionization species (Si II, Zn II, Cr II, Ni II, Fe II, Mn II). In addition, strong absorption from the fine structure levels of Fe II and Si II and from the metastable levels of the Fe II and Ni II has been identified, suggesting that the intense radiation field from the GRB excites these features. Table 2 summarizes all the absorption lines of the main system. The ISM of the host galaxy is complex, with many components contributing to the absorption system. The wealth of metal-line transitions allows us to precisely determine the redshift of the GRB host galaxy. This yields a heliocentric redshift of z=1.5115, if we set the reference point to the bluemost component of the main system; this component is the only one for which there is significant absorption from the excited levels of the intervening gas (see subsect. 4.2). Our redshift value agrees with that found by Malesani et al. (2008) and Cucchiara et al. (2008). This complex environment is described in the next following sections with a detailed study of the excited lines that aims to estimate the distance of the circumburst gas.
4.1 Line-fitting procedure
The analysis of the GRB environment is complicated by the complexity of the absorption lines in the spectrum, which in several cases cannot easily be fitted with a single line profile. This implies that many different velocity components contribute to the gas in the GRB environment. In other words, several layers of gas that may be close to or far from each other, appear to be mixed together in the spectrum (in velocity space). The presence of several components is thus indicative of clumpy gas in the GRB environment, which consists of different absorbing regions each with different physical properties.
If the absorption features are fitted with a single Voigt profile, we are able to obtain only very poor fitting parameters and very high values. The identification of the different components is somewhat subjective, the true message being that the geometry and kinematics of the ISM clouds probed by the GRB line of sight are complex. The Fe II lines have the widest velocity range, so we tried to use them to identify the different components within the circumburst matter. Although several Fe II absorption features are saturated, two of them (2260 and 2249) are not and can guide the fit in identifying the wavelengths of the components. A four-component model represents a good fit for the Fe II lines. Thus, the redshifts of these components as well as the Doppler parameters were fixed to fit all the saturated Fe II and other ion features present in the spectrum with the same model.
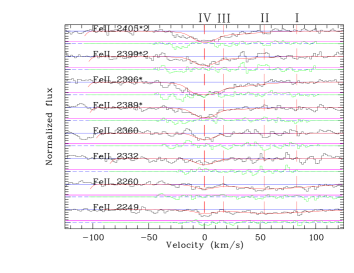
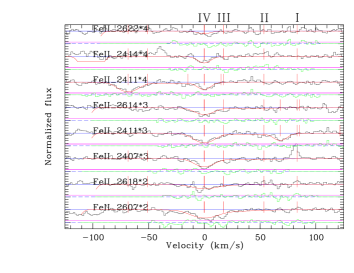
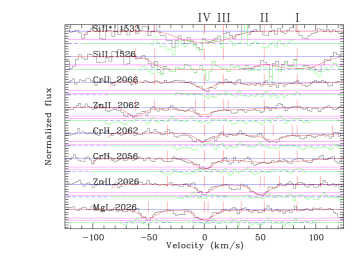
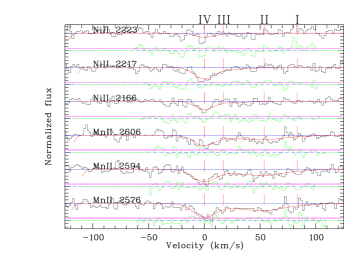
Figure. 1 presents all the absorption features relative to Fe II, with the exception of the saturated lines. The transitions due to the four fine structure levels of the Fe II ground state are marked with asterisks. The lines Fe II 2332 and 2360 are produced by the first excited level. The components are labeled I (redmost) to IV. The reference zeropoint of the velocity shifts has been placed at z=1.5115. This value was chosen to coincide with the redshift of the bluemost component, for two reasons. First, the narrow profile of the excited lines makes the redshift determination more accurate. Second, the excited levels are possibly produced by the indirect UV-pumping mechanism (see next subsection), implying that component IV is probably the closest component to the GRB explosion site. Figure 2 displays all the other species observed in the spectrum, namely: Mg I, Zn II, Cr II, Si II, Mn II, and Ni II. The transition Si II1533* is produced by the first fine structure level of the Si II, and all the observed Ni II lines belong to the first excited level. We note that all the excited absorption features in the spectrum, produced by fine structure and/or metastable levels of Fe II, Si II, and Ni II, show a significant absorption only in component IV, i.e., our bluemost, reference component (the Ni II metastable level features also a faint absorption in component III). Table 2 lists all the transitions observed in the spectrum for each species. The column densities for all the elements and ions of the host galaxy absorbing gas, estimated using this four component model, are also reported. The Table shows only the column densities of component IV, which is the only one used in the following analysis, due to the presence of the excited transitions. We emphasize here that the Si II 1526 line is strongly saturated, thus the corresponding column density in Table 2, marked with an ’S’, should be interpreted with care.
As described in the introduction, the observation of excited states in GRB absorption spectra is a quite common feature. The next sub-section is thus devoted to these features and to the information that can be extracted from their analysis.
4.2 Excited levels
The level structure of an atom or ion is characterized by a principal quantum number , which defines the atomic levels, and by the spin-orbit coupling (described by the quantum number ), which divides these levels into fine structrure sublevels. In GRB absorption spectra, several excited features are detected at the GRB redshift, because of the population of both and/or fine structure levels. As mentioned before, component IV of the main system in the spectrum of GRB080330 shows absorption from the four fine structure levels of the Fe II ground state () and from the first sublevel of the quantum state (). Absorption from the Si II fine structure level and from the Ni II metastable level are also present (see Table 2 for details).
There are basically two mechanisms for exciting the gas of the GRB host galaxy to these states. The first is by collisional effects (if the density is sufficiently high, i.e., cm-3), and the second is by the absorption of electromagnetic radiation. In the latter case, the absorbed radiation can be from the infrared band, by a direct population of the fine structure levels of the ground state and other excited levels with a low value of , or from the UV band, by the population of higher levels followed by the depopulation into the states responsible for the absorption features. Multi-epoch high resolution spectroscopy plus the accurate modeling of the atomic level population has proven to be a powerful tool for discriminating between these two processes. The strong variability in the column density of the Fe II and Ni II excited levels observed in GRB060418 (Vreeswijk et al. 2007) and GRB080319B (D’Elia et al. 2009) excluded collisional processes and direct infrared pumping as being responsible for the excitation. Since we do not have multi-epoch spectroscopic data, we cannot repeat the same procedure for this GRB, but must assume that UV pumping is at work.
By assuming indirect UV pumping as the dominant mechanism for producing the excited levels also in component IV of GRB080330, we can compare our observed column densities to those predicted by a photoexcitation code for the time when the high resolution observations were acquired. This can be completed for the Fe II and Si II ions, for which both ground states and excited levels are present in the spectrum. In contrast, for Ni II, we only measured the column density of the first metastable level, since the transition corresponding to the ground level fell in the gap between the blue and the red regions of the spectrum. The photoexcitation code is that used by D’Elia et al. (2009). Basically, it solves the detailed balance equation
in a time-dependent way for all the transitions involving the 16 lowest levels plus 22 higher excited states (for Fe II) and the 20 lowest levels (for Si II). The emission terms in that equation depend on the flux level experienced by the absorbing gas. This flux is of course a function of the distance of the gas from the GRB explosion site, which is a free parameter of the computation. The code takes into account radiative transfer and possible opacities of some of the transitions. The other free parameters are the initial column density of the ion, which is assumed to be in the ground state before the GRB flux reaches it, and the Doppler parameter of the gas. The flux of the GRB as a function of time was measured by Guidorzi et al. (2009). Following the notation
is the flux in the R band at the time t, and the normalization of the flux is erg cm-2 s-1 at the time s. The temporal index is before , between and s and for , is the central frequency of the R band. We assume here a spectral index of (Guidorzi et al. 2009); this value is close to the value of inferred using the multispectral data from Cobb (2008). The flux experienced by the absorber is
where the GRB luminosity distance was computed assuming an km s-1 Mpc-1, , cosmology. was corrected by the radiative transfer theory, before using it in eq. (1). The initial column densities of the ground states of Fe II and Si II were computed from the observed column densities of all the levels of each ion. The exact values are: and . Finally, the Doppler parameter was allowed to vary between and km s-1, i.e., the values that reproduce most closely the excited lines alone and all the absorption features together, respectively. Of course all these values refer solely to component IV, the only one for which the excited levels are present in the spectrum. All the details of this time-dependent photo-excitation code can be found in D’Elia et al. (2009).
We first modeled the Fe II photo-excitation. The value of the Doppler parameter that provides the closest agreement is km s-1. Figure 3 shows the model that reproduces the Fe II data most closely. The x-axis is the rest-frame time interval between the GRB explosion and the UVES observation. The time of observation (with respect to the GRB detection) is defined as the logarithmic mean between the beginning and the end of the observation. The agreement between the theoretical curves and the data is very good. The distance of component IV from the GRB explosion site is measured to be pc. To estimate the error associated to , we ran our code for a grid of distances in the range pc. We then converted the column densities and the corresponding errors to linear values to compute the . Figure 4 plots this quantity as a function of , which has a minimum at pc (). The 90% confidence interval is enclosed in the dashed lines and covers the range pc.
We fixed the model parameters (with the exception of the distance) to those evaluated for Fe II and ran the photoexcitation code for Si II. As noted in the previous subsection, the Si II ground state column density for component IV (Table 2) should be interpreted with caution, since it is measured from a single absorption line, that is saturated. In a steady-state approximation, we would expect the ratio of the column density of Si II fine structure to ground levels to be times higher than the corresponding Fe II ratio (see e.g., Prochaska, Chen & Bloom 2006). Thus, the Si II 1526 value that we found is unusual, since the ratio is for Fe II while the one for Si II is only . This means that we are overestimating the Si II ground state column density and we should consider our value as an upper limit to the real density. The result of the photoexcitation code for the Si II levels is shown in Fig. 5. The distance that we find is pc, which accordingly should be considered as an upper limit consistent with the estimation for the Fe II. We also note that for a steady-state approximation our Si II column densities would imply a distance from the GRB times higher than that inferred from Fe II. This is again consistent with the results of our time-dependent code.
To ensure self-consistency, we need to establish that, at the distance of pc as derived for component IV, Fe II and Mg I are not fully photoionized by the strong UV radiation of the burst. For this purpose, we performed a series of runs of the photoionization code by Perna & Lazzati (2002), which accounts for the radiative-transfer of the radiation. We first simulated a medium in thermal equilibrium at a temperature of K, and allowed the radiation from the burst, modeled by Eq.(1), to propagate through the medium for minutes in the rest frame. We found that for absorber densities in the range of cm-3, the Fe II column density is substantially unchanged after minutes. The column density of Mg I is reduced by for densities of cm-3, by for cm-3, and is unaltered for cm-3. We can thus safely conclude that there is a wide range of densities for which Fe II and Mg I are not substantially photoionized if the GRB is at pc.


| Species | Observed transitions | Log N (cm-2) |
|---|---|---|
| SiII | 1526 | |
| SiII | 1533 | |
| MgI | 2026 | |
| ZnII | 2026, 2062, | |
| CrII | 2056, 2062, 2066 | |
| NiII | 2166, 2217, 2223 | |
| MnII | 2576, 2594, 2606 | |
| FeII | 2249, 2260, 2344, | |
| 2374, 2382, 2586, | ||
| 2600 | ||
| FeII | 2333, 2365, 2389, | |
| 2396, 2599, 2612, | ||
| 2626 | ||
| FeII | 2328, 2349, 2399, | |
| 2405, 2607, 2618, | ||
| 2632 | ||
| FeII | 2359, 2407, 2411, | |
| 2614, 2631 | ||
| FeII | 2411, 2414, 2622, | |
| 2629 | ||
| FeII | 2332, 2348, 2360 |
5 The intervening systems
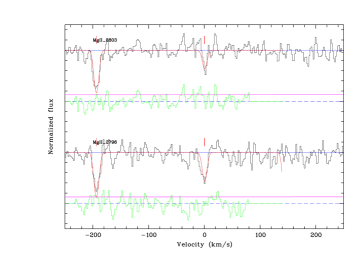
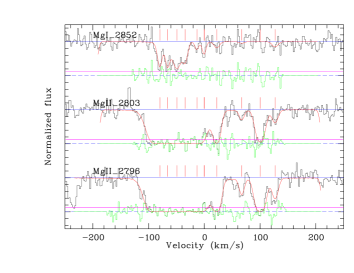
The absorption lines produced by the gas belonging to the GRB host galaxy are the dominant features of the high resolution spectrum, but they are not the only ones. The signal-to-noise level of our spectrum allowed us to detect lines with equivalent widths as weak as 0.06 Å, at the confidence level. A detailed analysis of the data found that at least three other absorbers are present along the line of sight to GRB080330. The two higher redshift ones ( and ) show absorption only from the Mg II 2796, 2803 doublet, and exhibit a very simple line profile, that can be fitted by a single Voigt function. However, since they are only separated by km s-1, they should be interpreted as a single, clumpy system (fig. 6). The third absorber is rather complicated. The absorption lines detected for this system are the Mg II 2796, 2803 doublet and the Mg I 2852 line. This system has a complex structure and a single Voigt profile is not adequate to reproduce it. At least five different components are needed to obtain a good fit to the Mg II data. The bluemost component is saturated, and so a reliable column density for the Mg II cannot be obtained. However, this is the only component that exhibits Mg I absorption at the 90% confidence level. This Mg I component needs a more complex modeling to adequately follow its profile. This results in a further division into six subcomponents (fig. 7). Taking into account the velocity spread of km s-1, we consider this system as a single complex absorber. The redshift path analyzed for the search of Mg II systems lies in the intervals , , and .
Table 3 summarizes the rest-frame equivalent widths, column densities, and redshifts calculated for these intervening systems. Lines 1 and 2 refer to the first double system, while lines 3-7 refer to the more complex, low redshift one. We report only the total column density for the bluemost component of Mg I (the corresponding Mg II is saturated), and do not report the values of all the six subcomponents. The equivalent width is computed for this system as a whole.
| System | Species | Transition | z | EW(Å) | Na |
| 1 | MgII | 2796, 2803 | 1.0179 | ||
| 1 | MgII | 2796, 2803 | 1.0166 | ||
| 2 | MgII | 2796, 2803 | 0.8222 | b | |
| 2 | MgII | 2796, 2803 | 0.8220 | ||
| 2 | MgII | 2796, 2803 | 0.8219 | ||
| 2 | MgII | 2796, 2803 | 0.8216 | ||
| 2 | MgII | 2796, 2803 | 0.8213 | ||
| 2 | MgI | 2852 | 0.8213 |
a Column densities N are logarithmic cm-2; Sat marks saturated components.
b The rest equivalenth width of the 2796 transition for the last two components only (z=0.8213 and 0.8216) is ,.
6 Conclusions
We have presented high resolution (R=40 000, corresponding to 7.5 km/s) spectroscopy of the optical afterglow of the Gamma Ray Burst GRB080330, observed using UVES at the VLT hours after the trigger.
We confirm that the redshift of the host galaxy is z=1.51. The spectrum shows that the ISM of the GRB host galaxy is complex, with at least four components contributing to its main absorption system at z= 1.51. These components are identified in this paper with progressive numbers of decreasing velocity values.
These absorption lines appear both as neutral metal-absorption lines (Mg I) and low ionization lines (Fe II, Si II, Mn II, Cr II, Zn II).
In addition, we detect strong Si II, Ni II, and Fe II excited transitions, but only in component IV (i.e., the bluemost component of the main absorption system). Since indirect UV pumping is likely to be the leading mechanism in exciting these features (Vreeswijk et al. 2007), we conclude that component IV is the one more affected by the GRB afterglow, meaning that is the closest to the GRB progenitor. This distance can be constrained by comparing the column densities of the ground and excited levels to those predicted by a time-dependent photoexcitation code for the hypothesis of indirect UV-pumping. This comparison has been carried out for Fe II and Si II only; in fact, the column density of the Ni II ground level could not be measured, because the corresponding absorption transitions fell in the gap between the blue and the red regions of the spectrum. We found that the absorbing gas of component IV is located at pc from the GRB. To ensure self-consistency, we ran a photoexcitation code that confirms that there is a wide range of densities for which the Fe II and Mg I are not substantially photoionized if the GRB is at pc. If this is the case, since the abundance ratio [Cr/Zn] = -0.2 (comparable with DLAs, see Prochaska et al. 2006), while [Fe/Zn]=-0.9 (among the lowest value for DLAs), the absorber appears to be very dusty.
Although the distance between the GRB and the absorber is smaller than the value found from a similar analysis in other GRBs ( kpc for GRB060418, Vreeswijk et al. 2007, and kpc for GRB080319B, D’Elia et al. 2009), it nevertheless confirms that the power of a GRB affects a region of gas that is at least a few hundreds of pc in size.
The host galaxy of the GRB is not the only absorber located along the line of sight to the afterglow. At least two more intervening systems between z = 1.02 and z = 0.82 have been identified. The system at the highest redshift can be modeled simply with a double Voigt profile and exhibits absorption only in the Mg II 2796, 2803 doublet. On the other hand, the second is complex, featuring at least five different components; given the limited velocity interval however, we assume this to be one single, clumpy structure along the line of sight. This system exhibits only Mg II 2796, 2803 doublet and Mg I 2852 line absorption.
One of these systems has a rest-frame equivalent width larger than 1Å. This follows the trend that on average one strong intervening system is found per afterglow, as has been noted in studies that have detected excess of strong Mg II absorbers along GRB sightlines compared to quasars.
Acknowledgements.
We thank an anonymous referee for several helpful comments. We acknowledge support from ASI/INAF contracts ASI/I/R/039/04 and ASI/I/R/023/05/0.References
- (1) Ballester, P., Modigliani, A., Boitquin, O., et al.: 2000, ESO Messenger, 101, 31
- (2) Bloom, J.S. & Starr, D.L. 2008, GCN Circ, 7542
- (3) Boettcher, M. Fryer, C.L. & Dermer, C.D., 2002, ApJ, 567, 441;
- (4) Chen, H.W., Prochaska, J.X., Bloom, J.S. and Thompson, I.B., 2005, ApJ, 634, 25L
- (5) Clemens, C. 2008, GCN Circ, 7545
- (6) Cobb, B.E., 2008, GCN Circ, 7553
- (7) Cucchiara, A. et al. 2008, GCN Circ 7547
- (8) Dekker, H, D’Odorico, S, Kaufer, A., Delabre, B., Kotzlowski, H., 2000, SPIE, 4008, 534D
- (9) D’Elia, V., Fiore, F., Meurs, E.J.A. et al., 2007, A&A 467, 629
- (10) D’Elia, V., Fiore, F., Perna, R. et al., 2009, ApJ, 694, 332
- (11) Draine, B.T. & Hao, L., 2002, ApJ, 569, 780
- (12) Fiore, F.; D’Elia, V.; Lazzati, D., et al., 2005, ApJ, 624, 853
- (13) Golenetskii, S. et al. 2008, GCN Circ, 7548
- (14) Guidorzi, C., Clemens, C., Kobayashi, S. et al. 2009, A&A, in preparation
- (15) Klotz, A. et al. 2008, GCN Circ 7536
- (16) Malesani, D. et al. 2008, GCN Circ 7544
- (17) Mao, J. et al. 2008, GCN Circ 7537
- (18) Mirabal, N., Halpern, J.P., Kulkarni, S.R. et al. 2002, ApJ, 578, 818
- (19) Penprase, B.E., Berger, E., Fox, D.B., Kulkarni, S.R., Kadish, S., Kerber, L., Ofek, E., Kasliwal, M., Hill, G., Schaefer, B., Reed, M., 2006, ApJ, 646, 358
- (20) Perna, R. & Lazzati, D. 2002, ApJ, 580, 261
- (21) Perna, R. & Lazzati, D., Fiore, F. 2003, ApJ, 585, 775
- (22) Perna, R. & Loeb, A., 1998, ApJ, 501,467
- (23) Piranomonte, S., Ward, P.A., Fiore, F. et al. 2008, A&A, 492, 775
- (24) Prochaska, J.X., Gawiser, E., Wolfe, A.M., Castro, S., & Djorgovski, S.G., 2003, ApJ, 595, L9
- (25) Prochaska, J.X., Chen, H.W., Bloom, J.S., 2006, ApJ, 648, 95
- (26) Prochaska J.X., Chen, H.W., Dessauges-Zavadsky, M. & Bloom, J.S., 2007, ApJ, 666, 267
- (27) Prochter, G.E., Prochaska, J.X., Chen, H.-W. et al. 2006, ApJ, 648, L930
- (28) Savaglio, S., Glazebrook, K., Crampton, D. et al. 2004, ApJ, 602, 51
- (29) Savaglio, S., Glazebrook, K., Le Borgne, D. et al. 2005, ApJ, 635, 260
- (30) Schaefer, B.E. & Guver, T., 2008, GCN Circ, 7538
- (31) Steidel, C.C., Adelberger, K.L., Giavalisco, M., Dickinson, M., Pettini, M. 1999, ApJ, 519, 1
- (32) Sudilovsky et al. 2007, ApJ, 669, 741
- (33) Tejos, N., Lopez, S., Prochaska, J.X., Chen, H.-W. & Dessauges-Zavadsky, M., 2007, ApJ, 671, 622
- (34) van Marle, A.J., Langer, N., Garcia-Segura, G, 2005, A&A, 444, 837
- (35) Vreeswijk, P.M., Ledoux, C., Smette, A. et al. 2007, A&A, 468, 83