Non variability of intervening absorbers observed in the UVES spectra of the “naked-eye” GRB080319 ††thanks: Based on observations collected at the European Southern Observatory, ESO, the VLT/Kueyen telescope, Paranal, Chile, in the framework of programs 080.A-0398
Abstract
The aim of this paper is to investigate the properties of the intervening absorbers lying along the line of sight of Gamma-Ray Burst (GRB) 080319B through the analysis of its optical absorption features. To this purpose, we analyze a multi-epoch, high resolution spectroscopic observations (R=40000, corresponding to km s-1) of the optical afterglow of GRB080319B (), taken with UVES at the VLT. Thanks to the rapid response mode (RRM), we observed the afterglow just 8m:30s after the GRB onset when the magnitude was R . This allowed us to obtain the best signal-to-noise, high resolution spectrum of a GRB afterglow ever (S/N per resolution element ). Two further RRM and target of opportunity observations were obtained starting and hours after the event, respectively. Four MgII absorption systems lying along the line of sight to the afterglow have been detected in the redshift range , most of them showing a complex structure featuring several components. Absorptions due to FeII, MgI and MnII are also present; they appear in four, two and one intervening absorbers, respectively. One out of four systems show a MgII 2796 rest frame equivalent width larger than 1Å. This confirms the excess of strong MgII absorbers compared to quasars, with , times larger than the one observed along quasar lines of sight. In addition, the analysis of multi-epoch, high-resolution spectra allowed us to exclude a significant variability in the column density of the single components of each absorber. Combining this result with estimates of the size of the emitting region, we can reject the hypothesis that the difference between GRB and QSO MgII absorbers is due to a different size of the emitting regions.
keywords:
gamma-rays: bursts – ISM: abundances – line: profiles – atomic data.1 Introduction
Intervening metal absorption lines have routinely been observed along the line of sight to quasars (QSOs). Among these features, strong MgII 2796, 2803 absorption doublets (with equivalent width Å) represent good indicators of metal-enriched gas associated with foreground galaxies. This is because Magnesium is an element produced by red giants and dispersed in the interstellar medium (ISM) by supernovae and stellar winds (Bergeron & Boisse 1991, Steidel et al. 1994). In particular, such a strong doublet on a QSO sightline witnesses the presence of galaxies within 60 kpc projected distance and with different morphological types (Churchill et al. 2005, Kacprzak et al. 2008). In addition, the Å MgII intervening absorbers are hosted within dark matter halos with characteristic masses of (Bouche’ et al. 2006) and are associated with Damped Lyman-alpha systems (DLAs, Rao et al. 2006).
For a few hours after their onset, Gamma-Ray Burst (GRB) afterglows are the brightest beacons in the far Universe: therefore they provide an alternative and complementary way to QSOs to fully explore the properties of high-z galaxies in which they are hosted (see Savaglio 2006; Prochaska et al. 2007) and of those along their sightlines. In principle, the sightlines of QSOs and GRBs are expected to be equivalent. Prochter et al. (2006) found strong () MgII intervening absorbers in QSO spectra from the SDSS DR4, which corresponds to a redshift number density of . Surprisingly, the same authors report the identification of 14 MgII systems along 14 GRB sightlines, which translates into a redshift number density of (99% confidence interval), almost 4 times higher than the QSO one. On the other hand, the intervening CIV absorbers for the two classes of sources do not show any statistical difference (Sudilovsky et al. 2007, Tejos et al. 2007).
The reason for this discrepancy is still uncertain, and several scenarios have been widely discussed (see e.g. Porciani et al. 2007 and Cucchiara et al. 2009). One of these interpretations requires a different size of the source, namely, that QSO emitting regions are larger than GRBs which in turn are comparable to the typical size of the MgII clouds (Frank et al. 2007). In this scenario variability in the column densities of the MgII absorber is expected, since the Lorentz factor decreases because the fireball decelerates on the interstellar medium, and thus the GRB emission regions increase. A MgII variability in multi-epoch spectroscopy data on GRB060206 was first claimed by the analysis by Hao et al. (2007), but then disproved by Aoki et al. (2008) and Thöne et al. (2008).
Occasionally, extremely bright optical transient emission is associated with the GRB event, offering the superb opportunity to take spectra of the afterglows with high resolution instruments. In a fraction of these cases, multi-epoch, high resolution spectroscopy with an adequate signal to noise ratio (S/N) can be obtained, allowing to make detailed studies of the host galaxy ISM and to put strong constraints on its physical parameters (see Vreeswijk et al. 2007 for GRB060418, and D’Elia et al. 2009a for GRB080319B). Here we take advantage of the high quality data collected for GRB083019B to make a systematic study of this GRB sightline and to search for variability of the MgII intervening absorbers.
The paper is organized as follows. Section presents a short summary of the GRB080319B detection and observations; Section describes the datasets and data reduction; Section presents the full analysis of the intervening systems identified in the spectra; finally in Section the results are discussed and conclusions are drawn.
2 GRB080319B
GRB080319B was discovered by the Burst Alert Telescope (BAT) instrument on board Swift on 2008, March 19, at 06:12:49 UT. Swift slewed to the target in less than 1 minute and a bright afterglow was found by both the X-Ray Telescope (XRT) and UV-Optical Telescope (UVOT) at RA = h m s, Dec = +36o (Racusin et al. 2008a) with observations starting 60.5 and 175 s after the trigger, respectively.
The field of GRB080319B was imaged by the ”Pi of the Sky” apparatus located at Las Campanas Observatory before, during and after the GRB event (Cwiok et al. 2008). The field was also targetted by the robotic telescope REM just 43 s after the BAT trigger (Covino et al. 2008a, b). The TORTORA wide-field optical camera (12 cm diameter, 2025 deg FOV, TV-CCD, unfiltered) mounted on REM also imaged the field before, during and after the GRB event with good temporal resolution (Karpov et al. 2008). These observations show that the GRB reached the magnitudes about s and about s after the trigger. This makes GRB080319B the brightest GRB ever recorded at optical wavelengths (Racusin et al. 2008b, Bloom et al. 2009).
| Obs | UT observation | T. from burst (s) | Setup (nm) | Wavelength (Å) | Slit | Resolution | Exp. (s) | S/N | R mag |
|---|---|---|---|---|---|---|---|---|---|
| RRM 1 | 2008 Mar 19, 06:21:26 | 517 | Dic 2, 437 | 3760 - 4980 | 1” | 40000 | 600 | ||
| RRM 1 | 2008 Mar 19, 06:21:26 | 517 | Dic 2, 860 | 6700 - 10430 | 1” | 40000 | 600 | ||
| RRM 2 | 2008 Mar 19, 07:18:47 | 3441 | Dic 1, 346 | 3040 - 3870 | 1” | 40000 | 1800 | ||
| RRM 2 | 2008 Mar 19, 07:18:47 | 3441 | Dic 1, 580 | 4780 - 6810 | 1” | 40000 | 1800 | ||
| RRM 2 | 2008 Mar 19, 08:06:42 | 6833 | Dic 2, 437 | 3760 - 4980 | 1” | 40000 | 1800 | ||
| RRM 2 | 2008 Mar 19, 08:06:42 | 6833 | Dic 2, 860 | 6700 - 10430 | 1” | 40000 | 1800 | ||
| ToO | 2008 Mar 19, 08:43:52 | 8546 | Dic 1, 346 | 3040 - 3870 | 1” | 40000 | 1200 | ||
| ToO | 2008 Mar 19, 08:43:52 | 8546 | Dic 1, 580 | 4780 - 6810 | 1” | 40000 | 1200 | ||
| ToO | 2008 Mar 19, 09:07:18 | 10478 | Dic 2, 437 | 3760 - 4980 | 1” | 40000 | 1200 | ||
| ToO | 2008 Mar 19, 09:07:18 | 10478 | Dic 2, 860 | 6700 - 10430 | 1” | 40000 | 1200 |
3 Observations and data reduction
We observed the bright afterglow of GRB080319B in the framework of the ESO program 080.A-0398 with the VLT/UVES (Dekker et al. 2000). The Observation Log and the setups used are reported in Table 1. Both UVES dichroics, as well as the red and the blue arms, were used.
The first, 10min observation, was performed in Rapid Response Mode (RRM) and started just 8m:30s after the GRB event, when the afterglow was extremely bright (). This provided a S/N= per resolution element. Two more UVES observations followed, the first one was again in RRM mode, activated in the framework of program 080.D-0526 and starting 1.0 hours after the GRB event. The second one was a Target of Opportunity (ToO), starting 2.4 hours after the GRB, see Table 1. A slit width of 1” has been used in all the observations; this corresponds to a spectral resolution of , or km s-1.
Data reduction was carried out by using the UVES pipeline (Ballester et al. 2000). The final useful spectra extend from Å to Å. The spectra were normalized to the continuum, which was evaluated by fitting the data with cubic splines, after the removal of the absorption features. Finally, the noise spectrum, used to determine the errors on the best fit line parameters, was calculated from the real, background-subtracted spectra using line-free regions. This takes into account both statistical and systematic errors in the pipeline processing and background subtraction.
4 The GRB080319B sightline
An analysis of the GRB080319B UVES spectra reveals at least 5 absorbing systems along the GRB line of sight. The presence of excited FeII and NiII features in the higher redshift system is a clear indication that its gas belongs or is close to the host galaxy of the GRB. We will not discuss the host galaxy absorber, since a detailed study has been reported by D’Elia et al. (2009a); but instead we will now concentrate on the intervening systems.
The four intervening absorbers identified have redshifts in the range . Each system features MgII absorption. FeII, MgI and MnII are also present; they appear in four, two and one intervening absorbers, respectively. The analysis of these systems is often intricate due to the complexity of the absorption lines of the spectrum, which in several cases cannot easily be fit with a single line profile. The presence of several components is indicative of clumpy gas in the intervening absorbers, similarly to what observed for the circumburst environment of many GRBs (See e.g., D’Elia et al. 2007, Piranomonte et al. 2009, D’Elia et al. 2009a,b) and for the MgII intervening absorbers along the QSO sightlines (Churchill & Vogt 2001). Whenever a system can not be fit by a single line profile, it can be interpreted both as a clumpy system with a complex velocity structure or as many systems lying at different redshifts. This is why we say that GRB080319B has at least four intervening systems. We arbitrarily chose to consider as a single system two or more absorption features closer than km s-1. Tab. 2 summarizes the characteristics of the intervening absorbers. Column 2 gives the heliocentric redshift, column 3 the absorbing elements and ions, column 4 the total width of the system, column 5 the rest frame equivalent width (EWrf) of the MgII2796 line, column 6 the number of components necessary to adequately fit each system. The intervening absorbers are ordered with decreasing redshift. For multiple component systems the reference values have been arbitrarily placed to be coincident with the component indicated in column 7; for single component absorbers the redshift is defined by the best fit value of the central absorption line wavelength.
| System | redshift | species | Width (km s-1) | MgII 2796 EW (Å) | # of components | z reference component |
|---|---|---|---|---|---|---|
| 1 | MgII, FeII | 2nd | ||||
| 2 | MgII, MgI, FeII | 7th | ||||
| 3 | MgII, FeII | 1st | ||||
| 4 | MgII, MgI, FeII, MnII | 3rd |
∗ Rest frame values, errors are at confidence level.
The next subsections report the analysis for each intervening absorber. The fitting procedure for the absorption systems has been carried out as follows. First of all, we analyzed the first epoch spectrum, that with the highest signal-to-noise ratio. The spectrum was analyzed in the MIDAS environment using the fitlyman procedure (Fontana & Ballester 1995). The line profile fitting is usually performed using a Voigt function. Each Voigt profile has basically three free parameters: the central wavelength of the transition, the column density of the absorbing species and the doppler parameter of the gas. A single component treatment is often inadequate, reflecting the complexity of the intervening systems, as noted before. We thus fit the data several times with different numbers of components, in order to minimize the reduced values. MgII, which appears in all systems, is the one with a larger velocity spread, so it was used to guide the identification of all components. The other species, when present, allowed us to best constrain the central wavelength positions in the regions where the MgII results to be strongly saturated. The central wavelengths and the parameters have been kept fixed among the different species, unless otherwise stated. Once a satisfactory fit to the first epoch spectrum was obtained, we turned to the analysis of the other two epochs. Again, the central wavelengths and the parameters were fixed to the first epoch results. To increase the S/N of the later epoch observations, we added them (the second and third spectra) and repeated the fits to the coadded spectrum. Tables 3 to 6 report the results of our analysis for the intervening absorbers 1 to 4, respectively. In particular, column 2 shows the number of features contributing to the fit for each species, column 3 reports the epoch to which the data refers, and the following ones the column densities of each component for that specific element or ion. Components are identified with progressive numbers for decreasing redshifts (or decreasing wavelengths, i.e., the higher the wavelength or the positive velocity shift, the lower the component number). Errors are the formal uncertainties given by fitlyman; upper limits have the level confidence.
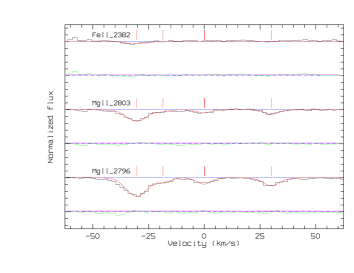
4.1 The intervening system 1
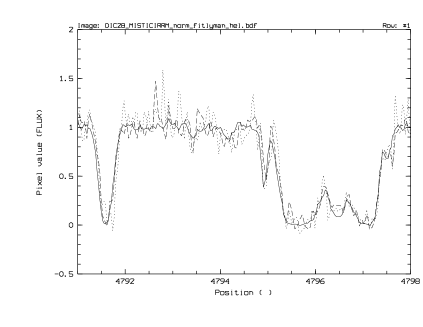
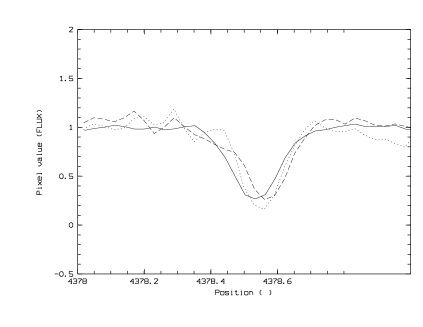
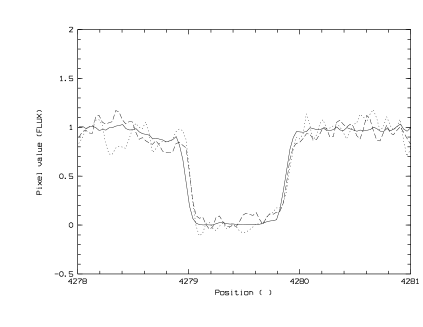
This is the system with the lowest number of absorption features. In fact, only the MgII 2796, 2803 doublet and the FeII 2382 line are present at . Despite this, the structure of the system, which spans a velocity range of km s-1 is quite complex, and a four component model is necessary in order to obtain a reasonable fit to the data. Fig. 1 shows the absorption due to the MgII doublet and the FeII 2382 line, together with the results of the four component fit. The FeII 2382 line is only present in the fourth component of the first observation. The S/N ratio of the following observations just allows to set upper limits for this feature. Table 3 reports the column densities for each component. We can rule out a variability of both the MgII and FeII lines, since all the column densities are consistent within the level.
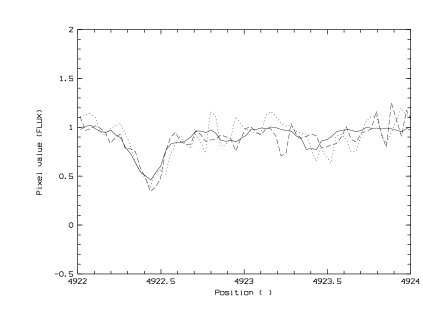
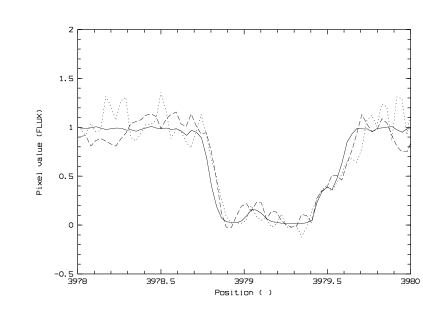
The non variability of the MgII features is also shown in Fig. 2, which displays the MgII 2796 features for the three epochs.
| Species | Trans. | Obs. | I (+30 km s-1) | II (0 km s-1) | III (-20 km s-1) | IV (-30 km s-1) |
|---|---|---|---|---|---|---|
| Mg II | 2796 | 1 | ||||
| 2803 | 2 | |||||
| 3 | ||||||
| 2+3 | ||||||
| Fe II | 2382 | 1 | ||||
| 2 | ||||||
| 3 | ||||||
| 2+3 |
All values are logarithmic cm-2
 |
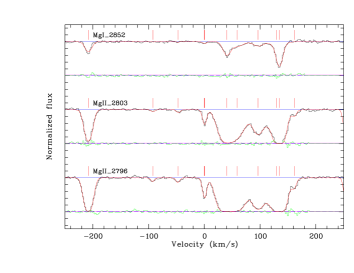
4.2 The intervening system 2
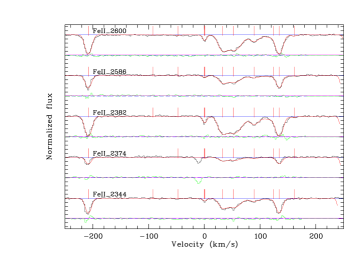
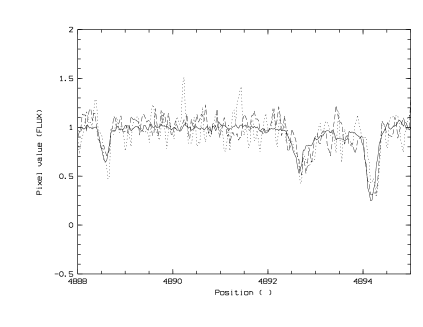
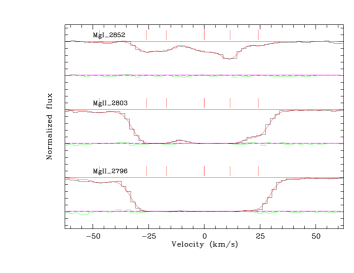
This is the most complex system, which spans the largest velocity range ( km s-1). A lot of absorption features are present at the redshift of , namely: the MgII 2796, 2803 doublet, MgI (2852) and FeII in several flavours (2344, 2374, 2382, 2586 and 2600). The first epoch spectrum required a ten component fit in order to obtain a good modeling to the data. Fig. 3 shows the absorption due to the MgII doublet and MgI 2852, while Fig. 4 displays all the features of FeII; in both figures the resuls of the ten component fit are also plotted. Table 4 reports the column densities for each component. No variability is detected in the three epochs within the uncertainty. This rules out column density variability for the intervening system 2. The only exception is represented by the second component of the MgII. Anyway, this specific component is strongly saturated, so the values reported in the corresponding column of Table 4 may not be entirely reliable.
The non variability of the features belonging to the second system can also be seen in Figs. 5-7, which display the MgII 2796, MgI 2852 and FeII 2600 features for the three epochs, respectively. This system is the only one showing an EW so we also computed the EWs of the absorption features for comparison with other works. The MgII2796 EW does not vary between the three observations at the confidence level, and a variability of this feature, if present, is less than 10% at the confidence level. The FeII 2600 and MgI 2852 rest frame EWs are EW and EW, respectively ( confidence). These values are not different from that observed along other GRB sightlines (see e.g. Cucchiara et al. 2009).
| Species | Trans. | Obs. | I (160 km s-1) | II (135 km s-1) | III (125 km s-1) | IV (90 km s-1) | V (50 km s-1) |
|---|---|---|---|---|---|---|---|
| VI (30 km s-1) | VII (0 km s-1) | VIII (-50 km s-1) | IX (-100 km s-1) | X (-210 km s-1) | |||
| Mg II | 2796 | 1 | |||||
| 2803 | 2 | ||||||
| 3 | |||||||
| 2+3 | |||||||
| 1 | |||||||
| 2 | |||||||
| 3 | |||||||
| 2+3 | |||||||
| Mg I | 2852 | 1 | |||||
| 2 | |||||||
| 3 | |||||||
| 2+3 | |||||||
| 1 | |||||||
| 2 | |||||||
| 3 | |||||||
| 2+3 | |||||||
| FeII | 2344, 2374 | 1 | |||||
| 2382 | 2 | ||||||
| 2586 | 3 | ||||||
| 2600 | 2+3 | ||||||
| 1 | |||||||
| 2 | |||||||
| 3 | |||||||
| 2+3 |
All values are logarithmic cm-2
 |
 |
 |
4.3 The intervening system 3
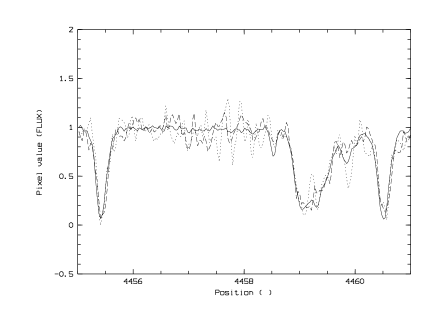
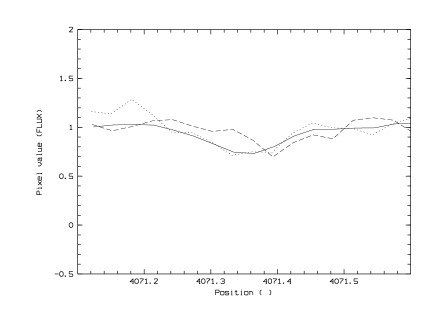
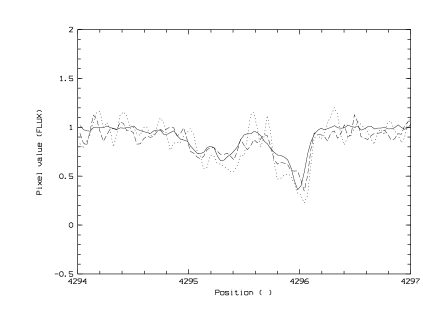
This is the simplest system among the intervening absorbers. Its velocity dispersion is just km s-1 and only two ions appear in the spectrum at the redshift of : MgII, with the classical 2796, 2803 doublet and FeII (2586 and 2600). All the three epoch spectra are well fit by a single component Voigt profile. Fig. 8 shows the absorption from the MgII and FeII features, together with our fit to the data. Table 5 reports the column densities measured for the three epochs. We can rule out a variability of both MgII and FeII lines, since the column densities of the three epochs are consistent within the level.
The non variability of the features belonging to the third system is also shown in Figs 9 and 10, which display the MgII 2796 and FeII 2600 features for the three epochs, respectively.
| Species | Trans. | Obs. | I (0 km s-1) |
|---|---|---|---|
| Mg II | 2796 | 1 | |
| 2803 | 2 | ||
| 3 | |||
| 2+3 | |||
| Fe II | 2586 | 1 | |
| 2600 | 2 | ||
| 3 | |||
| 2+3 |
All values are logarithmic cm-2
 |
 |
4.4 The intervening system 4
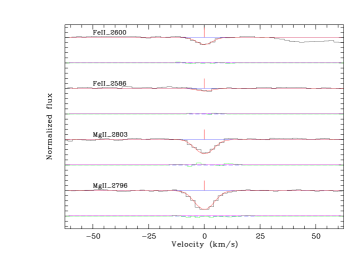
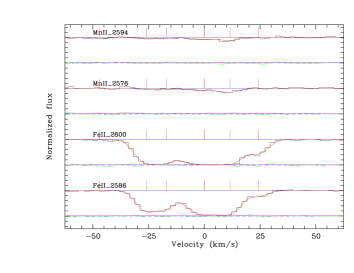
This is the system which shows the greatest number of species. Three ions, MgII (2796, 2803), FeII (2586, 2600), MnII (2576, 2594) and the neutral MgI (2852) appear in the spectrum at the redshift of . The velocity dispersion of the system is km s-1. Since both MgII features are strongly saturated, we used MgI and FeII to guide the identification of the components. The spectrum around these features results to be well fit by a six component model. Fig. 11 shows the absorptions from the MgII and MgI features, while Fig. 12 those from FeII and MnII. These figures also display our six component fit to the data. Table 6 reports the column densities measured for the three epochs divided by components. Variability can be excluded for MgI, FeII and MnII whose components are consistent in the three epochs within the uncertainty. MgII seems not to behave this way, but most of the components of its features are strongly saturated, so the corresponding column density values reported in the table are less reliable. Components 1 and 6 are not saturated (the former is not saturated only in the MgII 2803 feature), and they are consistent with no variability within the uncertainty. It is worth noting, however, that component 6 has a positive detection in the first observation only, while in the other epochs just upper limits can be set. Saturation is also present in component 2 and 3 of the FeII, but just in the first observation.
The non variability of the features belonging to the fouth system is also shown in Figs. 13-15, which display the MgII 2796, MgI 2852 and FeII 2600, features for the three epochs, respectively.
| Species | Trans. | Obs. | I (25 km s-1) | II (10 km s-1) | III (0 km s-1) | IV (-15 km s-1) | V (-25 km s-1) | VI (-50 km s-1) |
|---|---|---|---|---|---|---|---|---|
| Mg II | 2796 | 1 | ||||||
| 2803 | 2 | |||||||
| 3 | ||||||||
| 2+3 | ||||||||
| Mg I | 2852 | 1 | ||||||
| 2 | ||||||||
| 3 | ||||||||
| 2+3 | ||||||||
| Fe II | 2586 | 1 | ||||||
| 2600 | 2 | |||||||
| 3 | ||||||||
| 2+3 | ||||||||
| Mn II | 2576 | 1 | ||||||
| 2594 | 2 | |||||||
| 3 | ||||||||
| 2+3 |
All values are logarithmic cm-2
 |
 |
 |
5 Conclusions
In this paper we present high resolution (R=40000, corresponding to 7.5 km/s) spectroscopy of the optical afterglow of the “naked-eye” Gamma Ray Burst GRB080319B (), observed by UVES at the VLT in three different epochs, starting minutes, and hours after the trigger, respectively.
We concentrate here on the intervening absorbers along the GRB sightline, since the absorption features in the vicinity of the afterglow have already been studied and presented in D’Elia et al. (2009a). Our spectral coverage allows to analyze a redshift path for the MgII 2796 in the range . We are sensitive to lines with EW down to (at the confidence level), thanks to the extremely high S/N of the first RRM observation. At least four intervening systems between z = 0.8 and z = 0.5 have been identified. Most of them show a complex structure constituted by several components, similar to that of the intervening absorbers along the QSO sightlines (Churchill & Vogt 2001). All systems feature the MgII 2796, 2803 doublet. FeII, MgI and MnII lines are detected in four, two and one systems, respectively.
Prochter et al. (2006) claimed that the incidence of strong MgII absorbers along GRB sight lines is nearly four times higher than that along the line of sight to QSOs. They analyzed the spectra of 14 GRB optical afterglows, finding on average one intervening system per afterglow with equivalent width Å. The GRB080319B sightline confirms this trend, since the rest frame EW of the MgII 2796 absorption line is Å in one system.
Structured intervening systems are expected if the discrepancy between QSOs and GRBs intervening absorbers is due to a different size of the source, namely, if QSO emitting regions are larger than GRBs which in turn are comparable to the typical size of theMgII clouds (Frank et al. 2007). According to their estimation, the QSO beam size must be larger than 3 1016 cm while for the GRB beam they suggest a size around a few 1015 cm. To observe this effect, the MgII absorber should then be patchy with a clump size around 1016 cm. Nevertheless, in this scenario, variability in the column densities of the MgII absorbers along the GRB sightlines is expected. MgII variability in multi-epoch spectroscopy data on GRB060206 was first claimed by the analysis by Hao et al. (2007), but then disproved by Aoki et al. (2008) and Thöne et al. (2008). This work confirms the lack of variability in the column densities of the GRB intervening absorbers, in the specific case of GRB080319B. In particular, the EW of the MgII 2796 absorption line is consistent within in the three UVES observations. Given the S/N ratio of our data, we can conclude that a variability of this feature, if present, is less than 10% at the confidence level. This upper limit is three times smaller than the ones that can be estimated for GRB060206 using the data by Aoki et al. (2008). Racusin et al. (2008b) modeled the radiation of GRB080319B as coming from a structured jet constituted by an inner, narrow jet () and an outer, wider jet (). They interpreted the optical emission at s ( being the burst detection time) as produced by the reverse shock of the inner jet, while that at as the signature of the forward shock of the outer jet. Since the first UVES observation starts at while the second and the third ones start more than hr later, a strong increase in the size of the emitting region is expected from this scenario. In more detail, the dimension of the emitting region is cm at the beginning of the GRB event and cm a few hours later (Pandey et al. 2009, Racusin et al. 2008b and Kumar & Panaitescu 2008). Although we cannot be more quantitative, a variation of a factor of ten in the dimension of the emitting region would imply a considerable reduction of the intervening column densities, but it is not detected. Indeed, time resolved, high resolution spectroscopy allows us for the first time to exclude a significant () variability even by considering the single components of each intervening system alone.
Porciani et al. (2007) investigated several possible explanations for the strong MgII excess, namely, dust obscuration bias, clustering of the absorbers, different beam sizes of the sources, multiband magnification bias of GRBs, association of the absorbers with the GRB event or with the circumburst environment. They concluded that none of these effects alone can explain the observed difference, but maybe the combination of two or more of them can reduce the significance of the discrepancy. We can take advantage of the dimensions of the emitting source in GRB080319B and the lack of variability in the intervening absorbers to characterize the absorbers along this GRB sightline. Since these dimensions are in the range cm, the MgII (and other species) clouds cannot have clumps or structures smaller than pc, otherwise we should observe variability in their absorption. This is not obvious, since Ding et al. (2003) show that smaller intervening absorbers are present along the line of sight to QSOs.
Cucchiara et al. (2009) compared 81 QSOs and 6 GRB lines of sight obtained with UVES. They found no significant evidence to support a difference between the two absorber populations, concluding that a possible explanation for the MgII excess could be intrinsic to the GRB environment. A similarity between the narrow lines of the GRB intervening absorbers and that produced by the material ejected in the accretion disk winds of QSOs has been pointed out. Nevertheless, the high velocities required by the intervening redshifts () and the lack of fine structure features in these systems represent a strong weakness of this picture. In addition, Tejos et al. (2009) recently found no evidence for a similar excess considering the weak (Å) MgII systems along the line of sight of 8 GRB observed with echelle spectrographs. These authors tend to exclude an intrinsic nature of the discrepancy, since it would result in an excess in the weak systems too. They suggest that the best explanation available at present could be gravitational lensing bias due to lensing by the host galaxy of the absorber. Indeed the strong MgII system along the GRB080319B sightline has a velocity of km/s with respect to the GRB. The data do not show evidence either of broad profiles and/or partial coverage (see e.g. D’Odorico et al. 2004), so this absorber is likely an intervening system.
Combining the data by Prochter et al. (2006) with the results from the analysis in this paper and that in D’Elia et al. (2009b) regarding the line of sight to GRB080330, we obtain 16 strong (EWÅ) MgII intervening absorbers along 16 GRB sightlines. The total redshift path becomes , and this results in a . This surprising excess of strong MgII absorbers with respect to QSO sightlines remains a matter of debate and a satisfactory explanation is still missing. Clearly more observations and analysis are needed in order to solve this issue.
References
- (1) Aoki, K., Totani, T., Hattori, T. et al., 2008, PASJ, in press, arXiv:08084157
- (2) Ballester, P., Modigliani, A., Boitquin, O., et al.: 2000, ESO Messenger, 101, 31
- (3) Bergeron,J. & Boisse, P. 1991, A&A, 243, 344
- (4) Bloom, J.S., Perley, D.,A., Li, W. et al. 2008, ApJ, 691, 723
- (5) Bouche’, N., Murphy, M.T., Peroux, C., Csabai, I. & Wild, V., 2006, MNRAS, 371, 495
- (6) Churchill, C.W. & Vogt, S.S., 2001, AJ, 122, 679
- (7) Churchill, C.W., Kacprzak, G.G. & Steidel, C.C., 2005, in IAU Colloq. 199, Probing Galaxies through Quasar Absorption Lines, ed. P.R. Williams, C. Shuu & B. Menard (Cambridge: Cambridge Univ. Press), 24
- (8) Covino, S. et al., 2008a, GCN 7431
- (9) Covino, S. et al., 2008b, GCN 7446
- (10) Cucchiara, A. et al. 2008, GCN 7547
- (11) Cucchiara, A., Jones, T., Charlton, J. C., Fox, D. B., Einsig, D. & Narayanan, A., 2009, ApJ, 693, 345
- (12) Cwiok, M. et al. 2008, GCN 7439
- (13) Dekker, H, D’Odorico, S, Kaufer, A., Delabre, B., Kotzlowski, H., 2000, SPIE, 4008, 534D
- (14) D’Elia, V., Fiore, F., Meurs, E.J.A. et al., 2007, A&A 467, 629
- (15) D’Elia, V., Fiore, F., Perna, R. et al., 2009a, ApJ in press, arXiv:08042141
- (16) D’Elia, V., Fiore, F., Perna, R. et al., 2009b, accepted by A&A
- (17) Ding, J, Charlton, J.C., Bond, N.A., Zonak, S.G.; Churchill, C.W, 2003, ApJ, 587, 551
- (18) D’Odorico, V., Cristiani, S., Romano, D., Granato, G., Danese, L., 2004, MNRAS, 351, 976
- (19) Frank, S., Bentz, M.C., Stanek, K.Z., Mathur, S. Dietrich, M., Peterson, B.M. & Atlee, D.W., 2007, Ap&SS 312 325
- (20) Hao, H., Stanek, K.Z., Dobrzycki, A. et al., 2007, ApJ, 659, 99
- (21) Kacprzak, G.G., Churchill, C.W., Steidel, C.C & Murphy, M.T., 2008, AJ, 135, 922
- (22) Karpov et al. 2008, GCN 7452
- (23) Kumar, P., Panaitescu, A, 2008, MNRAS,391, 19L
- (24) Pandey, S.B., Castro-Tirado, A.J., Jelinek, M. et al., 2009, Accepted for publication in A&A, arXiv0904.1797
- (25) Piranomonte, S., Ward, P.A., Fiore, F. et al. 2008, A&A, 492, 775
- (26) Porciani, C., Viel, M. &Lilly, S.J., 2007, ApJ, 659, 218
- (27) Prochaska J.X., Chen, H.W., Dessauges-Zavadsky, M. & Bloom, J.S., 2007, ApJ, 666, 267
- (28) Prochter, G.E., Prochaska, J.X., Chen, H.-W. et al. 2006, ApJ, 648, L930
- (29) Rao, S.M., Turnshek, D.A. & Nestor, D.B., 2006, ApJ, 636, 610
- (30) Racusin, J.L. et al. 2008a GCN 7427
- (31) Racusin, J.L., Karpov, S.V., Sokolowski, M. et al., 2008b, Nature, 455, 183
- (32) Savaglio, S., 2006, New J. Phys, 8, 195
- (33) Steidel, C.C., Dickinson, M. & Persson, S.E., 1994, ApJ, 437, L75
- (34) Steidel, C.C., Adelberger, K.L., Giavalisco, M., Dickinson, M., Pettini, M. 1999, ApJ, 519, 1
- (35) Sudilovsky et al. 2007, ApJ, 669, 741
- (36) Tejos, N., Lopez, S., Prochaska, J.X., Chen, H.-W. & Dessauges-Zavadsky, M., 2007, ApJ, 671, 622
- (37) Tejos, N., Lopez, S., Prochaska, J.X., Bloom, J.S., Chen, H.-W., Dessauges-Zavadsky, M., Maureira, M.J., 2009, ApJ submitted, arXiv0905.3768
- (38) Thöne, C.C., Wiersema, K., Ledoux, C. et al. 2008, A&A, 489, 37
- (39) Vreeswijk, P.M., Ledoux, C., Smette, A. et al. 2007, A&A, 468, 83