A ionized reflecting skin above the accretion disk of GX 349+2
Abstract
Context. The broad emission features in the Fe-K region of X-ray binary spectra represent an invaluable probe to constrain the geometry and the physics of these systems. Several Low Mass X-ray binary systems (LMXBs) containing a neutron star (NS) show broad emission features between 6 and 7 keV and most of them are now interpreted as reflection features from the inner part of an accretion disk in analogy to those observed in the spectra of X-ray binary systems containing a Black Hole candidate.
Aims. The NS LMXB GX 349+2 was observed by the XMM-Newton satellite which allows, thanks to its high effective area and good spectral resolution between 6 and 7 keV, a detailed spectroscopic study of the Fe-K region.
Methods. We study the XMM data in the 0.7-10 keV energy band. The continuum emission is modelled by a blackbody component plus a multicolored disk blackbody. A very intense emission line at 1 keV, three broad emission features at 2.63, 3.32, 3.9 keV and a broader emission feature in the Fe-K region are present in the residuals. The broad emission features above 2 keV can be equivalently well fitted with Gaussian profiles or relativistic smeared lines (diskline in XSPEC). The Fe-K feature is better fitted using a diskline component at 6.76 keV or two diskline components at 6.7 and 6.97 keV, respectively
Results. The emission features are interpreted as resonant transitions of S xvi, Ar xviii, Ca xix, and highly ionized iron. Modelling the line profiles with relativistic smeared lines, we find that the reflecting plasma is located at less than 40 km from the NS, a value compatible with the inner radius of the accretion disk inferred from the multicolored disk blackbody component ( km). The inclination angle of GX 349+2 is between 40∘ and 47∘, the emissivity index of the primary emission is between -2.4 and -2, and the reflecting plasma extends up to (2-8) cm.
Conclusions. We compare our results with the twin source Sco X-1 and with the other NS LMXBs showing broad relativistic lines in their spectra. We conclude that the blackbody component in the spectrum is the primary emission that hits the inner accretion disk producing the emission lines broadened by relativistic and Doppler effects dominant around the neutron star.
Key Words.:
line: identification – line: formation – stars: individual (GX 349+2) — X-rays: binaries — X-rays: general1 Introduction
Low-mass X-ray binaries (LMXBs) consist of a low-mass star () and a neutron star (NS), which generally has a relatively weak magnetic field (G). In these systems, the X-ray source is powered by accretion of mass overflowing the Roche lobe of the companion star and forming an accretion disk around the neutron star. LMXBs containing a neutron star (NS LMXBs) are generally divided into Z and Atoll sources, according to the path they describe in an X-ray Color-Color Diagram (CD) or hardness-intensity diagram (Hasinger & van der Klis, 1989) assembled by using the source count rate and colors calculated over a typical (usually 2-20 keV) X-ray energy range. Atoll sources are usually characterized by relatively low luminosities (0.01-0.2 LEdd ) and often show transient behavior, while the Z sources in the Galaxy are among the most luminous LMXBs, persistently accreting close to the Eddington limit (LEdd) for a 1.4 M⊙ NS. The position of an individual source in the CD, which determines most of the observed spectral and temporal properties of the source, is thought to be an indicator of the instantaneous mass accretion rate (e.g. Hasinger et al., 1990; van der Klis, 1995, for a review). It has been suggested that the mass accretion rate (but not necessarily the X-ray luminosity) of individual sources increases along the track from the top left to the bottom right, i.e. from the islands to the banana branch in atoll sources and from the horizontal branch (hereafter HB) to the normal branch (NB) and to the flaring branch (FB) in Z sources.
GX 349+2, also known as Sco X-2, was called an odd-ball among the Z sources (Kuulkers & van der Klis, 1998). Similar to the case of Sco X-1, GX 349+2 shows a short and underdeveloped HB (if at all). The source variability in the frequency range below 100 Hz is closely correlated with the source position on the X-ray CD, as in other Z sources. Quasi periodic oscillations at kHz frequencies (kHz QPO) were detected in the NB of its Z-track (Zhang, Strohmayer, & Swank, 1998). However, GX 349+2, which sometimes shows broad noise components changing not only with the position in the Z, but also as a function of the position in the hardness-intensity diagram, differs somewhat from the other Z sources and shows similarities to the behavior seen in bright atoll sources, such as GX 13+1 and GX 3+1 (Kuulkers & van der Klis, 1998; O’Neill et al., 2001, 2002).
Di Salvo et al. (2001), using BeppoSAX data, showed that the source energy spectrum below 30 keV could be well fit by a blackbody (with a temperature of 0.5-0.6 keV) and a Comptonized component (with seed-photon temperature of 1 keV and electron temperature of 2.7 keV). Three discrete features were observed in the spectrum: an emission line at 1.2 keV, probably associated to L-shell Fe xxiv or Ly- Ne x, an emission line at 6.7 keV (Fe xxv) and an absorption edge at 8.5 keV, both corresponding to emission from the K-shell of highly-ionized iron (Fe xxv). Iaria et al. (2004), analysing a long BeppoSAX observation, found similar parameters of the the continuum components below 30 keV, detected the presence of emission lines associated to Fe xxiv and Fe xxv, and detected an emission line at 2.65 keV associated to S xvi. The long BeppoSAX observation allowed to study changes of the parameters of the Fe xxv emission line along the position of the source in the CD from the NB/FB apex to the FB inferring that the equivalent width of the line decrease from 77 eV to 18 eV going from the NB/FB apex to the FB. The width of the Fe xxv emission line, modelled by a Gaussian line, was between 250 and 300 eV.

Recently Cackett et al. (2008), analysing two Suzaku observations of GX 349+2, modelled the Fe xxv emission line with a relativistic smeared line (diskline in XSPEC). The authors constrained the energy of the line to be between 6.4 and 6.97 keV finding that the line energy was keV, associated to Fe xxvi and not compatible with a Fe xxv iron line as previously obtained by Iaria et al. (2004) and Di Salvo et al. (2001). The emissivity index, , was , the inner radius in gravitational radii, , was , the inclination angle of the source was degrees, the equivalent width of the line was eV.
In this paper we analyse an XMM-Newton observation of GX 349+2 finding that the prominent relativistic line is well constrained around 6.7 keV and identified as the resonant transition of Fe xxv. In the following we discuss our results and compare them with the recent literature.
2 Observation

The XMM-Newton Observatory (Jansen et al., 2001) includes three 1500 cm2 X-ray telescopes each with an European Photon Imaging Camera (EPIC, 0.1–15 keV) at the focus. Two of the EPIC imaging spectrometers use MOS CCDs (Turner et al., 2001) and one uses pn CCDs (Strüder et al., 2001). Reflection Grating Spectrometers (RGS, 0.35–2.5 keV, den Herder et al., 2001) are located behind two of the telescopes. The region of sky containing GX 349+2 was observed by XMM-Newton between 2008 March 19 16:42:41 UT to March 19 22:58:55 UT (OBSid 0506110101) for a duration of 22.5 ks. Since GX 349+2 is one of the brightest X-ray sources, in order to minimize the effects of telemetry saturation and pile-up the MOS1 and MOS2 instruments were switched off and the EPIC-pn camera was operated in Timing mode with medium filter during the observation. In this mode only one central CCD is read out with a time resolution of 0.03 ms. This provides a one dimensional (4′.4 wide) image of the source with the second spatial dimension being replaced by timing information. The faster CCD readout results in a much higher count rate capability of 1500 cts/s before charge pile-up become a serious problem for point-like sources. The EPIC-pn telemetry limit is approximatively 450 c/s for the timing mode111see Tab. 3 in XMM-Newton Users Handbook published on 15 July 2008. If the rate is higher, then the counting mode is triggered and part of the science data are lost. This is the case of the observation presented in this work; saturation occurs for a 55% of the observing time, giving an exposure time of 22.5 ks for RGS1 and RGS2, respectively, and 10 ks for EPIC-pn.
We plot the Epic-pn lightcurve in the 1-10 keV energy range in Fig. 1 which clearly shows that the count rate is largely variable. To understand whether the variability of the source intensity is energy dependent we extract the lightcurves in the 1-4 keV and 4-10 keV energy range, respectively, and plot the hardness ratio [4-10 keV]/[1-4keV] versus the count rate in the 1-10 keV energy range in Fig. 2. We find that the spectrum becomes harder for a count rate below 1580 c/s corresponding to the time interval between 104 and s from the start of the observation.
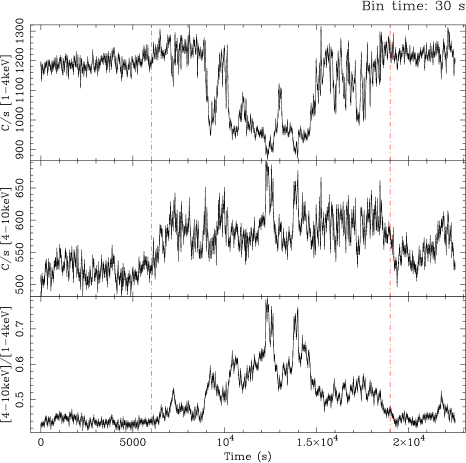
Plotting the 1-4 keV, 4-10 keV lightcurve and the [4-10 keV]/[1-4keV] hardness ratio versus time (see Fig. 3), it seems that there is no correlation between the 1-4 keV and 4-10 keV count rate. The 1-4 keV count rate is quite constant at 1200 c/s between 0 and s and between and s from the start, and it decreases between and s, showing some flaring activity. The 4-10 keV count rate is quite constant at 530-550 c/s between 0 and s and between and s, while increases to 600 c/s between and s.
Since the count rate of the source is variable, we divide the lightcurve into three time intervals as indicated in Fig. 3 by the red dot-dashed lines. We base our choice on the 4-10 keV count rate that is 550 c/s in the first and third time interval and it is around 600 c/s in the second time interval. Our choice allows to highlight possible changes in the Fe-K region of the spectrum. In Tab. 1 we report the exposure times of the selected time intervals for RGS1, RGS2 and EPIC-pn instruments.
| Time interval | RGS1 | EPIC-pn | |
|---|---|---|---|
| s - TSTART[s] | ks | ks | |
| INT. 1 | 0-6000 | 6.0 | 2.6 |
| INT. 2 | 6000-19000 | 13.0 | 5.8 |
| INT. 3 | 19000 | 3.5 | 1.6 |
Note — The observation was divided into three time intervals as shown in Fig. 3. In the first column we report the temporal boundaries of each interval with respect to the start time of the observation. In the second and third column we report the exposure times, in kiloseconds, for RGS1, RGS2, and EPIC-pn during the three time intervals.
2.1 Spectral analysis of the averaged spectrum
We extract the X-ray data products of RGS and EPIC-pn camera using the Science Analysis Software (SAS) version 8.0.0 extracting only single and double events (patterns 0 to 4) from EPIC-pn data. Initially we extracted source EPIC-pn events from a wide column (RAWX between 29 and 45) centered on the source position (RAWX). Background events were obtained from a box of the same width with RAWX between 2 and 18.
The 0.5-12 keV Epic-pn count rate extracted from the source region is almost 1800 c/s, since the maximum Epic-pn count rate should be 800 c/s to avoid a deteriorated response due to photon pile-up222see Tab. 3 in XMM-Newton Users Handbook published on 15 July 2008, we expect presence of pile-up. We checked the pile-up fraction at different energies using the epatplot tool in SAS
| Energy | Pile-up (%) | Pile-up (%) |
|---|---|---|
| (keV) | RAWX [29:45] | RAWX [29:36] and RAWX[39:45] |
| 5 | ||
| 6 | ||
| 7 | ||
| 8 | ||
| 9 | ||
| 10 |
Note — The associated errors are reported at 1 . In the first column we report the energies, in the second, and third column the estimated percentage of photon pile-up extracting the events from the whole source region and excluding the brightest columns at RAWX and RAWX, respectively.
| Parameters | Single Fe-K | Fe xxv-Fe xxvi |
|---|---|---|
| Em. Line | Blending | |
| NH (1022 cm-2) | ||
| kTBB (keV) | ||
| NBB (10-1) | ||
| kTDISKBB (keV) | ||
| NDISKBB | ||
| E1keV (keV) | ||
| (eV) | ||
| I1keV (10-3 ph cm-2 s-1) | ||
| Equiv. width (eV) | ||
| significance () | 14 | 18 |
| E (keV) | 2.62 (fixed) | 2.62 (fixed) |
| (eV) | 140 (fixed) | 140 (fixed) |
| I (10-3 ph cm-2 s-1) | ||
| Equiv. width (eV) | ||
| significance () | 7 | 7 |
| E (keV) | ||
| (eV) | ||
| I (10-3 ph cm-2 s-1) | ||
| Equiv. width (eV) | ||
| significance () | 15 | 6 |
| E (keV) | ||
| (eV) | ||
| I (10-3 ph cm-2 s-1) | ||
| Equiv. width (eV) | ||
| significance () | 9 | 9 |
Note — Best-fit values of the parameters obtained for the averaged spectrum fitting the emission features with Gaussian profiles. Uncertainties are at the 90% confidence level for a single parameter. The parameters are defined as in XSPEC. The continuum emission is fitted with a blackbody plus a multicolored disk blackbody, diskbb. The four broad emission features are modelled adopting Gaussian components. All components are subject to interstellar absorption.
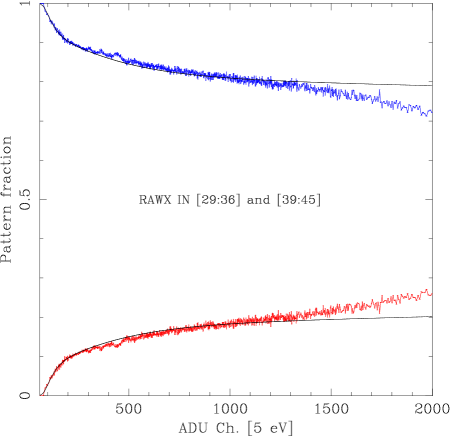
finding a photon pile-up percentage of 1.3%, 2%, 3.2%, 5.1%, 7.4%, and 9.8% at 5, 6, 7, 8, 9, and 10 keV, respectively. The values with the associated errors are reported in Tab. 2. Since our aim is the study of the Fe-K region of the spectrum we investigated how to minimize the photon pile-up effects in the energy range 5-8 keV. Initially we extracted the source EPIC-pn spectrum excluding the brightest column (RAWX) in the CCD finding that the photon pile-up fraction did not change significantly; we obtained a photon pile-up percentage of 1.1%, 1.7%, 3.1%, 4.7%, 6.7%, and 9.2% at 5, 6, 7, 8, 9, and 10 keV, respectively. Finally, excluding the two brightest columns at RAWX and RAWX, we found a photon pile-up fraction of 0.2%, 0.6%, 1.6%, 1.9%, 4.8%, and 6.5% at 5, 6, 7, 8, 9, and 10 keV, respectively. In this case the 0.5-12 keV Epic-pn count rate is 920 c/s. The photon pile-up percentage values with the associated errors are reported in Tab. 2 and the plot of the fraction patterns of single and double events are shown in Fig. 4. After this investigation we choose to extract the Epic-pn spectrum excluding the two brightest columns at RAWX and RAWX from the source region to avoid any doubt on the validity of our analysis.
Since the high available statistics the EPIC-pn spectrum shows evident calibration issues between 2 and 2.5 keV due to the Au edge near 2.3 keV, we excluded the EPIC-pn data between 2.1 and 2.5 keV from our analysis. The EPIC-pn spectrum has been rebinned not to oversample the energy resolution by more than a factor 4 and to have 20 counts per energy channel. The adopted Epic-pn energy range is 0.7-2.1 keV and 2.5-10 keV. The spectrum is fitted using XSPEC version 12.3.1
The extracted RGS1 spectrum does not show instrumental issues and we select data in the 0.6-2 keV energy band for our analysis. The extracted RGS2 spectrum shows calibration problems in CCD 9 and we will not use data from this instrument for our analysis. Since we are interested in the study of the Fe-K region, in the following we concentrate out spectral analysis on the Epic-pn data, after having checked that the RGS1 spectrum was consistent with the Epic-pn data and does not show more features.
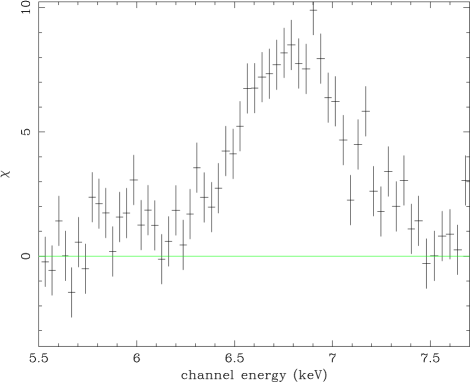
The continuum emission is fitted adopting the same model recently proposed by Cackett et al. (2008) for the Suzaku spectrum of GX 349+2: i.e. a blackbody component plus a multicolored disk blackbody (DISKBB in XSPEC) both absorbed by neutral neutral matter (WABS in XSPEC); because of the narrower energy range of our Epic-pn data (0.7-10 keV) with respect to the Suzaku data we did not add to the model a power-law component necessary to fit the Suzaku data above 10 keV. We obtained a reduced with 282 degree of freedom (d.o.f.). The residuals, plotted in Fig. 5, suggest the presence of broad emission lines at 1, 2.7, 3.35, 3.9 keV and, finally a broader emission line between 6 and 7 keV.

Initially, we added five Gaussian components to fit these emission features. Since the line around 2.7 keV is near the hole in the Epic-pn data, we fixed the energy of the line at 2.62 keV, imposing that it is associated to the Ly- S xvi transition, furthermore we fixed its width at 140 eV. We obtain a and a improvement of . The significance in units of of the lines at 1, 2.62, 3.32, 3.9, and 6.7 keV are 14, 7, 15, 9, and 13, respectively.
The best-fit values are reported in Tabs. 3 (column 2) and 4 (column 2). We identify the broad emission lines centered at keV, keV, and keV as a Fe xxii transition, Ly- Ar xviii transition, and resonance transition of Ca xix, respectively. The centroid of the broader line between 6 and 7 keV is not identifiable because we find a line centered at keV. We also note that, while the FWHMs of the broad lines below 6 keV are between 0.2 and 0.4 keV, the broader line in the Fe-K region has a FWHM of 0.6–0.7 keV (the line profile is visible in the residuals shown in Fig. 6).
We have also investigated the possibility that the Fe-K feature is a blending of lines. We fitted the broad Fe-K emission feature as a blending of Fe xxv (6.7 keV) and Fe xxvi (6.97 keV) emission lines adopting two Gaussian profiles and fixing their energies at the expected rest-frame values; the values of the fit are reported in Tabs. 3 (column 3) and 4 (column 3). Even in this case the Fe xxv and Fe xxvi emission lines appear to be broad, having widths of 200 eV (FWHM0.5 keV).
Under the hypothesis that the broadening of the lines is produced by the relativistic motion of the emitting plasma in the accretion disk close to the neutron star, we fit the line profiles at 2.62, 3.32, 3.90, and 6.80 keV with relativistic disk line components (DISKLINE in XSPEC). Assuming that the emission features are produced in the same region, we impose that the inner radius, the outer radius, the emissivity index, and the inclination angle of the system are the same for all these components. Adding these components to the continuum emission we find a slightly better fit, .
| Parameters | Single Fe-K | Fe xxv-Fe xxvi |
| Em. Line | Blending | |
| EBroad (keV) | – | |
| (eV) | – | |
| IBroad (10-3 ph cm-2 s-1) | – | |
| Equiv. width (eV) | – | |
| significance () | 13 | – |
| E (keV) | – | 6.70 (fixed) |
| (eV) | – | |
| I (10-3 ph cm-2 s-1) | – | |
| Equiv. width (eV) | – | |
| significance () | – | 7 |
| E (keV) | – | 6.97 (fixed) |
| (eV) | – | |
| I (10-3 ph cm-2 s-1) | – | |
| Equiv. width (eV) | – | |
| significance () | – | 5 |
Note — See Tab. 3.

| Parameters | Aver. spectrum | Spectrum 1+3 | Spectrum 2 |
|---|---|---|---|
| NH (1022 cm-2) | 0.735 (fixed) | 0.735 (fixed) | |
| kTBB (keV) | |||
| NBB (10-1) | |||
| kTDISKBB (keV) | |||
| NDISKBB | |||
| E1keV (keV) | |||
| (eV) | |||
| I1keV | |||
| Equiv. width (eV) | |||
| emiss. index | |||
| Rin () | |||
| Rout () | 1980 (fixed) | 1980 (fixed) | |
| (degrees) | 41.4 (fixed) | 41.4 (fixed) | |
| E (keV) | 2.62 (fixed) | 2.62 (fixed) | 2.62 (fixed) |
| I | |||
| Equiv. width (eV) | |||
| E (keV) | |||
| I | |||
| Equiv. width (eV) | |||
| E (keV) | |||
| I | |||
| Equiv. width (eV) | |||
| E (keV) | |||
| I | |||
| Equiv. width (eV) | |||
Note — Uncertainties are at the 90% confidence level for a single parameter. The parameters are defined as in XSPEC. The continuum emission is fitted with a blackbody plus a multicolored disk blackbody, diskbb. The four broad emission features are modelled adopting diskline components. All components are subject to interstellar absorption. The intensity of the lines are in units of 10-3 ph cm-2 s-1.
| Parameters | Aver. spectrum | Spectrum 1+3 | Spectrum 2 |
|---|---|---|---|
| NH (1022 cm-2) | 0.734 (fixed) | 0.734 (fixed) | |
| kTBB (keV) | |||
| NBB (10-1) | |||
| kTDISKBB (keV) | |||
| NDISKBB | |||
| E1keV (keV) | |||
| (eV) | |||
| I1keV | |||
| Equiv. width (eV) | |||
| emiss. index | |||
| Rin () | |||
| Rout () | 3600 (fixed) | 3600 (fixed) | |
| (degrees) | 43 (fixed) | 43 (fixed) | |
| E (keV) | 2.62 (fixed) | 2.62 (fixed) | 2.62 (fixed) |
| I | |||
| Equiv. width (eV) | |||
| E (keV) | |||
| I | |||
| Equiv. width (eV) | |||
| E (keV) | |||
| I | |||
| Equiv. width (eV) | |||
| E (keV) | 6.70 (fixed) | 6.70 (fixed) | 6.70 (fixed) |
| I | |||
| Equiv. width (eV) | |||
| E (keV) | 6.97 (fixed) | 6.97 (fixed) | 6.97 (fixed) |
| I | |||
| Equiv. width (eV) | |||
Note — See Tab. 5.
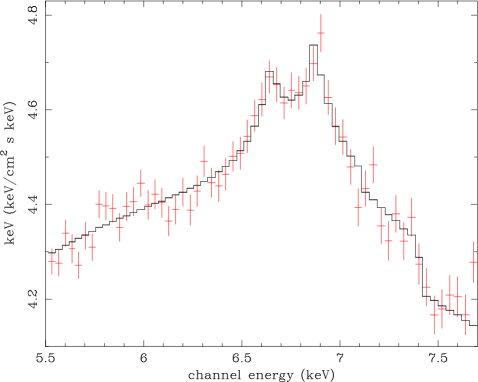
We find that the emissivity index of the accretion disk is , the inner radius is less than 25 gravitational radii (, hereafter ), corresponding to 52 km for a NS mass of 1.4 M⊙, and the inclination angle of the system is 41∘. The best-fit values of the parameters are reported in Tab. 5 (column 2); we plot data and residuals in the 0.7-10 keV energy band and the corresponding unfolded spectrum in the Fe-K region in Fig. 7 and Fig. 8, respectively.
The Fe-K line has an energy of keV and it is not compatible (at 90% confidence level) with the rest-frame value of Fe xxv transition (6.7 keV). We therefore tried to fit the Fe-K broad feature adopting two diskline components associated to Fe xxv and Fe xxvi transitions. We fixed the energy values at 6.7 and 6.97 keV, respectively. The best-fit parameters are reported in Tab. 6 (column 2), in this case we obtain and similar parameters of the emissivity index and inclination angle of the source. We find an emissivity index of , an inner radius less than 26 , corresponding to 52 km for a NS mass of 1.4 M⊙, and an inclination angle of the system of deg.
The extrapolated absorbed and unabsorbed flux in the 0.1-100 keV energy range was and erg cm-2 s-1, respectively. We obtain an equivalent hydrogen column density of cm-2; the same value was obtained by Christian & Swank (1997) using the Einstein solid-state spectrometer (SSS; 0.5-4.5 keV), estimating a distance to the source of kpc (hereafter we will use this distance). Adopting this value as distance to the source the extrapolated unabsorbed luminosity in the 0.1-100 keV energy range was erg s-1.
2.2 Spectral analysis of the selected time intervals
To study possible changes of the broad emission line in the Fe-K region of the XMM spectrum of GX 349+2 we extracted the EPIC-pn spectrum from the interval 2 (Spectrum 2) and from the intervals 1 and 3 together (Spectrum 1+3). Since the 4-10 keV lightcurve (Fig. 3, middle panel) indicates a higher count rate in the time interval 2 than in the time intervals 1 and 3, we expect a harder spectrum corresponding to the time interval 2. The lower statistics in the time selected spectra, due to the lower exposure times, requires that we fix some parameters of the diskline components. We fixed the outer radius and the inclination angle of the system to the values obtained fitting the spectrum corresponding to the whole observation. Initially we adopted only a diskline component to fit the Fe-K broad feature obtaining an energy value of and keV corresponding to Spectrum 1+3 and 2, respectively. We note that while the line energy is compatible with a Fe xxv transition for Spectrum 1+3, it is not for Spectrum 2, that is when the count rate in the 4-10 keV energy band increases. The best-fit values are reported in Tab. 5 (column 3 and 4).
As a consequence of this result we fitted the Fe-K broad feature in Spectra 2 and 1+3 adopting two diskline components with energies fixed at 6.7 and 6.97 keV. Also in this case we fixed the outer radius and the inclination angle of the system to the values obtained fitting the average spectrum. The best-fit values are reported in Tab. 6 (column 3 and 4). We find that the main differences between Spectrum 1+3 and Spectrum 2 is the value of the blackbody normalization that is larger in Spectrum 2. Also we note that the flux of the line at 1 keV, the S xvi line, the Ar xviii line, the Ca xix line, and Fe xxv line is lower in Spectrum 2 than Spectrum 1+3 while the flux of the Fe xxvi line is larger in Spectrum 2 than Spectrum 1+3. In the following section we discuss all these results.
3 Discussion
We performed a spectral analysis of a 22.5 ks XMM observation of GX 349+2 in the 0.7-10 keV energy range. The large flux from the source caused a telemetry overflow in the EPIC-pn data collection, resulting an effective exposure time of 10 ks. We fit the continuum emission adopting a blackbody plus a multicolored disk blackbody and both these components are absorbed by neutral matter. Five emission features were clearly visible in the spectrum.
Initially we fitted these features using Gaussian profiles and finding their energies at 1.05, 2.62 (fixed), 3.32, 3.9, and 6.8 keV. The corresponding widths and equivalent width were 90, 140 (fixed), 190, 100, and 280 eV, respectively, and 22, 6, 12, 9 and 49 eV, respectively. We associated the first four lines to L-shell Fe xxii-xxiii transition, Ly- S xvi, Ly- Ar xviii, and Ca xix resonance transition, respectively. The broader emission feature in the Fe-K region was not identifiable, hence we supposed that it is a blending of Fe xxv and Fe xxvi emission lines. Fitting the broad feature adopting two Gaussian profiles centered at 6.7 and 6.97 keV we obtained that their corresponding widths were 220 and 280 eV. We conclude that if the Fe-k feature is a blending of Fe xxv and Fe xxvi emission lines, these lines are intrinsically broad.
BeppoSAX observed three emission lines in the spectrum of GX 349+2 (Iaria et al., 2004; Di Salvo et al., 2001): the first one centered at keV, interpreted as L-shell Fe xxiv transition, the second at keV, interpreted as Ly- S xvi transition and, finally, the third at keV, interpreted as Fe xxv transition. In this observation we find that the centroid of the broad emission line at 1 keV is at a lower energy suggesting a L-shell transition of less ionized iron (Fe xxii-xxiii) although we cannot exclude a more complex blending of Fe xxi-xxiv. The widths and equivalent widths of these three lines are very similar comparing our observation and the two BeppoSAX observations of GX 349+2 (Iaria et al., 2004; Di Salvo et al., 2001) in the non-flaring state. Iaria et al. (2004) found, during interval 2 in the non-flaring state, widths of , and eV, and equivalent widths of , , and eV corresponding to the Fe xxiv, S xvi, and Fe xxv emission lines. Furthermore, Di Salvo et al. (2001) obtained equivalent widths for the Fe-K line of 71 eV and 34 eV, in the non-flaring and flaring state of the source, respectively. From these rough comparisons it seems that the source is in a non-flaring state during the observation discussed in this work, although we cannot assert this conclusion without an accurate analysis of the time variabilities.
These emission features can be fitted slightly better adopting smeared relativistic lines. The large widths of the lines suggest that these are produced by reflection of the primary spectral component by the accretion disk. Similar broad emission features, discussed as smeared lines were recently observed in several systems containing a neutron star, such as Ser X-1 (Bhattacharyya & Strohmayer, 2007), SAX J1808.4-3658 (Papitto et al., 2009; Cackett et al., 2009a), 4U 1705-44 (Di Salvo et al., 2005, 2009), GX 340+0 (D’Aì et al., 2009), 4U 1636-536 (Pandel et al., 2008), X 1624-490 (Iaria et al., 2007), and 4U 1820-30 and GX 349+2 (Cackett et al., 2008), and authors of these papers agree to interpret the broadening as due to relativistic and Doppler effects. In the following we show the self-consistency of the disk reflection scenario discussing the parameters reported in Tab. 6.
We infer the inner radius of the accretion disk, , using the normalization value of the multicolored disk blackbody and the inclination angle of the source, deg, obtained by the relativistic smeared line, finding that is and km for Spectrum 1+3 and 2, respectively. . The blackbody radius, , inferred by the best-fit values of the blackbody normalization is and km for Spectrum 1+3 and 2, respectively, too small to be associated to the X-ray emission from the NS surface.
Taking into account possible modifications of the multicolored disk blackbody component due to electron scattering (Shakura & Syunyaev, 1973; White et al., 1988), the measured color temperature, , is related to the effective temperature of the inner disk, , where is the spectral hardening factor, and . Adopting as estimated by Shimura & Takahara (1995) for a luminosity around 10% of the Eddington limit, close to the 25% of the Eddington limit estimated for GX 349+2 in our analysis, the corrected value of is km. The radius of the accretion disk is compatible with the value of the inner radius obtained by the relativistic smeared lines, that is, assuming a neutron star mass of 1.4 M⊙, km and km, for Spectrum 1+3 and 2, respectively. In the same way, correcting the radius of the blackbody component for the electron scattering, we infer that km. This radius is compatible with the NS radius and suggests that the blackbody component is produced very close the NS surface. In this scenario we directly observe the emission from inside the inner radius of the accretion disk, that is close the NS surface, and the blackbody component is interpreted as the direct emission from a compact corona and/or a boundary layer (BL) located between the neutron star and the inner radius of the disk. We should expect a Comptonized emission from the compact corona and/or BL, but if it is optically thick the Comptonized component results saturated and mimics a blackbody emission in the adopted energy range.
We observe, for the first time, reflection from the inner accretion disk that involves not only the K-transitions of iron but also ions of lighter elements as Sulfur, Argon and Calcium which all correspond to a similar ionization parameter. We observe emission lines associated to S xvi, Ar xviii, Ca xix, and Fe xxv, which correspond to a ionization parameter Log. A similar detection was recently reported by Di Salvo et al. (2009) analysing XMM data of 4U 1705–44.
Using the relation , where is the unabsorbed luminosity in the 0.1-100 keV, the electron density of the plasma, and the distance from the source of the emitting plasma we can roughly estimate the electron density adopting as distance from the source the inner and outer accretion disk radius, and , obtained from the diskline components. We obtain that the electron density decreases from to cm-3 going from the inner to the outer radius. These values of electron densities are in agreement with the values reported by Vrtilek et al. (1993), who estimated the electron density of an extended cloud to be cm-3 near the equatorial plane at a distance from the neutron star surface lower than cm (see Fig. 2 in Vrtilek et al., 1993).
From the analysis of the two selected spectra we find that the extrapolated (not absorbed) flux in the 0.1–100 keV band of the multicolored disk blackbody is approximatively constant: and erg cm-2 s-1 for Spectrum 1+3 and 2, respectively. The blackbody component has a larger flux in Spectrum 2 ( erg cm-2 s-1) than in Spectrum 1+3 ( erg cm-2 s-1). This suggests that the intensity change during the observation is driven by the blackbody component. In our scenario the blackbody component is associated to the emission from a BL around the compact object and this emission illuminates the surface of the inner accretion disk producing the reflection lines observed in the spectra. We note that the line fluxes are larger in Spectrum 1+3 than in Spectrum 2 except for the flux associated to the Fe xxvi line which shows an anticorrelated behaviour.
Our scenario may easily explain these results: in fact, if the emission from the BL increases, the flux illuminating the accretion disk increases, then the ionization parameter of the reflecting matter also increases under the hypothesis that the density of the matter does not change. This implies that transitions of heavier ions are more probable, since lighter ions as S xvi, Ar xviii, Ca xix, and Fe xxv decrease in number while heavier ions as Fe xxvi increase in number, giving as results a larger flux of the Fe xxvi line and a lower flux of the other lines.
GX 349+2 is a NS LMXBs belonging to the Z-class sources and its behaviour is very similar to the prototype of its class Sco X-1. Steeghs & Casares (2002) analysed the optical spectrum of Sco X-1 and obtained a firm mass ratio limit of from the phase-resolved spectroscopy, where is the ratio of the companion star mass to the neutron star mass. If we assume that the optical periodicity of hours, observed in GX 349+2 by Wachter & Margon (1996), is the orbital period of the system, the mass function of GX 349+2 is M⊙ (see Wachter & Margon, 1996). We find that the inclination angle of the system is deg. Assuming a neutron star mass of 1.4 M⊙ we find , a value very similar to the upper limit estimated for Sco X-1, giving a mass of the companion star of M⊙, typical for a NS LMXB of the Z class ( for Sco X-1, Steeghs & Casares, 2002; for Cyg X-2, Casares et al., 1997).
Furthermore Sco X-1 shows twin compact radio lobes forming an angle, with respect the line of sight, of deg (error at 1 , see Fomalont et al., 2001). If the jet from the source producing the radio lobes is almost perpendicular to the equatorial plane of the system then the angle of deg corresponds to the inclination angle of the system, similar to the inclination angle of deg obtained for GX 349+2 in this work. Our results indicate that Sco X-1 and GX 349+2 are very similar sources, as already suggested by other authors (see e.g. Kuulkers & van der Klis, 1998).
Although our scenario looks reasonable, our values of the diskline parameters are not compatible with the recent ones reported by Cackett et al. (2008). Cackett et al. analysing Suzaku data of GX 349+2 fitted the broad emission feature in the Fe-K region adopting a smeared relativistic line with the outer radius fixed at 1000 . They found a line energy associated to Fe xxvi, an inner radius of km, an emissivity index of and, finally, an inclination angle of the system of . The differences in line energy, emissivity index, and inner radius of the reflecting skin could be explained supposing that GX 349+2 was observed in a different spectral state. We find that the Fe-K broad emission feature is associated to Fe xxv line or to a blending of Fe xxv and Fe xxvi in which the Fe xxv line is more intense. Our measurement is similar to the previous BeppoSAX observations of GX 349+2 (Di Salvo et al., 2001; Iaria et al., 2004) and to the two recent Chandra observations of this source (Cackett et al., 2009b). In all these observations GX 349+2 was in NB/FB and/or in the bottom part of the FB. The only exception is the Suzaku observation of GX 349+2 (Cackett et al., 2008) where the broad emission line seems associated to Fe xxvi suggesting that the source was in a different state; in fact, as discussed by Cackett et al., it is possible that GX 349+2 was in NB during that observation.
However, the different inclination angles of the system obtained in this work and by Cackett et al. (2008) cannot be easily explained since the inclination angle of the system should not depend on the state of the source and should not change. Using the inclination angle obtained by Cackett et al. we obtain a mass ratio and a companion star mass of M⊙ for a neutron star mass of 1.4 M⊙, that is quite unusual for a NS LMXBs.
Higher statistics spectroscopic studies are needed to put tighter constraints on the system parameters of this source, since these can give important informations on the whole binary system and on the physics of the accretion flow close to the compact object.
4 Conclusions
We analysed a XMM observation of GX 349+2 finding the presence of prominent emission features associated to S xvi, Ar xviii, Ca xix, Fe xxv and, possibly, Fe xxvi. The emission features can be fitted with relativistic smeared lines (diskline). The continuum emission was fitted adopting a multicolored disk blackbody plus a blackbody component. We investigated the scenario in which the broad emission lines are formed by reflection from a ionized skin in the inner region of the accretion disk illuminated by the emission of a compact corona (or a boundary layer) surrounding the neutron star that we fitted with a blackbody component with a temperature of 1.8 keV. We find a self-consistent explanation of our results. The inner radius of the disk blackbody is km while the broad lines give an inner disk radius less than 40 km from the neutron star center. We discuss that the electron density of the reflecting plasma is between and cm-3 and that the inclination angle of the source is around 43∘. Finally, we infer that, for an inclination angle of 43∘, the mass of the companion star is 0.78 M⊙.
Acknowledgements.
We are very grateful to the referee for his/her suggestions and comments. This paper is published despite the effects of the Italian law 133/08. This law drastically reduces public founds to public Italian universities, which is particularly dangerous for scientific free research, and it will prevent young researchers from getting a position, either temporary or tenured, in Italy. The authors are protesting against this law to obtain its cancellation.References
- Bhattacharyya & Strohmayer (2007) Bhattacharyya, S. & Strohmayer, T. E. 2007, ApJ, 664, L103
- Cackett et al. (2009a) Cackett, E. M., Altamirano, D., Patruno, A., et al. 2009a, ApJ, 694, L21
- Cackett et al. (2008) Cackett, E. M., Miller, J. M., Bhattacharyya, S., et al. 2008, ApJ, 674, 415
- Cackett et al. (2009b) Cackett, E. M., Miller, J. M., Homan, J., et al. 2009b, ApJ, 690, 1847
- Casares et al. (1997) Casares, J., Charles, P., & Kuuklers, E. 1997, NASA STI/Recon Technical Report N, 98, 99651
- Christian & Swank (1997) Christian, D. J. & Swank, J. H. 1997, ApJS, 109, 177
- D’Aì et al. (2009) D’Aì, A., Iaria, R., Di Salvo, T., Matt, G., & Robba, N. R. 2009, ApJ, 693, L1
- den Herder et al. (2001) den Herder, J. W., Brinkman, A. C., Kahn, S. M., et al. 2001, A&A, 365, L7
- Di Salvo et al. (2009) Di Salvo, T., D’Ai’, A., Iaria, R., et al. 2009, ArXiv e-prints
- Di Salvo et al. (2005) Di Salvo, T., Iaria, R., Méndez, M., et al. 2005, ApJ, 623, L121
- Di Salvo et al. (2001) Di Salvo, T., Robba, N. R., Iaria, R., et al. 2001, ApJ, 554, 49
- Fomalont et al. (2001) Fomalont, E. B., Geldzahler, B. J., & Bradshaw, C. F. 2001, ApJ, 558, 283
- Hasinger & van der Klis (1989) Hasinger, G. & van der Klis, M. 1989, A&A, 225, 79
- Hasinger et al. (1990) Hasinger, G., van der Klis, M., Ebisawa, K., Dotani, T., & Mitsuda, K. 1990, A&A, 235, 131
- Iaria et al. (2004) Iaria, R., Di Salvo, T., Robba, N. R., et al. 2004, ApJ, 600, 358
- Iaria et al. (2007) Iaria, R., Lavagetto, G., D’Aí, A., di Salvo, T., & Robba, N. R. 2007, A&A, 463, 289
- Jansen et al. (2001) Jansen, F., Lumb, D., Altieri, B., et al. 2001, A&A, 365, L1
- Kuulkers & van der Klis (1998) Kuulkers, E. & van der Klis, M. 1998, A&A, 332, 845
- O’Neill et al. (2001) O’Neill, P. M., Kuulkers, E., Sood, R. K., & Dotani, T. 2001, A&A, 370, 479
- O’Neill et al. (2002) O’Neill, P. M., Kuulkers, E., Sood, R. K., & van der Klis, M. 2002, MNRAS, 336, 217
- Pandel et al. (2008) Pandel, D., Kaaret, P., & Corbel, S. 2008, ApJ, 688, 1288
- Papitto et al. (2009) Papitto, A., di Salvo, T., D’Aı, A., et al. 2009, A&A, 493, L39
- Shakura & Syunyaev (1973) Shakura, N. I. & Syunyaev, R. A. 1973, A&A, 24, 337
- Shimura & Takahara (1995) Shimura, T. & Takahara, F. 1995, ApJ, 445, 780
- Steeghs & Casares (2002) Steeghs, D. & Casares, J. 2002, ApJ, 568, 273
- Strüder et al. (2001) Strüder, L., Briel, U., Dennerl, K., et al. 2001, A&A, 365, L18
- Turner et al. (2001) Turner, M. J. L., Abbey, A., Arnaud, M., et al. 2001, A&A, 365, L27
- van der Klis (1995) van der Klis, M. 1995, in Lecture Notes in Physics, Berlin Springer Verlag, Vol. 454, IAU Colloq. 151: Flares and Flashes, ed. J. Greiner, H. W. Duerbeck, & R. E. Gershberg, 321–+
- Vrtilek et al. (1993) Vrtilek, S. D., Soker, N., & Raymond, J. C. 1993, ApJ, 404, 696
- Wachter & Margon (1996) Wachter, S. & Margon, B. 1996, AJ, 112, 2684
- White et al. (1988) White, N. E., Stella, L., & Parmar, A. N. 1988, ApJ, 324, 363
- Zhang et al. (1998) Zhang, W., Strohmayer, T. E., & Swank, J. H. 1998, ApJ, 500, L167+