Low-ionization pairs of knots in planetary nebulae: physical properties and excitation
Abstract
We obtained optical long-slit spectra of four planetary nebulae (PNe) with low-ionization pair of knots, namely He 1-1, IC 2149, KjPn 8 and NGC 7662.
These data allow us to derive the physical parameters and excitation of the pairs of knots, and those of higher ionization inner components of the nebulae, separately.
Our results are as follows. 1) The electron temperatures of the knots are within the range 9 500 to 14 500 K, similar to the temperatures of the higher ionization rims/shells. 2) Typical knots’ densities are 500 to 2 000 cm-3. 3) Empirical densities of the inner rims/shells are higher than those of the pairs of knots, by up to a factor of 10. Theoretical predictions, at variance with the empirical results, suggest that knots should be denser than the inner regions, by at least a factor of 10. 4) Empirical and theoretical density contrasts can be reconciled if we assume that at least 90% of the knots’ gas is neutral (likely composed of dust and molecules). 5) By using Raga et al. (2008) shock modeling and diagnostic diagrams appropriated for spatially resolved PNe, we suggest that high-velocity shocked knots traveling in the photoionized outer regions of PNe can explain the emission of the pairs of knots analysed in this paper.
keywords:
(ISM): Planetary nebulae: individual: He 1-1, IC 2149, KjPn 8, NGC 7662. Planetary nebulae: structure.1 Introduction
The small-scale low-ionization structures (LIS) of planetary nebulae were classified in terms of their morphology and kinematics by Gonçalves, Corradi & Mampaso (2001) as knots, jets and jetlike111These are features whose morphology resemble highly supersonic jets, but that share the expansion of the nebular components in which they are embedded. systems, either in pairs or isolated. From this, and subsequent works (e.g. Gonçalves 2004, and references therein) it has became apparent that: i) around 10% of the Galactic PNe are known to possess LIS; ii) they are indistinctly spread among all the PNe morphological classes; iii) 50% of these PNe have highly collimated, high-velocity jets, and/or high-velocity pairs of knots (FLIERs; fast, low-ionization emission regions, Balick et al. 1993); and iv) most of them are mainly photoionized.
However, a number of key questions remain open: are there significant density contrasts between LIS and the higher ionization main components (rims, attached shells and detached haloes) of the nebula? What are the typical electron densities of the different types of LIS?
We are involved in a long-term project for characterizing the small-scale LIS of PNe since they can tell us much about the formation and evolution of PNe. The main issues we can access by studying the LIS are:
-
1.
the collimation processes of LIS in regard to those processes responsible for the shape of the PN itself, or the mass-loss processes during the AGB and post-AGB phases;
-
2.
the effect of the ionization front on the fossil AGB features; and
-
3.
the role of disks and magnetic fields in shaping the highly collimated outflows (jets) in PNe.
Our motivation for the present analysis is to go a step further on the study of the different LIS analyzing their densities. LIS can move through their environments either with high or low velocity. In the first case (the so-called FLIERS), radial velocities of km s-1with respect to the PN main components are typically measured (Balick et al., 1993), whereas in the second instance (the SLOWERs, slow moving low-ionization emission regions; see Perinotto 2000) the knots do not show peculiar velocities and share the typical 30 km s-1 (for elliptical shells) to 100 km s-1 (for bipolar lobes) expansion velocities of their host PNe. A straightforward question arises from this: how is the density contrast between the LIS and rims, shells or haloes correlated with the different velocity regimes?
In this paper we analyse 4 PNe that contain pairs of knots, either of high- or low-velocities.
We present our spectroscopic data and treatment, in Section 2. The line fluxes obtained for as many as possible large- and small-scale components of the four PNe, and the derived physical properties for each of the components are shown in Sections 3 to 6. Finally, Section 7, is dedicated to the discussion of the results in terms of the match with the theoretical model predictions, and to our concluding remarks.
2 Observation and Data Treatment
| PN Name and P.A. | Obs. Date | Exposure (s) |
|---|---|---|
| 3 | ||
| He 1-1 - 315∘ | Aug 31 | 300, 2400 |
| IC 2149 - 70∘ | Sep 01 | 300, 900, 1800 |
| KjPn 8 - 98∘ | Aug 30 | 1200 |
| KjPn 8 - 120∘ | Aug 30 | 300, 1200 |
| NGC 7662 - 175∘ | Sep 05 | 60, 300 |
| NGC 7662 - 248∘ | Sep 04 | 30, 60, 300 |
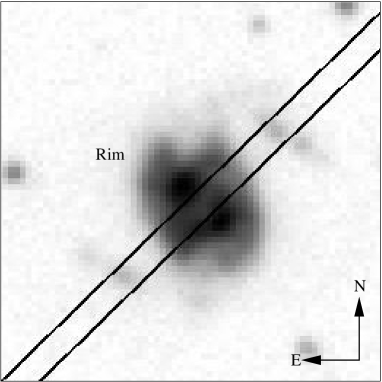
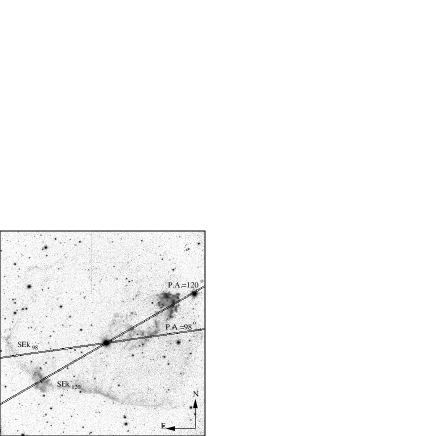
A 120 sec exposure H + [N ii] (6568/95Å) image of He 1-1 (Figure 1) was retrieved from the IPHAS database (INT/WFC Photometric H Survey of the Northern Galactic Plane: http://www.iphas.org). We also retrieved from the Hubble Space Telescope (HST) Archive two WFPC2 images of IC 2149: the V-band (filter 555W, 2 sec exp. time) and the [O iii] (F502N, 100 sec) images, obtained on 1995 (proposal 6119), see Figure 3. The [N ii] (F658N, 400 sec) image of NGC 7662 (Perinotto et al. 2004; Figure 5), was also retrieved from the HST archive, and was obtained on 1996. The image of KjPn 8 was obtained with the 2.5-m Nordic Optical Telescope (NOT) at the Observatorio del Roque de los Muchachos (European Northern Observatory, La Palma, Spain), with ALFOSC camera, in June 26, 2002. The image we show in Figure 4 is the result of one exposure of 1 800 s through the narrow-band filter [N ii]6584Å.
Spectra of the 4 PNe were obtained on August 31 and September 1, 4 and 5 of 2001, at the 2.5 m Isaac Newton Telescope (INT) at the Observatorio del Roque de los Muchachos using the Intermediate Dispersion Spectrograph (IDS). The 235 mm camera and the R300V grating were used, providing a spectral coverage from 3650 to 7000 Å with a spectral reciprocal dispersion of 3.3 Å pixel-1. The spatial scale of the instrument was 070 pixel-1, with the TEK5 CCD. Seeing varied from 09 and 11. The slit width and length were 15 and 4 ′, respectively. These data were taken with the slits positioned through the centre of the nebulae at the position angles (P.A.), and with exposure times given in Table 1. Each of the exposures was taken 3 times, as listed in the table. The longer exposures were used to measure the fluxes of most emission lines. However, for almost all the PNe, the [O iii] 4959,5007 Å, the [N ii] 6548,6583 Å doublet as well as the H and even the H lines were saturated at the brightest features in the longer exposures, thus, the shorter exposures where used in these cases. Differently of the way we took long-slit spectra of the other PNe, in the case of KjPn 8 the slit was centred on the position of the central star, and then it was shifted in order to cover each of the knots. Compared to the weather conditions during the observation of the other three PNe, that of the KjPn 8 was poor (clouds appeared during the integration).
During the night, bias frames, twilight and tungsten flat-field exposures, wavelength calibrations, and exposures of standard stars (BD +332642, Cyg OB2 No. 9, HD 19445, and BD +254655) were obtained. Spectra were reduced following the IRAF instructions for long-slit spectra, being bias-subtracted, flat-fielded, combined in order to improve the signal-to-noise ratio (S/N) and eliminate cosmic rays, wavelength-calibrated, and sky-subtracted. Finally, they were flux-calibrated using the above mentioned standard stars and the mean atmospheric extinction curve for La Palma.
3 He 1-1
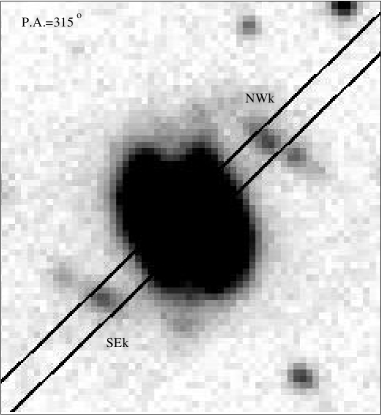
PN G055.3+02.7 (He 1-1) is a point-symmetric PN with a pair of low-ionization knots. See in Figure 1 the extensions of its bright Rim (or a combination of a rim and a shell), the large-scale component that dominates the emission of the nebula, and the SE and NW strings of knots, which correspond to the small-scale faint structures seen in the [N ii] NOT image.
In the uppermost part of Table 2 we list selected line fluxes of the Rim, the knots and the entire portion of the nebula covered by the slit. These include all the electron density and temperature diagnostic emission lines covered by the IDS spectra. Absolute H fluxes, FHβ, integrated along the slit for each nebular component are also given in Table 2. The Balmer lines ratios (H/H, H/H and H/H) were then used to derive the cHβ, the logarithmic ratio between observed and dereddened H fluxes. For the derivation of , we assumed = 104 K and the densities given by the [S ii] ratio of each region. Theoretical Balmer line ratios from Osterbrock & Ferland (2006) and the reddening law of Cardelli, Clayton & Mathis (1989) were used. The weighted average of , per PN component, is the one given in the table. is constant along the slit, and the =1.49 for the entire nebula is lower than the value previously published by Tylenda et al. (1992). The latter authors found a range of values for , which goes from 1.9 to 2.2. Note, however, that their values are based only on the H/H ratio. Fluxes were then dereddened using the derived . The dereddened fluxes, or intensities, are not shown in the table. Instead, figures in the table correspond to the observed fluxes.
| Line ID | Rim | Knots | NEB | |
|---|---|---|---|---|
| SEk | NWk | |||
| [Sii] 4072.0 | 6.232 | - | - | 6.464 |
| H 4101.8 | 15.57 | - | - | 15.97 |
| H 4340.5 | 29.69 | - | - | 29.13 |
| [Oiii] 4363.2 | 11.36 | 16.89 | 14.61 | 13.04 |
| H 4861.3 | 100.0 | 100.0 | 100.0 | 100.0 |
| [Oiii] 4958.9 | 543.4 | 587.7 | 601.7 | 566.8 |
| [Oiii] 5006.86 | 1715. | 1773. | 1808. | 1774. |
| [CLiii] 5517.7 | 3.321 | 22.56 | 15.57 | 4.152 |
| [CLiii] 5537.9 | 3.041 | 18.23 | 13.04 | 3.640 |
| [Nii] 5754.6 | 11.90 | 23.46 | 24.87 | 13.83 |
| [Nii] 6548.0 | 319.2 | 480.6 | 413.9 | 335.1 |
| H 6562.8 | 993.9 | 977.6 | 981.2 | 1021. |
| [Nii] 6583.4 | 1034. | 1436. | 1321. | 1075. |
| [Sii] 6716.5 | 129.3 | 114.4 | 124.4 | 132.3 |
| [Sii] 6730.8 | 169.6 | 114.7 | 139.2 | 172.1 |
| FHβ a | 21.62 | 0.4565 | 0.6247 | 22.37 |
| cHβ | 1.460.20 | 1.440.32 | 1.450.33 | 1.490.16 |
| Percentage errors in line fluxes | ||||
| (0.01–0.05)H | 35 | 52 | 60 | 31 |
| (0.05–0.15)H | 15 | 25 | 27 | 13 |
| (0.15–0.30)H | 11 | 20 | 20 | 11 |
| (0.30–2.0)H | 10 | 17 | 16.5 | 8.5 |
| (2.0–5.0)H | 9.5 | 15 | 16 | 6.5 |
| (5.0–10.0)H | 9 | 14.5 | 16 | 6.5 |
| 10H | 9 | 14.5 | 16 | 6.5 |
| Electron Densities (cm-3) and Temperatures (K) | ||||
| Ne[S ii] | 1600230 | 600140 | 900210 | 1550190 |
| Ne[Cl iii] | 1700830 | 800230 | 1000330 | 1350580 |
| Te[O iii] | 125002060 | 144003320 | 134504110 | 130501580 |
| Te[N ii] | 108001800 | 129002980 | 140003320 | 114001590 |
| Te[S ii] | 87501450 | - | - | 93001350 |
| a In units of 10-15erg cm-2 s-1 | ||||
The middle part of Table 2 shows the errors on the fluxes. They were calculated taking into account the statistical errors in the measurements, as well as systematic errors of the flux calibrations, background determination, and sky subtraction.
In the lowermost part of Table 2 electron densities and temperatures are presented. At least two different measures of Te and Ne are available for each PN component. They represent regions of low (Ne[S ii], Te[N ii] and Te[S ii]) and medium excitation (Ne[Cl iii] and Te[O iii]).
The density of the nebula can be compared with Samland et al. (1992). They find Ne[S ii]=1.19103 cm-3, in moderate agreement with ours. Figures for Te and Ne of the knots were previously published only in a proceeding contribution by Benítez et al. (2002): 11 300 K for the temperature of the NW knot, and densities of 300 cm-3 and 600 cm-3, for the SE and NW knots respectively. These values hardly agree with ours. Note that they did not derive, but assumed the 104 K of the SE knot.
Figure 2 (top left panel) and Table 2 shows that both density measurements in each region of the nebula are equal within the errors, whereas Ne of the Rim is higher than that of the SE and NW knots, by factors of 2.7 and 1.8, respectively. There is a good agreement between the two temperature diagnostics obtained for the three PN components.
Figure 2 shows that Te at the centre could be somewhat lower than at the knots, but the variation is within the errors.
Summarising, the pair of knots in He 1-1 are substantially less dense than the Rim, whereas no strong evidence exist for significant temperature variations from the Rim to the knots.

4 IC 2149
| Line ID | Core | Knots | NEB | |
|---|---|---|---|---|
| NEk | SWk | |||
| [Sii] 4072.0 | - | 5.743 | 5.625 | 3.011 |
| H 4101.8 | 15.75 | 26.99 | 36.27 | 24.14 |
| H 4340.5 | 40.46 | 43.41 | 61.99 | 46.12 |
| [Oiii] 4363.2 | 3.838 | 2.457 | 5.333 | 3.850 |
| H 4861.3 | 100.0 | 100.0 | 100.0 | 100.0 |
| [Oiii] 4958.9 | 180.1 | 124.5 | 140.7 | 150.9 |
| [Oiii] 5006.86 | 540.2 | 378.4 | 408.4 | 454.0 |
| [CLiii] 5517.7 | - | 0.367 | 0.545 | 0.386 |
| [CLiii] 5537.9 | - | 0.516 | 0.481 | 0.440 |
| [Nii] 5754.6 | 1.140 | 1.633 | 1.227 | 1.299 |
| [Nii] 6548.0 | 15.03 | 30.27 | 18.55 | 22.06 |
| H 6562.8 | 320.6 | 321.3 | 277.8 | 315.1 |
| [Nii] 6583.4 | 43.07 | 91.54 | 51.81 | 65.23 |
| [Sii] 6716.5 | 1.288 | 3.201 | 2.418 | 2.261 |
| [Sii] 6730.8 | 2.312 | 5.607 | 3.385 | 3.860 |
| FHβ a | 11.17 | 12.78 | 4.549 | 31.76 |
| cHβ | 0.07b | 0.140.015 | 0.00 | 0.120.008 |
| Percentage errors in line fluxes | ||||
| (0.01–0.05)H | 17 | 24 | 39 | 10 |
| (0.05–0.15)H | 10 | 17 | 24 | 5.5 |
| (0.15–0.30)H | 7 | 11 | 16 | 4.5 |
| (0.30–2.0)H | 6.5 | 8 | 10 | 4.5 |
| (2.0–5.0)H | 5.5 | 7 | 8.5 | 4.5 |
| (5.0–10.0)H | 4.5 | 6.5 | 7 | 4 |
| 10 H | 4.5 | 6 | 6.5 | 4 |
| Electron Densities (cm-3) and Temperatures (K) | ||||
| Ne[S ii] | 60501450 | 53501550 | 20501130 | 4650660 |
| Ne[Cl iii] | - | 76002750 | 1500870 | 4000680 |
| Te[O iii] | 103501760 | 101502560 | 127003150 | 110501170 |
| Te[N ii] | 123002150 | 104502600 | 123504850 | 110001170 |
| a In units of 10-14erg cm-2 s-1 | ||||
| b This cHβ values is the average between the knots’ values; see text. | ||||
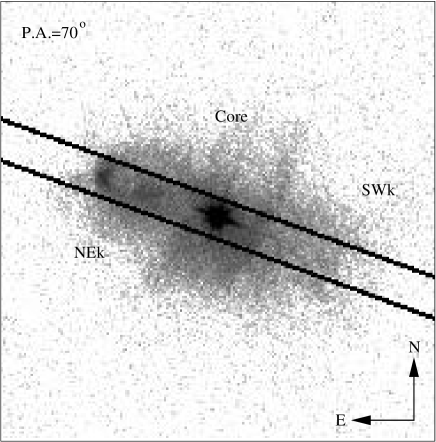
PN G166.1+10.4 has an apparent shape that does not easily compare with the classification bins (round, elliptical, bipolar or quadrupolar, irregular and point-symmetric) usually adopted for PNe. Kinematic modelling suggests that it is a bipolar PN (Vázquez et al. 2002; Feibelman et al. 1994; Zhang & Kwok 1998). As shown in Figure 3, IC 2149 is composed by a bright higher ionization emission zone, the Core, and by a pair of lower excitation knots, the North-Eastern one being much brighter than its counterpart to the South-West. In fact only the two former structures can be identified from Figure 3. Please refer to Fig.1 of Vázquez et al. (2002), in which not only a higher excitation image is show, but also the lower excitation [N ii] and [S ii] are presented. In their [N ii] image the SW LIS is also clearly seen.
Table 3 contains the spectroscopic results for IC 2149, obtained from the INT+IDS spectra at P.A.=70∘ (observed and absolute H fluxes, flux errors, , Ne and Te) for the Core and pair of LIS of the nebula.
The H/H ratio was used to obtain the of the NEk, SWk and NEB regions. Owing to the presence of Balmer line absorption in the central zones (Vázquez et al., 2002), the of the Core was adopted as the average from the knots’ values. The value measured for the nebula =0.12 is in agreement with other published values (Feibelman et al. 1994; Ciardullo et al. 1999), but it is much smaller than the value (0.41) obtained by Vázquez et al. (2002) for the Core and the knots.
The gas physical conditions we derived to this PN (Table 3 and left bottom panel of Fig. 2) compare relatively well with those derived by Vázquez et al. (2002) for the North-Eastern knot and for the NEB. The exception is the Ne[S ii], for which they obtained values of 10 000 and 9 600 cm-3 while we found 5 3501 550 and 4 650660 cm-3, for the NEk and NEB, respectively. We cannot understand the reason of this discrepancies, since they do not depend on the very different applied to correct the fluxes. On the other hand, the Te that would be affected by our different choices in terms of , are in reasonable agreement with theirs (see Vázquez et al. 2002 Table 1). If only NEB is concerned, our results also agree with the results obtained by Feibelman et al. (1994).
As [Cl III] 5517,5537Å were not detected, only Ne[S ii] could be derived for the Core. Figure 2 shows that the two density diagnostics for each of the knots are such that SWk (Ne[S ii]=2 0501 130) is significantly less dense than NEk, whose density is similar to that in the Core (Ne[S ii]=5 3501 550 and 6 0501 450, respectively).
In spite of an apparent increase of Te[O iii] and Te[N ii] from the North-Eastern to the South-Western side of the nebula, variations are within the errors.
5 KjPn 8
PN G112.5-00.1 (KjPn 8) is a huge PN (size 14 ′ 4 ′; López, Vázquez & Rodríguez 1995) with multiple polar ejections. A number of papers deal with the characteristics of this PN, including: i) narrow-band imaging of its many structures in the different scales, López et al. (1995); ii) proper motions of its latest bipolar ejections, Meaburn (1997); iii) kinematics of the large bipolar lobes and of the pair of knots, López et al. (1997); and iv) temperature, density and chemical abundances of the inner nebula, Vázquez, Kingsburgh & López (1998). At much smaller scales, a ring that seems to collimate the many structures (with its CO and H2 counterpart) has been detected giving support to the idea that KjPn 8 had two PNe-like events in its history (López et al. (2000)). However, Ne and Te of its two pairs of low-ionization knots were not properly measured so far, due to their extreme faintness.
In our spectra only one of the knots of each pair could be measured with a good S/N. At variance with the other PNe in our sample, no analysis of the internal or entire nebula will be given, because of the huge extension of the PN. Our results for the two SE knots of KjPn 8 are given in Table 4.
| Line ID | South Eastern Knots | |
|---|---|---|
| SEk120 | SEk98 | |
| [Sii] 4072.0 | 10.78 | 8.869 |
| H 4101.8 | 23.35 | 20.69 |
| H 4340.5 | 41.41 | 42.54 |
| [Oiii] 4363.2 | 1.149 | 2.466 |
| H 4861.3 | 100.0 | 100.0 |
| [Oiii] 4958.9 | 100.5 | 101.8 |
| [Oiii] 5006.86 | 307.9 | 307.4 |
| [CLiii] 5517.7 | - | 3.000 |
| [CLiii] 5537.9 | - | 2.280 |
| [Nii] 5754.6 | 9.351 | 12.95 |
| [Nii] 6548.0 | 392.8 | 398.0 |
| H 6562.8 | 438.8 | 453.3 |
| [Nii] 6583.4 | 1191. | 1207. |
| [Sii] 6716.5 | 99.79 | 98.28 |
| [Sii] 6730.8 | 100.4 | 98.19 |
| FHβ a | 2.468 | 1.221 |
| cHβ | 0.480.07 | 0.520.10 |
| Percentage errors in line fluxes | ||
| (0.01–0.05)H | 30.5 | 42.5 |
| (0.05–0.15)H | 22.5. | 34.5 |
| (0.15–0.30)H | 15.5 | 27.5 |
| (0.30–2.0)H | 10.5 | 16 |
| (2.0–5.0)H | 8.5 | 10 |
| (5.0–10.0)H | 6.5 | 8.5 |
| 10H | 5 | 8.0 |
| Electron Densities (cm-3) and Temperatures (K) | ||
| Ne[S ii] | 60090 | 600140 |
| Ne[Cl iii] | - | 450270 |
| Te[O iii] | 91002960 | 115504950 |
| Te[N ii] | 85001950 | 95503340 |
| Te[S ii] | 91501250 | 84003010 |
| a In units of 10-14erg cm-2 s-1 | ||
When comparing our values with those in the literature, particular care should be taken because they usually refer to different nebular regions, and reddening may vary along this large nebula. Vázquez et al. (1998) measured very different values for the three knots which they labelled A1, A3 and B1: 1.49, 0.96 and 0.56, respectively. Our for SEk120 (their A1) is therefore 3 times smaller than theirs, whereas for SEk98 (their knot B1) both determinations agree very well, =0.56 and 0.52, respectively. The reason for the discrepant in SEk120 is not clear at present. As for the density, they reported Ne[S ii]=100 cm-3 for both SEk98 and SEk120, while we derived substantially larger values Ne[S ii]=600140 ([Cl iii]= 450270) and 60090 for SEk98 and SEk120, respectively. The electron temperature in the knots is measured in this paper for the first time.
Summarising, the densities and temperatures of the two knots are the same within the errors.
6 NGC 7662
This bright nebula (PN G106.5-17.6) consist of a central cavity surrounded by three concentric shells, the inner Rim, the outer shell (Guerrero, Jaxon & Chu, 2004), and a halo (Corradi et al., 2004). In addition, on smaller scales it has a number of LIS. Most of them appear, in projection, distributed at the outer edge of the outer shell. All these structures are easily identified in Figure 5, and are named as in Balick et al. (1998) and Perinotto et al. (2004). This figure also identify the structures that we analyze in this paper. Balick, Preston & Icke (1987) studied the kinematics of the different nebular components, from which the acronyms FLIERs and SLOWERs were later introduced.
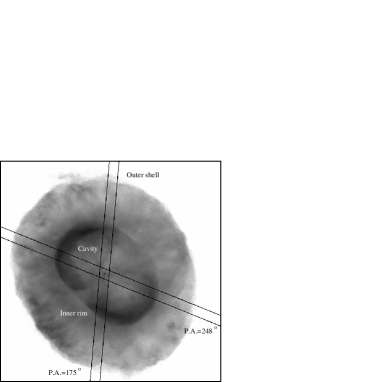
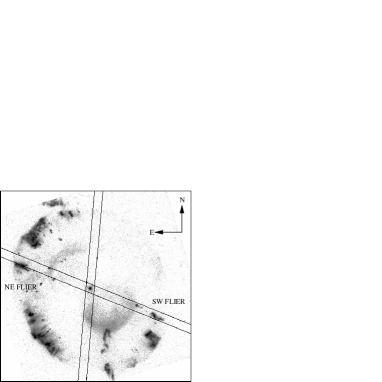
Perinotto et al. (2004) studied this PN with unprecedented spatial resolution using the STIS spectrograph on the HST. However, their spectra were taken through two slits (called POS1 and POS2, see their Figure 1), that in terms of LIS, are restricted to only one side of the nebula. We have used much longer slits that cover all the structures along both sides of the nebula, in each direction at P.A. 175∘ and 248∘. This allows us to compare the densities and temperatures of any given symmetrical pair of LIS. The slit at P.A. 248∘ contains a pair of low-ionization filaments (the serpentine-like filaments described in Balick et al. 1998). The slit at P.A. 175∘ does not contain any LIS, and is used to compare the physical parameters along the line joining the FLIERs with those in a direction free of micro structures. In this way, the present work can be seen as complementary to the analysis of Perinotto et al. (2004).
In Table 5 we report the derived values of that are based on the average weighted given by the H, H, and H to H ratios. These values are all between 0.13 and 0.21 for the 5 regions under analysis in each position angle. These agree very well with those previously published: 0.18 - 0.22 (Tylenda et al., 1992); 0.1 (Hyung & Aller, 1997); 0.2 (Perinotto et al., 2004); and 0.18 Zhang et al. (2004).
This table gives the observed line fluxes, densities and temperatures of the 10 structures we measured along P.A. 175∘ and 248∘. These parameters are also presented in Figure 2. The average Te[O iii] derived from the emission integrated along both P.A. are the same within errors (Te[O iii]=14 300700 K and 13 400680 K, respectively). In fact these values also agree with the Te[N ii]=12 7501 530 K derived along the P.A.=248∘. The Te[O iii] we obtained here are more in agreement with the results by Barker (1986) – whose [O iii] temperatures in different regions of the nebula (see his Table 3) varies from 11 200 K to 13 800 K – and Zhang et al. (2004) (13 300 K), than with the somewhat lower values of Perinotto et al. (2004).
As for the [S ii] and [Cl iii] densities of the integrated emission we found 2 300440 cm-3 and 2 550490 cm-3 for P.A.=175∘ and 2 850450 cm-3 and 2 850460 cm-3 for P.A.=248∘. Ne[S ii] results very closely reproduce those found by a Wang et al. (2004, Ne[S ii]=2 884 cm-3). The same authors give a value of 1 862 cm-3 for the [Cl iii] density, but errors are not reported in their work.
Focusing on the densities and temperatures of the inner Rim and outer shell with respect to those of the FLIERs (pair of filaments at P.A.=248∘), it is clear from Figure 2, that: i) temperatures Te[O iii](where errors are smaller) are slightly higher at the inner Rim than in the outer knots (P.A.=175∘), but this is just at the 2- level of the adopted errors; ii) densities of the Rim agree very well one to another in both position angles; iii) the Rim is roughly a factor of 2.8 denser than the outer shell (P.A.=175∘); iv) the Rim (inner shell) along P.A.=248∘, is a factor of 1.7 denser than its outer region and the pair of FLIERs.
Summarising, Perinotto et al. (2004) previously observed the LIS (FLIERs and SLOWERS) of this PN at different directions than in the present work. Densities for the FLIERs in both works are in good agreement: Ne=2 200 cm-3 for the two FLIERs studied by Perinotto et al. (2004), and 2 100 cm-3 in our work. Perinotto et al. (2004) did find significantly different densities for FLIERs and SLOWERs, being the latter approximately 1.3 times denser than the former.
Our analysis shows that FLIERS of NGC 7662 are less dense than the inner regions of the nebula, but they are at the same time much denser than the PN outer shell in which they are located.
| P.A.=175∘ | Line ID | SE outer Shell | SE inner Rim | Cavity + Star | NW inner Rim | NW outer Shell | NEB |
|---|---|---|---|---|---|---|---|
| H 4101.8 | 30.81 | 27.31 | 28.38 | 29.48 | 24.25 | 28.99 | |
| H 4340.5 | 23.79 | 23.99 | 22.00 | 23.99 | 24.60 | 23.99 | |
| [Oiii] 4363.2 | 17.17 | 15.66 | 19.78 | 18.46 | 19.12 | 17.82 | |
| H 4861.3 | 100.0 | 100.0 | 100.0 | 100.0 | 100.0 | 100.0 | |
| [Oiii] 4958.9 | 504.4 | 368.0 | 343.2 | 338.7 | 481.7 | 372.1 | |
| [Oiii] 5006.86 | 1533. | 1105. | 1018. | 1018. | 1434. | 1114. | |
| [CLiii] 5517.7 | 0.761 | 0.317 | 1.756 | 0.345 | 0.398 | 0.424 | |
| [CLiii] 5537.9 | 0.652 | 0.344 | 1.669 | 0.378 | 0.475 | 0.423 | |
| [Nii] 5754.6 | 0.169 | 0.087 | 0.469 | 0.099 | 0.152 | - | |
| H 6562.8 | 331.5 | 324.9 | 334.9 | 326.7 | 334.9 | 339.9 | |
| [Nii] 6583.4 | 7.496 | 2.981 | 2.502 | 2.540 | 5.191 | 3.115 | |
| [Sii] 6716.5 | 1.164 | 0.366 | 0.242 | 0.249 | 0.916 | 0.371 | |
| [Sii] 6730.8 | 1.428 | 0.593 | 0.373 | 0.396 | 1.107 | 0.536 | |
| FHβa | 3.164 | 36.90 | 14.15 | 30.94 | 2.138 | 104.4 | |
| cHβ | 0.180.017 | 0.160.012 | 0.200.016 | 0.170.015 | 0.180.017 | 0.210.02 | |
| Percentage errors in line fluxes | |||||||
| (0.01–0.05)H | 35 | 15.5 | 12.5 | 16.5 | 30 | 8.5 | |
| (0.05–0.15)H | 16 | 10.5 | 10 | 9.5 | 11 | 4.5 | |
| (0.15–0.30)H | 10 | 8.5 | 9 | 8.5 | 9 | 4 | |
| (0.30–2.0)H | 7 | 5.5 | 7.5 | 6 | 7 | 3.5 | |
| (2.0–5.0)H | 5.5 | 4.5 | 5 | 5.5 | 5.5 | 3.5 | |
| (5.0–10.0)H | 5 | 4 | 4.5 | 5 | 5 | 3.5 | |
| 10H | 4.5 | 4 | 4 | 4.5 | 5 | 3.5 | |
| Electronic Densities (cm-3) and Temperatures (K) | |||||||
| Ne[S ii] | 1300735 | 36501060 | 2950730 | 34001050 | 1200560 | 2300440 | |
| Ne[Cl iii] | 1250700 | 34501000 | 2100370 | 35501100 | 1100550 | 2550490 | |
| Te[O iii] | 124001350 | 134501220 | 156001500 | 150001390 | 132001300 | 14300700 | |
| Te[N ii] | 126504830 | 139003350 | - | 168504250 | 144505300 | - | |
| P.A.=248∘ | Line ID | SW outer | SW inner | Cavity + Star | NE inner | NE outer | NEB |
| FLIER | Rim | Rim | FLIER | ||||
| [Sii] 4068.6 | 1.420 | 0.885 | 0.814 | 0.920 | 1.263 | 1.232 | |
| [Sii] 4076.4 | 0.530 | 0.469 | 0.966 | 0.430 | 0.317 | 0.259 | |
| [Sii] 4072.0 | 1.923 | 0.954 | 2.127 | 1.131 | 1.381 | 1.804 | |
| H 4101.8 | 24.39 | 24.98 | 25.08 | 23.69 | 23.93 | 23.99 | |
| H 4340.5 | 43.96 | 45.22 | 45.07 | 44.17 | 43.99 | 45.29 | |
| [Oiii] 4363.2 | 21.83 | 17.27 | 16.43 | 16.53 | 18.89 | 16.98 | |
| H 4861.3 | 100.0 | 100.0 | 100.0 | 100.0 | 100.0 | 100.0 | |
| [Oiii] 4958.9 | 552.7 | 387.6 | 339.8 | 398.1 | 517.8 | 397.1 | |
| [Oiii] 5006.86 | 1706. | 1184. | 1040. | 1214. | 1570. | 1213. | |
| [CLiii] 5517.7 | 0.637 | 0.395 | 0.408 | 0.389 | 0.606 | 0.410 | |
| [CLiii] 5537.9 | 0.585 | 0.431 | 0.390 | 0.437 | 0.570 | 0.422 | |
| [Nii] 5754.6 | 0.585 | 0.088 | - | 0.089 | 0.552 | 0.155 | |
| H 6562.8 | 343.8 | 331.9 | 321.6 | 331.3 | 333.8 | 321.1 | |
| [Nii] 6583.4 | 31.14 | 3.551 | 2.734 | 4.289 | 22.88 | 6.321 | |
| [Sii] 6716.5 | 2.630 | 0.454 | 0.311 | 0.431 | 2.141 | 0.611 | |
| [Sii] 6730.8 | 3.843 | 0.751 | 0.423 | 0.679 | 3.064 | 0.932 | |
| FHβa | 3.580 | 33.59 | 22.23 | 41.22 | 8.732 | 117.9 | |
| cHβ | 0.210.025 | 0.170.011 | 0.140.011 | 0.170.011 | 0.190.015 | 0.140.008 | |
| Percentage errors in line fluxes | |||||||
| (0.01–0.05)H | 38.5 | 10.5 | 18 | 9.5 | 25.5 | 8.5 | |
| (0.05–0.15)H | 19.5 | 8.5 | 9.5 | 7 | 14 | 5.5 | |
| (0.15–0.30)H | 13 | 6.5 | 7.0 | 5.5 | 8 | 4.5 | |
| (0.30–2.0)H | 8.5 | 4.5 | 5.0 | 4.5 | 6 | 3.5 | |
| (2.0–5.0)H | 6.5 | 4.0 | 4.5 | 4.0 | 4.5 | 3.0 | |
| (5.0–10.0)H | 5.0 | 3.5 | 4.0 | 3.5 | 4 | 3.0 | |
| 10H | 4.5 | 3.5 | 3.5 | 3.5 | 4 | 3.0 | |
| Electronic Densities (cm-3) and Temperatures (K) | |||||||
| Ne[S ii] | 24001300 | 3950650 | 1850550 | 3250550 | 2250800 | 2850450 | |
| Ne[Cl iii] | 18001040 | 3500580 | 2150630 | 38001370 | 2000790 | 2850460 | |
| Te[O iii] | 147501980 | 13650970 | 141001070 | 13300820 | 127001100 | 13400680 | |
| Te[N ii] | 113504540 | 126001920 | - | 117003920 | 129003720 | 127501530 | |
| a In units of 10-13erg cm-2 s-1. Note that [Nii] 6548Å was not measured for any of the structures. Thus, Te[N ii] | |||||||
| were calculated assuming the theoretical relation between [Nii] 6583Å and [Nii] 6548Å. | |||||||
7 Discussion
7.1 Temperature of the knots
We have estimated individual temperatures Te[O iii] and Te[N ii] for the different regions of the four nebulae studied in this paper. As it is well known, temperature errors are always important and they range in our case typically from around 1000 K for Te[O iii] in the brighter zones to more than 4000 K for Te[N ii] in the fainter regions. Therefore, a sensible comparison of temperatures for the different components of each PN is precluded, and only rather general conclusions can be extracted: 1) temperatures are those of normal photoionized PNe, varying from 9 500 to 14 500 K typically; 2) Te[O iii] agrees within the errors with Te[N ii] for every PN component measured. 3) No relevant differences between Te[O iii] at the LIS and at the higher excitation PN structures are found.
7.2 Knots density contrasts
The empirical density contrasts between the knots and the inner nebular regions, as described in this paper, are such that knots are typically 1 to 3 times less dense than the rims or cores of these PNe (He 1-1, IC 2149 and NGC 7662): in no one of the LIS measured here the electronic density is definitely larger than at the main PN structures. This unexpected result is nevertheless also found in the full sample of PN with LIS. Table 4 of Gonçalves et al. (2001) lists 26 PNe with pairs of knots similar to those in the present work. We have searched in the literature for density measures both at the inner rims (or shells) of each PNe and at their pairs of knots, finding eight222NGC 4634 (Guerrero, Jaxon & Chu, 2004); Hb 4 (Hajian et al., 1997); IC 4593 (Corradi et al., 1997); NGC 7009 (Gonçalves et al., 2003); K 3-35 (Miranda et al., 2000); NGC 6826 (Balick et al., 1994); NGC 2440 (Cuesta & Phillips, 2000); K 1-2 (Exter, Pollacco & Bell, 2003). PNe (in addition to the four nebulae here studied) with adequate data. In all but one PN (NGC 6826) the densities of the knots are equal or lower than those of the inner rims or shells, by factors between 1 and 10.
This result is not consistent with the theoretical expectations. The formation of PN major structures and pairs of jets/knots has been modeled in the past using a broad variety of processes and scenarios (see, for instance, Gonçalves et al. (2001) and Balick & Frank (2002)). Recent models can be grouped into three main families. i) Magnetohydrodynamic disk wind models, based on the scenario of accretion disks formed by binary interactions (Frank & Blackman 2004, Blackman, Frank & Welch 2001). ii) Interacting AGB and post-AGB wind models, in which the post-AGB wind is driven exclusively by the magnetic pressure of a single star (García-Segura, López & Franco 2005, García-Díaz et al. 2008). iii) Models that explore the effect of axisymmetrical light (low density) jets that, for a short period of time, expand into a spherical AGB wind (Akashi & Soker, 2008). Some of the above models are particularly tailored to reproduce the main morphological and kinematic properties of a few well observed PNe: He 3-401, M2-9 and He 2-90 (García-Segura et al., 2005); Mz 3 and the pre-PN M1-92 (Akashi & Soker, 2008). Nevertheless, and despite the different assumptions of the different models, all of them are able to account for the formation of PNe with jets.
Model predictions state that, after the eventual shut off of the jets, dense knots would form embedded in the outer nebular components. Moreover, both the knots present at the tips of the existing jets and those left over when jets disappear are predicted to be denser than the inner PN components by large factors ranging from 10 up to 1000 (typically 10) depending on the model assumptions.
Therefore, there is a clear disagreement between observed and modeled pairs of knots: the former are found to be typically 10 times less dense, while the latter are expected to be typically 10 times denser, than the inner rims and shells of their parent PN.
A straightforward possibility to reconcile the empirical and theoretical density contrasts is keeping in mind that empirical densities, as those measured here, correspond to only the ionized fraction of the PN gas. Models, on the other hand, usually predict the formation of knots accounting for its morphology, kinematics and total gas content, but do not detail the ionization status of each component nor their evolution with time. The strong discrepancy between models and observations found here (a typical factor of 100) can therefore be explained if 90% or more of the low-ionization knots’ material is neutral. It is worth mentioning here the case of one prominent cometary globule of the Helix nebula –which contains the best known low-ionization knots of PNe. The molecular matter (H2 + CO; Huggins et al. 2002) and the dust content (Meaburn et al., 1992) of this knot amount to 210-5M⊙, whereas O’Dell & Handron (1996) estimated that the typical mass of the photoionized gas of a globule in Helix is 10-9M⊙.
In another well-studied system of knots, NGC 7009, previous modeling by Gonçalves et al. (2006) succeeded in reproducing the observed ionization structure and chemical abundances under the assumption that the total gas density of the knots is equal to the one empirically derived from the [S ii] lines (Gonçalves et al., 2003), therefore, not accounting for any neutral matter. This apparently contradicts the present results suggesting that the knots might be mostly neutral. However, the effect of the density assumed for the knots in the modeling by Gonçalves et al. (2006) is partly balanced by its geometry, i.e., by its shape and size. As the shape was fixed based on the knots’ appearance in the HST images, the size was allowed to vary until it fits the observations (i.e. the optical line ratios and electron density). For that reason Gonçalves et al. (2006) were able to reproduce the observations of NGC 7009 without invoking need for neutral matter. It would be very interesting to attempt 3D photoionization modeling as in Gonçalves et al. (2006) exploring high density regimes for the knots as suggested in this paper.
7.3 Main excitation of the pairs of knots
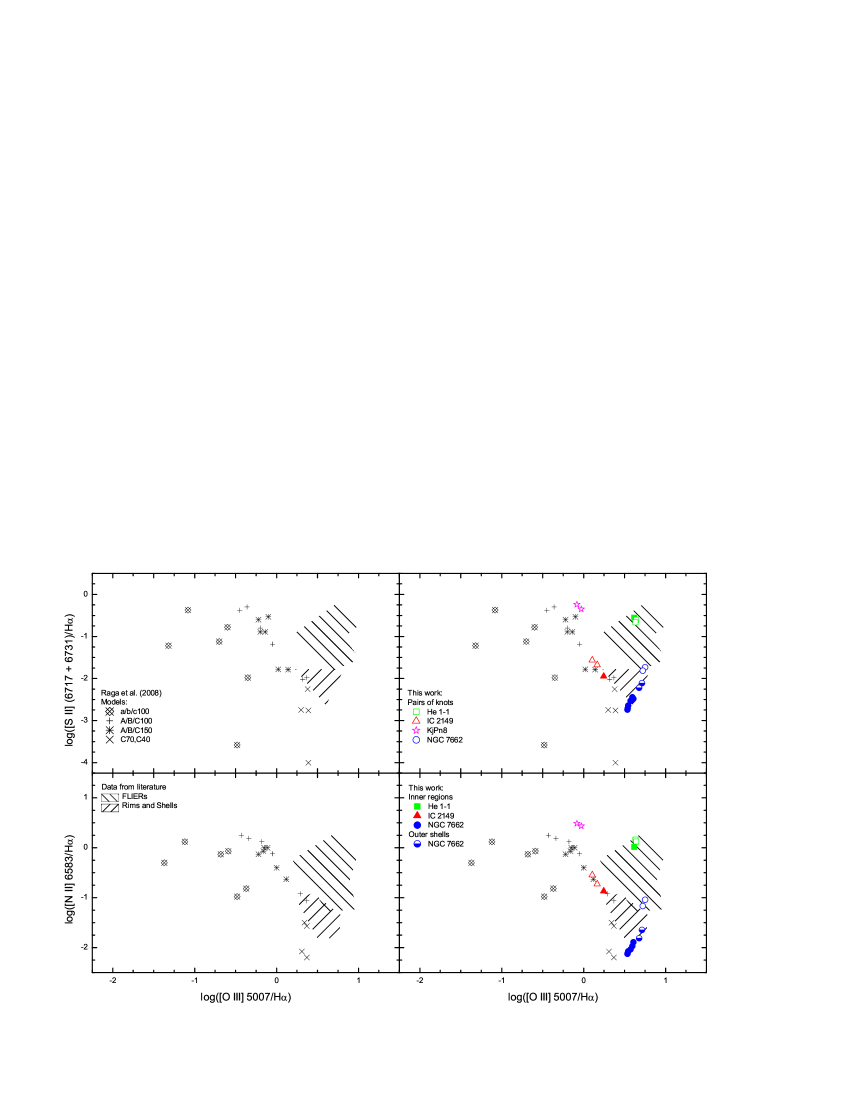
Raga et al. (2008) have recently simulated the evolution of high-density (103 cm-3), high-velocity (100 to 150 km s-1) knots that travel away from a photoionizing source crossing a uniform lower density (102 cm-3) environment. They explored a range of initial conditions for the shocked knots (in terms of photoinization rate), and qualitatively reproduced the emission-line ratios of several FLIERs, rims and shells observed in pre-PNe and PNe. At the end of the model evolution, 400 yr, the number densities for the knots are 103 to 104 cm-3, broadly in agreement with measured Ne of knots in NGC 7009 and IC 4634. These simulations were indeed intended to reproduce the line ratios of the FLIERs of these two PNe. No predictions are given for the properties of the other PN components (rims, shells and haloes). In Figure 6 we show two of the diagnostic diagrams from Raga et al. (2008) comparing empirical and theoretical line ratios for FLIERs, as well as showing a compilation of empirical data for rims and shells of some PNe.
Fig. 6 shows, first, that most of the inner regions (rims and shells) of the PNe in our sample occupy the same zone as the rims and shells of other PNe in the literature. Second, the same is true for the zone occupied by the pairs of knots in He 1-1 and NGC 7662 (open boxes and circles) with respect to the zones of the FLIERs sample in Raga et al. (2008). Third, knots in the other two nebulae, IC 2149 and KjPn 8 (open triangles and stars), are displaced from the empirical zone of FLIERs in Raga et al. (2008). Their locations are consistent with the results of simulations with the highest initial velocity of the knots (150 km s-1, model A/B/C/150), and indicate that a mixing of shock and photo ionization is playing a role in the measured emission-line ratios. In fact, the highly supersonic velocity (radial velocity of 226 km s-1; López et al. 1997) measured in KjPn 8 for the SE knot at P.A.=98∘ could explain this agreement. Expansion velocities of IC 2149’s knots are more moderate ( 47 km s-1; Vázquez et al. 2002).
Raga et al. (2008) show that models with low photoionization rates yield line ratios typical of shock-excited knots, whereas in models with higher photoionization rate, photoionized emission dominates the spectrum of the high-velocity, high-density knots. This strengthen the idea that it is evolution (PN age; see Gonçalves 2004, Raga et al. 2008; Viironen et al. 2009) and photoionization rate (Dopita 1997; Raga et al. 2008), rather than the highly supersonic velocities of the knots, the key parameters to separate the shock-excited from the photoionized structures in planetary nebulae.
8 Conclusions
We have derived the physical parameters of low-ionization pairs of knots, and of higher ionization PN main components for a small sample of nebulae (He 1-1, IC 2149, KjPn 8 and NGC 7662). We have shown that electron temperatures at the knots are comparable to the temperatures of the main nebular components, rims and shells, whereas densities in the latter structures are significantly higher than in the pairs of knots, by up to a factor of 2. Typical knots’ densities in the studied PNe are 500 to 2 000 cm-3.
We have argued that optical line ratios are not appropriate to constrain the total gas density, as they only account for the ionized matter of the knots, whereas none of the available models properly explore the knots ionization fraction, but the total (neutral plus ionized) density structure. A direct comparison of our results, plus compiled literature data, with the theoretical density contrasts expected from model predictions, yields a clear discrepancy that amount, typically, up to a factor of 100. To reconcile models and observations we suggest that an important fraction of the gas at the knots –90%– should be neutral. The results presented here can help in constraining more realistic models for jets and knots in PNe, by providing empirical physical parameters of the ionized gas.
We have analyzed the location of the knots of our four PNe in diagnostic diagrams studied by Raga et al. (2008) concluding that the observed line emission ratios are compatible with shocked knots traveling in the photoionized outer regions of their host PNe.
Acknowledgments
We would like to thank the anonymous referee of this manuscript, for his suggestions. D.R.G. thanks the Brazilian agency FAPERJ (E-26/110.107/2008) for its partial support. A.M., and R.L.M.C. acknowledge funding from the Spanish Ministry of Science AYA2007-66804 grant. This paper makes use of data obtained at the 2.5 m Isaac Newton Telescope (INT: IDS and IPHAS), operated by the Isaac Newton Group; and at the 2.5 m Nordic Optical Telescope (NOT: ALFOSC), operated by NOTSA. Both are telescopes of the European Northern Observatory on the island of La Palma in the Spanish Observatorio del Roque de los Muchachos of the Instituto de Astrofísica de Canarias. We also use NASA/ESA Hubble Space Telescope data, obtained at the Space Telescope Science Institute, which is operated by AURA for NASA under contract NAS5-26555.
References
- Akashi & Soker (2008) Akashi M., & Soker, N. 2008, MNRAS in press
- Balick & Frank (2002) Balick B., & Frank A., 2002, ARA&A, 40, 439
- Balick, Preston & Icke (1987) Balick, B., Preston, H. L., Icke, V., 1987, AJ, 94, 1641
- Balick et al. (1993) Balick, B., Rugers, M., Terzian, Y., Chengalur, J. N., 1993, ApJ, 411, 778
- Balick et al. (1994) Balick B., Perinotto M., Maccioni A., Alexander J., Terzian Y., Hajian A. R., 1994, ApJ, 424, 800
- Balick et al. (1998) Balick, B., Alexander, J., Hajian, A. R., Terzian, Y., Perinotto, M., & Patriarchi, P., 1998, AJ, 116, 360
- Barker (1986) Barker, T., 1986, ApJ, 308, 314
- Benítez et al. (2002) Benítez G., Vázquez R., Cook R., & Olguín L., 2002, RMxAC 12, 159
- Blackman, Frank & Welch (2001) Blackman E. G., Frank A., & Welch C., 2001, ApJ 546, 288 1998, A&A 331, 361
- Cardelli, Clayton & Mathis (1989) Cardelli, J. A., Clayton, G. C., & Mathis, J. S. 1989, ApJ, 345, 245
- Ciardullo et al. (1999) Ciardullo, R., Bond, H. E., Sipior, M. S., Fullton, L. K., Zhang, C.-Y., Schaefer, K. G., 1999, AJ, 118, 488
- Corradi et al. (1997) Corradi R. L. M., Guerrero M., Manchado A., & Mampaso A., 1997, NewA 2, 461
- Corradi et al. (2004) Corradi R. L. M., Schönberner D., Steffen M., & Perinotto M., 2003, MNRAS 340, 417
- Cuesta & Phillips (2000) Cuesta L. & Phillips J. P., 2000, ApJ 543, 754
- Dopita (1997) Dopita, M. A., 1997, ApJ, 485, L41
- Exter, Pollacco & Bell (2003) Exter K. M., Pollacco D. L., & Bell S. A., 2003, MNRAS 341, 1349
- Frank & Blackman (2004) Frank A., & Blackman E. G., 2004, ApJ 614, 737
- Feibelman et al. (1994) Feibelman, W. A., Hyung, S., Aller, L. H., 1994, ApJ, 426, 653
- García-Díaz et al. (2008) García-Díaz M. T., López J. A., García-Segura G., Richer M. G., Steffen W., 2008, ApJ 676, 402
- García-Segura et al. (2005) García-Segura G., López J. A., & Franco, J., 2005, ApJ 618, 919
- Gonçalves et al. (2001) Gonçalves D. R., Corradi R. L. M., & Mampaso A., 2001, ApJ, 547, 302
- Gonçalves et al. (2003) Gonçalves D. R., Corradi R. L. M., Mampaso A., Perinotto M., 2003, ApJ, 597, 975
- Gonçalves (2004) Gonçalves D. R., 2004, ASPC, 313, 216
- Gonçalves et al. (2006) Gonc calves D. R., Ercolano B., Carnero A., Mampaso A., & Corradi R. L. M., 2006, MNRAS 365, 1039
- Guerrero, Jaxon & Chu (2004) Guerrero M. A., Jaxon E. G. & Chu Y.-H., 2004, AJ, 128, 1705
- Guerrero, Jaxon & Chu (2004) Guerrero M. A., Miranda L. F., Riera A., Velázquez P. F., & Olguín L., 2008, ApJ 683, 272
- Hajian et al. (1997) Hajian A. R., Balick B., Terzian Y., & Perinotto M., 1997, ApJ 487, 313
- Huggins et al. (2002) Huggins P. J., Forveille T., Bachiller R., Cox P., Ageorges N., & Walsh J. R., 2002, ApJ, 573, L55
- Hyung & Aller (1997) Hyung, S.,& Aller, L. H., 1997, ApJ, 491, 242
- López et al. (1995) López, J. A., Vazquéz, R., & Rodríguez, L. F., 1995, ApJ, 445, L63
- López et al. (1997) López, J. A., Meaburn, J., Bryce, M., & Rodríguez, L. F., 1997, ApJ, 475, 705
- López et al. (2000) López, J. A., Meaburn, J., Rodríguez, L. F., Vazquéz, R., Steffen. W., & Bryce, M., 2000, ApJ, 538, 233
- Meaburn et al. (1992) Meaburn J., Walsh J. R., Clegg R. E. S., Walton N. A., Taylor D., & Berry D. S., 1992, MNRAS 255, 177
- Meaburn (1997) Meaburn, J., 1997, MNRAS, 292, L11
- Miranda et al. (2000) Miranda L. F., Fernández M., Alcalá J. M., Guerrero M. A., Anglada G, et al., 2000, MNRAS 311, 748
- O’Dell & Handron (1996) O’Dell C. R., & Handron K. D., 1996, AJ, 111, 1630
- Osterbrock & Ferland (2006) Osterbrock, D. E., & Ferland, G. J., in ”Astrophysics of Gaseous Nebulae and Active Galactic Nuclei” (2nd Edition) / University Science Books, 2006
- Perinotto (2000) Perinotto, M., 2000, Ap&SS, 274, 205
- Perinotto et al. (2004) Perinotto, M., Patriarchi, P., Balick, B., Corradi, R. L. M., 2004, A&A, 422, 963
- Raga et al. (2008) Raga A. C., Riera A., Mellema G., Esquivel A., & Velázquez P. F., 2008, A&A, 489, 1141
- Samland et al. (1992) Samland, M., Koeppen, J., Acker, A., & Stenholm, B., 1992, A&A, 264, 184
- Tylenda et al. (1992) Tylenda, R., Acker, A., Stenholm, B., & Koeppen, J., 1992, A&AS, 95, 337
- Vázquez et al. (1998) Vásquez, R., Kingsburgh R.L., & López, J. A., 1998, MNRAS, 296, 564
- Vázquez et al. (2002) Vásquez, R., Miranda, L. F., Torrelles, J. M., Olguín, L., Benítez, G., Rodríguez, L. F., López, J. A., 2002, ApJ, 576, 860
- Viironen et al. (2009) Viironen K., Mampaso A., Corradi R. M. L., Rodríguez M., Greimel R., et al., 2009, A&A accepted, 2009arXiv0904.1937V
- Wang et al. (2004) Wang, W., Liu, X.-W., Zhang, Y., & Barlow, M. J., 2004, A&A, 427, 873
- Zhang & Kwok (1998) Zhang, C. Y., & Kwok, S., 1998, ApJS, 117, 341
- Zhang et al. (2004) Zhang, Y., Liu, X.-W., Wesson, R., Storey, P. J., Liu, Y., & Danziger, I. J., 2004, MNRAS, 351, 935