Analysis of the Prompt Optical Emission of the Naked-Eye GRB 080319B
Abstract
We present the observedintrinsic optical parameters and the variability analysis of the Naked-Eye Burst, GRB 080319B, observed by the TORTORA wide-field optical monitoring system. The event is extreme not only in observed properties but also intrinsically: it is the most luminous event ever recorded at optical wavelengths. The temporal properties suggest short-lived periodic activities of the internal engine. This is the fastest optically variable source detected at cosmological distances.
Keywords:
-ray burst, ground-based observations, time variability.:
98.70.Rz; 95.55.Cs; 95.75.Wx.1 Introduction to the Phenomenon: Prompt Optical Emission
Over the past nine years the prompt optical emissions contemporaneous with the -ray-active phase of a GRB have became subject of exciting debate in the astronomical community; the brevity of these phenomena and their fleeting nature makes them elusive and difficult to study. Due to the relative short duration of the prompt -ray emission (T 0.2-100 sec) simultaneous follow-up observations at optical wavelengths suffer lack of rapid and precise burst localization. GRB 990123 was the first event for which optical emission was detected during the burst phase (Akerlof et al., 1999).
Nowadays, the fast and accurate localization of GRBs by the Swift mission (Gehrels et al., 2004) and its capability to alert fast-slewing robotic telescopes within few seconds after the burst has allowed to significantly increase the numbers of the events that are optically observed during the bursting phase, although the prompt optical emissions are usually not well sampled.
During the last years, we have investigated different search strategies in ultra fast photometry fields to measure rapid changes in light intensity in a phenomenon occurring within an extremely short period of time and randomly distributed over the sky (Piccioni et al., 1993), (Beskin et al., 1999). The high-speed and wide-field FAVOR (Karpov et al., 2005) and TORTORA cameras represent the more recent developments in our search program in which intensified CCD imaging are employed and tested. In particular the ground-based TORTORA observations synchronized with the -ray telescope on board of the Swift satellite (BAT: Burst Alert Telescope) has permitted to trace the optical burst time structure of the GRB 080319B with unprecedented level of accuracy.
At the beginning of the May 2006 TORTORA was installed in the dome of the REM telescope located at ESO-La Silla Observatory (Chile) and successfully achieved its First Light (Molinari et al., 2006).
2 Observation and Data Reduction
2.0.1 Observation
On 19 March 2008 at 06:12:49 UT (hereafter ) the Swift’s Burst Alert Telescope triggered and located GRB 080319B (trigger = 306757; (Racusin et al., 2008a)) with a 3’ radius error box. The bright burst was simultaneously detected by the Konus-Wind (KW) satellite (Golenetskii et al., 2008) yielding a burst fluence of = 6.23 0.13 [20 keV to 7 MeV].
Assuming = 0.937 (Vreeswijk et al., 2008) and the standard cosmology model ( = 71 , = 0.27 and = 0.73) the isotropic energy release is = .
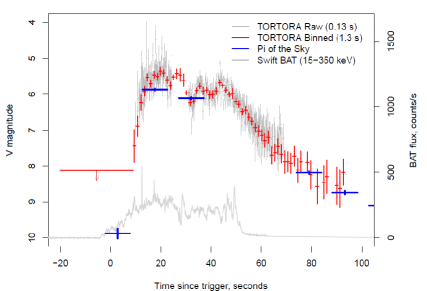
The field of the GRB 080319B was imaged before the GRB event by three independently ground-based optical sky monitoring. No optical precursors were detected in TORTORA, ”Pi of the Sky” and RAPTOR surveys with observations starting 26 minutes, 16 seconds and 30 minutes before the SwiftBAT trigger, respectively. In RAPTOR (Woźniak et al., 2009) and ”Pi of the Sky” (Cwiok et al., 2008) the first image with detectable optical emission started at = 1.87 5 sec and at = 2.75 5 sec after the BAT trigger, respectively, when the optical counterpart became brighter than V . In the TORTORA high temporal resolution dataset (0.13 sec exposure time), the first frame in which we detected the optical flux started at = 9.18 0.065 sec after the BAT trigger when the source became brighter than V (Karpov et al., 2008). The bright visual peaks which occurred during the prompt -ray emission approximately reached V , this made it visible with naked eye in the BOOTES constellation111http://grb.sonoma.edu/. for 40 seconds, assuming an observer in a dark location.
Since 05:46:22 UT REM telescope had observed the box of previous burst, GRB 080319A. At 06:12:49 UT, Naked-Eye Burst, GRB 080319B, flashed at 10 degrees from the former, near the edge of TORTORA’s field of view. At 06:13:13 UT, REM started automatic repointing, and from 06:13:20 UT the burst location stayed at the center of camera’s field of view. The observational conditions at that time of –trigger were suboptimal. The burst occurred at a zenith distance , the sky was bright due to a nearly full moon, and a large part of camera field of view had been covered by the REM dome. The Fig. 1 shows a summary of TORTORA, ”Pi of the Sky” and Swift BAT light curves.
2.0.2 Data Reduction
The values of the effective air mass at middle time exposure and the seeing as measured by La Silla–Meteo Monitor222www.ls.eso.org/lasilla/dimm/. were 2.6 and 0.9”, respectively. According to (Schlegel et al., 1998) Galactic Extinction value is E (B–V) = 0.011 mag which (assuming = 3.1) implies = 0.049, = 0.034, = 0.030. The TORTORA fast wide-field camera took the data on the field of GRB 080319B from 05:46:22 UT ( minutes before trigger) to 06:15:41.00 ( sec after trigger) collecting 13320 unfiltered images with an effective exposure time of 0.13 sec without any temporal gaps between consecutive frames. From 23 sec up to 30 sec after the burst, the REM-telescope was repointing to the location of GRB 080319B after the alert message was received through the GCN notices by the Swift-BAT instrument. The raw images stored in RAID have been processed at the day time by a pipeline including TV-CCD noise subtraction, flat-fielding to compensate vignetting due to objective design, and custom aperture photometry code taking into account non self-averaging pixel statistics caused by the image intensifier tube. Circular aperture photometry was performed with PHOT/DAOPHOT function in IRAF333IRAF: Image Reduction and Analysis Facility, http://iraf.noao.edu/.. For the REM repointing time interval fluxes have been derived using custom elliptic aperture photometry code after summation of 10 consecutive frames with compensated motion of the stars. Unfortunately, it seems impossible to reconstruct the light curve of this interval with any better resolution due to massive blurring of star PSF caused by their motion. For all other intervals, photometry has been performed both with 10-frames (1.3 sec effective exposure) binning, and with original (0.13 sec) time resolution. As a result, we have identified a new peak in the prompt optical light curve. Finally the photometry performed in instrumental system was calibrated towards the V magnitudes of several nearby Tycho2 stars. We have no data on prompt light curve color for GRB 080319B at early times ( ¡ ¡ 60 sec). Thus, no additional color corrections have been applied to TORTORA’s unfiltered data.
3 Light Curve Structure
TORTORA has tracked a fast rise of optical emission from +10 sec to +15 sec, followed by a complex evolution until +45 sec and a slow decay thereafter. The rise from V to V may be approximated by a power-law originated at 0; while –ray emission started earlier, at -4 sec. The decay since +45 sec is a power-law. Four peaks can clearly be seen in optical data with an inter-peak separation of 8.5 sec.
3.1 Observed and Intrinsic Optical Parameters
The fluxes of the four well-detected optical peaks
| (1) |
were obtained by using the calibration of (Fukugita et al., 1995) and were corrected for galactic extinction (Table 1). Host galaxy reddening correction was applied assuming the mean value reported by (Racusin et al., 2008b), E (B–V) = 0.05.
| Peak Flux | [erg cm-2 s-1] |
|---|---|
| ( | |
| ( | |
| ( | |
| ( |
The isotropic equivalent Luminosity (Table 2) for the well-detected optical peaks is related to the peak flux using the equation
| (2) |
where is the luminosity distance for the cosmological standard model and is the cosmological -correction that accounts for the transformation of the passband in the proper GRB frame:
| (3) |
Here, and are the frequency boundaries of the band and is the power-law index in the optical spectrum . For -correction we assume as reported by Racusin et al. (2008b).
| Peak Luminosity | [erg s-1] |
|---|---|
The optical fluence was determined by numerically integrating the prompt light curve in the interval from the earliest observation to the latest one with a power-law interpolation of the flux in the segments between the experimental points yielding = ( sec ¡ ¡ sec). The isotropic equivalent total energy in band in the rest frame of the source was determined from the optical fluence using the relation:
| (4) |
yielding = . The complex evolution from +15 sec to +45 sec consists of two well-distinct regions of different peak intensity levels: from +15 sec to +30 sec and from +30 sec to +45 sec which roughly correspond to two regions of -ray light curve. The event is extreme not only in observed properties but also intrinsically: it is the most luminous event ever recorded at optical wavelengths and has an exceedingly high isotropic-equivalent energy release in -rays. The previous record was held in brightness by GRB 990123 (Akerlof et al., 1999), GRB 050904 (Tagliaferri et al., 2005), GRB 061007 (Mundell et al., 2007). In spite of its initial brightness, the behavior of the afterglow at middle/late time does not appear to be peculiar. The extrapolated luminosity e.g. at 10 hour and at 13 hour after the trigger in the rest frame of the source ( 3.16 and 9.77 , respectively) are comparable with the average luminosity of the afterglow sample detected over the past few years (Nardini et al., 2008).
3.2 Variability Analysis
As reported previously the light curve is approximated by a four nearly equidistant flares with an inter-peak separation of 8.5 sec in observer frame. The Power Density Spectrum between 10 sec and 50 sec confirms this feature with a 99.999% confidence. When we use the high resolution data from +40 sec to +50 sec a periodicity at a frequency of 0.9 Hz is detected with a 99% confidence and it may be interpreted as a Lense-Thirring precession or nutation (Beskin et al., 2009).
4 Conclusions
The prompt optical emission of the GRB 080319B is peculiar for several reasons: it is the most luminous event ever recorded reaching a visual peak absolute magnitude of = -38.4 and is the variable object at cosmological distances with the shortest optical periodicity ever discovered. The temporal structures reflect the behaviour of the internal engine (periodicity of 8.5 seconds for overall emission, four peaks) and the disk precession ( 1.1 second period on the last peak), and imply the newborn stellar-mass black hole accreting from massive disk as an internal engine of this burst.
References
- Akerlof et al. (1999) C. Akerlof, R. Balsano, S. Barthelmy, J. Bloch, P. Butterworth, D. Casperson, T. Cline, S. Fletcher, F. Frontera, G. Gisler, J. Heise, J. Hills, R. Kehoe, B. Lee, S. Marshall, T. McKay, R. Miller, L. Piro, W. Priedhorsky, J. Szymanski, and J. Wren, Nature 398, 400–402 (1999).
- Gehrels et al. (2004) N. Gehrels, G. Chincarini, P. Giommi, K. O. Mason, and J. A. Nousek, et al., The Astrophysical Journal 611, 1005–1020 (2004).
- Piccioni et al. (1993) A. Piccioni, A. Bartolini, C. Cosentino, A. Guarnieri, S. R. Rosellini, A. di Cianno, A. di Paolantonio, C. Giuliani, E. Micolucci, and G. Pizzichini, “An updating about FIP: a photometer devoted to the search for optical flashes from gamma-ray bursters,” AIP Conference Proceedings 280, American Institute of Physics, New York1st Compton Gamma Ray Observatory Symp, 1993, pp. 1152 – 1155.
- Beskin et al. (1999) G. M. Beskin, V. Plokhotnichenko, C. Bartolini, A. Guarnieri, N. Masetti, A. Piccioni, A. Shearer, A. Golden, and G. Auriemma, Astronomy and Astrophysics Supplement 138, 589–590 (1999).
- Karpov et al. (2005) S. Karpov, G. Beskin, A. Biryukov, S. Bondar, K. Hurley, E. Ivanov, E. Katkova, A. Pozanenko, and I. Zolotukhin, Il Nuovo Cimento C 28, 747–751 (2005).
- Molinari et al. (2006) E. Molinari, S. Bondar, S. Karpov, G. Beskin, A. Biryukov, E. Ivanov, C. Bartolini, G. Greco, A. Guarnieri, A. Piccioni, F. Terra, D. Nanni, G. Chincarini, F. M. Zerbi, S. Covino, V. Testa, G. Tosti, F. Vitali, L. A. Antonelli, P. Conconi, G. Malaspina, L. Nicastro, and E. Palazzi, Il Nuovo Cimento B 121, 1525–1526 (2006).
- Racusin et al. (2008a) J. L. Racusin, N. Gehrels, S. T. Holland, J. A. Kennea, C. B. Markwardt, C. Pagani, D. M. Palmer, and M. Stamatikos, GRB Coordinates Network, Circular Service 7427, 1 (2008a).
- Golenetskii et al. (2008) S. Golenetskii, R. Aptekar, E. Mazets, V. Pal’shin, D. Frederiks, and T. Cline, GRB Coordinates Network, Circular Service 7482, 1 (2008).
- Vreeswijk et al. (2008) P. M. Vreeswijk, B. Milvang-Jensen, A. Smette, D. Malesani, J. P. U. Fynbo, P. Jakobsson, A. O. Jaunsen, and C. Ledoux, GRB Coordinates Network, Circular Service 7451, 1 (2008).
- Woźniak et al. (2009) P. R. Woźniak, W. T. Vestrand, A. D. Panaitescu, J. A. Wren, H. R. Davis, and R. R. White, The Astrophysical Journal 691, 495–502 (2009).
- Cwiok et al. (2008) M. Cwiok, W. Dominik, G. Kasprowicz, A. Majcher, A. Majczyna, K. Malek, L. Mankiewicz, M. Molak, K. Nawrocki, L. W. Piotrowski, D. Rybka, M. Sokolowski, J. Uzycki, G. Wrochna, and A. F. Zarnecki, GRB Coordinates Network, Circular Service 7439, 1 (2008).
- Karpov et al. (2008) S. Karpov, G. Beskin, S. Bondar, C. Bartolini, G. Greco, A. Guarnieri, D. Nanni, A. Piccioni, F. Terra, E. Molinari, G. Chincarini, F. M. Zerbi, S. Covino, V. Testa, G. Tosti, F. Vitali, L. A. Antonelli, P. Conconi, G. Cutispoto, G. Malaspina, L. Nicastro, E. Palazzi, E. Meurs, and P. Goldoni, GRB Coordinates Network, Circular Service 7452, 1 (2008).
- Schlegel et al. (1998) D. J. Schlegel, D. P. Finkbeiner, and M. Davis, Astrophysical Journal 500, 525–553 (1998).
- Fukugita et al. (1995) M. Fukugita, K. Shimasaku, and T. Ichikawa, Publications of the Astronomical Society of the Pacific 107, 945–958 (1995).
- Racusin et al. (2008b) J. L. Racusin, S. V. Karpov, M. Sokolowski, J. Granot, X. F. Wu, and V. Pal’Shin, et al., Nature 455, 183–188 (2008b).
- Tagliaferri et al. (2005) G. Tagliaferri, L. A. Antonelli, G. Chincarini, A. Fern ndez-Soto, D. Malesani, M. Della Valle, P. D’Avanzo, A. Grazian, and V. Testa, et al., Astronomy and Astrophysics 443, L1–L5 (2005).
- Mundell et al. (2007) C. G. Mundell, A. Melandri, C. Guidorzi, S. Kobayashi, I. A. Steele, D. Malesani, L. Amati, P. D’Avanzo, D. F. Bersier, A. Gomboc, and E. Rol, et al., The Astrophysical Journal 660, 489–495 (2007).
- Nardini et al. (2008) M. Nardini, G. Ghisellini, and G. Ghirlanda, Monthly Notices of the Royal Astronomical Society 386, 87–91 (2008).
- Beskin et al. (2009) G. Beskin, S. Karpov, S. Bondar, A. Guarnieri, C. Bartolini, G. Greco, and A. Piccioni, eprint arXiv:0905.4431, submitted (2009).