The Dynamics of Radiation Pressure-Dominated H ii Regions
Abstract
We evaluate the role of radiation pressure in the dynamics of H ii regions. We first determine under what conditions radiation pressure is significant in comparison to gas pressure and show that, while radiation pressure is generally unimportant for H ii regions driven by a handful of massive stars, it is dominant for the larger H ii regions produced by the massive star clusters found near the Galactic center and in starburst environments. We then provide a solution for the problem of how H ii regions expand when radiation pressure influences their behavior. Finally, we compare radiation-dominated H ii regions to other sources of stellar feedback, and argue that H ii regions are probably the primary mechanism for regulating the formation of massive star clusters.
Subject headings:
galaxies: star clusters — HII regions — ISM: bubbles — radiative transfer — stars: formation — stars: winds, outflows1. Introduction
The dynamical expansion of a bubble of warm, ionized gas produced by a young star or star cluster is one of the classical problems of the interstellar medium. H ii region dynamics are important in part because they play a dominant role in regulating the formation of star clusters. Williams & McKee (1997) and Carpenter (2000) argue based on observations that no more than of the mass in a giant molecular cloud can ever be incorporated into stars, and Matzner (2002) and Krumholz et al. (2006) present GMC models that explain this inefficiency quantitatively in terms of the evaporation of GMC mass by H ii regions. Nearby star clusters provide direct evidence for this phenomenon. For example in the Orion Nebula Cluster, the radiation of Ori C launches an ionized wind from the molecular cloud surface that carries a mass flux of yr-1 (O’dell, 2001), sufficient to ablate a mass comparable to the ONC’s stellar mass in yr. Any understanding of star formation rates and efficiencies, and of molecular cloud lifetimes, must therefore be based on an understanding of H ii regions.
Most work on this problem to date has focused on H ii regions where conditions are similar to those found in the Galaxy within several kpc of the Sun. The star clusters in this region are typically below in mass (e.g. Williams & McKee, 1997; Lada & Lada, 2003), and since a fully-sampled IMF at zero age produces ionizing photons s-1 per of stars (Krumholz et al., 2006), they have luminosities of at most ionizing photons s-1. For ionizing luminosities in this range, both numerical treatments and analytic estimates show that radiation pressure is generally small compared to gas pressure inside H ii regions (e.g. Mathews, 1969; Gail & Sedlmayr, 1979; Arthur et al., 2004; Henney, 2007). Thus while radiation on dust grains may play an important role producing small holes in H ii region centers (e.g. Mathews, 1967; Inoue, 2002), the standard assumption has been that radiation pressure is not significant for determining the dynamics the H ii region as a whole. Treatments of H ii regions under circumstances where radiation pressure is significant have generally been limited to hydrostatic models that do not include any dynamics (e.g. Dopita et al., 2002, 2003, 2006) or numerical models of particular regions (e.g. Pellegrini et al., 2007, 2009; Harper-Clark & Murray, 2009). The former provide little information on how radiation pressure affects gas motion, while the latter do not easily lead to general conclusions about when radiation pressure is important and how H ii region dynamics are altered when it is.
A re-assessment of the role of radiation pressure in H ii region dynamics is timely because observations of star cluster formation are beginning to probe new regimes where earlier arguments minimizing the role of radiation pressure no longer apply. The importance of radiation pressure rises as the ionizing luminosity does, and in contrast to the values of at most s-1 found in local H ii regions, the Arches cluster near the Galactic center has an ionizing luminosity of s-1 (Figer et al., 2002), and some extragalactic clusters have even larger values.
Moreover, regions with large ionizing luminosities also tend to have large virial and escape velocities, and in this case the conventional description of H ii region expansion driven by ionized gas pressure also breaks down. McCrady & Graham (2007) measure velocity dispersions of km s-1 for the super star clusters in M82, and this probably represents a lower limit on the velocity dispersions and escape velocities in the clusters’ parent molecular clouds. Since the sound speed in ionized gas is only km s-1, an H ii region driven by gas pressure could not have expanded within or driven mass out of the the clouds from which these star clusters formed. We are forced to conclude that either these clusters must have formed with an efficiency of nearly 100%, or that some mechanism other than ionized gas pressure is responsible for removing mass and limiting the efficiency.
While we cannot directly rule out the hypothesis of 100% star formation efficiency for the M82 clusters, we can rule it out for similar large clusters in other galaxies. For example, the young star clusters observed in the Antennae galaxies have comparable escape velocities (Whitmore et al., 1999), but Fall et al. (2005) and Whitmore et al. (2007) find that the star clusters in the Antennae show the same “infant mortality” phenomenon as those in the Milky Way: roughly 90% of all star clusters dissolve within Myr of formation, almost certainly because the formation process operates with a low efficiency and removal of a majority of gas leaves the remaining stars unbound. Clearly some mechanism must remove gas from these clusters as they form, and we argue below that radiation-driven H ii regions are the most natural explanation.
Our approach to the problem is as follows. In § 2 we derive a condition for when radiation pressure is important, and we then give a solution to the idealized problem of an H ii region expanding into an ambient medium including radiation pressure effects. In § 3 we discuss the contribution of trapped radiation to H ii region dynamics. In § 4 we discuss the relative importance of radiation-driven H ii regions and supernovae. Finally, we summarize in § 5.
2. The Effects of Radiation Pressure
2.1. When is Radiation Pressure Significant?
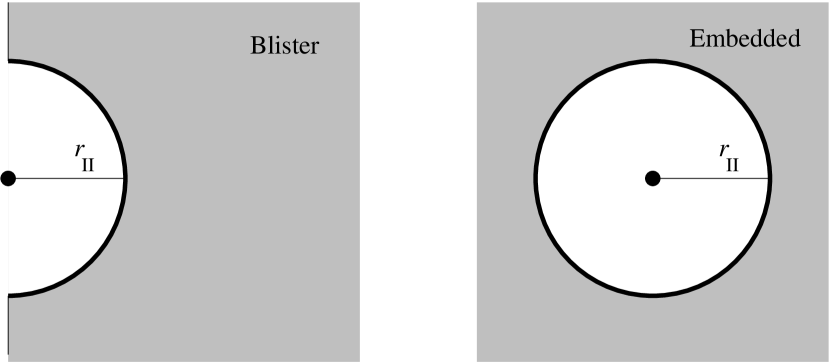
Consider a source of bolometric luminosity that produces ionizing photons at a rate , located at . Following Matzner (2002), we investigate two cases, which can be treated in parallel. The first is a region of neutral gas of density . The second is a region in which the density is for and 0 for . The former corresponds to the case of an “embedded” H ii region that is completely surrounded by dense gas, and the latter to a “blister” H ii region in which the driving source is at the edge of a dense cloud, and the ionized gas can escape freely. We illustrate these two possible configurations in Figure 1. We define eV as the threshold photon energy required to ionize a neutral hydrogen atom, and for convenience we define to be the ratio of the star’s bolometric power to its ionizing power, counting only an energy per ionizing photon. For massive stars and clusters whose luminosity comes mostly from massive stars, .
We wish to determine how the gas moves in response to the radiation flux, and to understand under what circumstances radiation plays an important role in determining gas motions. Following the usual procedure, we approximate that the ionized gas is isothermal at temperature , and has a sound speed which is much larger than the sound speed in the neutral gas. If radiation pressure is negligible, we have the usual Spitzer (1978) solution: the ionized material expands due to its thermal pressure. This expansion sweeps the neutral gas into a thin shell, which contains most of the mass that was originally inside the radius of the H ii region. If radiation pressure is the dominant force acting on the gas then a fluid element at a distance from the source undergoes a radiative acceleration , where is the opacity of the fluid at radius to photons of frequency , and is the optical depth from the source to that point. Photons below the Lyman limit carry roughly half the radiative momentum, and since these are absorbed primarily by dust grains, and thus the radiative acceleration is a decreasing function of . The other half of the momentum is carried by photons above the Lyman limit, which can be absorbed by either H i or dust grains – see Appendix A. If dust absorption dominates, then radiative acceleration falls with radius as for lower-energy photons. If H i absorption dominates, the acceleration is proportional to the recombination rate, which is either flat (if the gas density is uniform) or again declines with radius (if radiative acceleration causes gas to pile up near the shell edge). Thus, the total radiative acceleration is always largest closest to the source, and again material will be swept into a thin shell of radius . The interior of this shell will be optically thin.
Thus, after a rapid initial expansion phase, the dynamics of the gas reduce to the problem of computing the dynamics of the thin shell that bounds the H ii region. Following Matzner (2002), we can solve this problem by writing down the momentum equation for the shell:
| (1) |
where and are the shell’s mass and area, and and are the density and velocity of the gas immediately interior to it. The shell area and mass are and , where is the mean density inside the spherical or hemispherical region of radius in the initial cloud, and the values in parentheses refer to the cases for a (spherical, hemispherical) H ii region. The first term on the right-hand side represents gas pressure, while the second represents radiation pressure. Note that in writing this equation we have implicitly assumed that all the radiation force is applied at the thin shell, rather than in the H ii region interior. This is certainly a good approximation when radiation pressure is dominant, since, as discussed above, the interior of the shell will be cleared by radiation pressure, and thus all photons will be absorbed in or near the shell. When gas pressure dominates and the shell interior is of uniform density, the rate of momentum deposition by ionizing photons matches the recombination rate. Since this is uniform, so the mean radius at which momentum is deposited is of the shell radius. Moreover, non-ionizing photons, which carry half the total momentum, still deposit all their momentum in the shell. Thus our approximation that all the momentum is deposited in the shell is a good one.
The quantity in equation (1) represents the factor by which the radiation pressure force is enhanced by trapping of energy within the expanding shell. If , then the shell is optically thin and all stellar photons escape without depositing any momentum. Given the high color temperature of the emitting stars and the large opacity of the gas clouds where massive clusters form, this is not realistic. A value corresponds to every photon emitted by the stars being absorbed once in the shell and depositing its momentum there, then promptly escaping. If there is more than one interaction per photon then could potentially be much larger than unity. In this case the velocity to which the shell accelerates will be limited by the rate at which the stars supply energy rather than momentum.
Trapping can happen in three ways. First, some fraction of the stellar radiation will go into accelerating line driven winds off stellar surfaces (Castor et al., 1975b), and the expanding wind will collide with the slower-moving shell. This will produce some transfer of momentum, which could be large if the shocked gas becomes trapped inside the shell (Castor et al., 1975a; Weaver et al., 1977). Second, if the shell is sufficiently optically thick to long-wavelength radiation, then ultraviolet and visible photons that are absorbed by dust grains in the shell and re-radiated at infrared wavelengths may remain trapped in the shell and interact more times before finally escaping. Third, Lyman photons that are produced by recombinations in the shell or in the H ii region interior may undergo many resonant interactions before escaping. We defer a discussion of these trapping mechanisms until § 3, and for now we simply assert the result from that section: is always likely to be of order a few. For this reason, we choose to leave it as a free parameter of constant value, for which we adopt a fiducial value when we wish to perform numerical evaluations.
We can characterize when radiation pressure is significant by examining the limiting cases of gas- and radiation-pressure dominated flows. In the gas-pressure dominated case, we have the usual Spitzer (1978) H ii region solution. Once expansion of the H ii region becomes subsonic with respect to the ionized gas, the H ii region interior approaches a uniform density, and ionization balance requires that
| (2) |
where , , and are the radius, temperature, and sound speed of the ionized region, is the case-B recombination coefficient, is a dimensionless number that accounts for absorption of ionizing photons by dust grains and for free electrons provided by elements other than hydrogen, and we have adopted the usual on-the-spot approximation. If He is singly-ionized and 27% of photons are absorbed by dust rather than gas, as expected for gas pressure-dominated H ii regions with Milky Way dust-to-gas ratios (McKee & Williams, 1997), then . We discuss the value of , and of dust absorption generally, in more detail in Appendix A. Note that equation (2) holds approximately even in the case of a blister-type hemispherical H ii region. Following Matzner (2002), we consider in that in the case of an embedded, spherical H ii region that , while for a blister-type one . Thus the gas pressure term on the right-hand side of equation (1) becomes
| (3) |
In the limiting case of a radiation-pressure dominated flow, the radiation pressure term is simply . Since the radiation- and gas-pressure terms have different radial dependences, we can calculate a characteristic radius for which they are equal:
| (4) | |||||
| (5) |
where the numerical evaluation is for our fiducial parameters K, , , , and cm3 s-1, and s-1. Since radiation forces vary with radius as , radiation dominates at smaller radii and gas pressure at larger radii.
It is useful to compare this to the Strömgren radius at which gas pressure-driven expansion begins in the case of negligible radiation pressure force. Setting in equation (2) equal to the mean density inside , we find
| (6) |
and computing the ratio of to this we find
| (7) | |||||
| (8) |
where is the mean molecular weight in the fully ionized gas (so km s-1) and is the mean density of H nuclei in units of cm-3, and is the atomic mass per H nucleus for gas of standard cosmic composition.
| Name | ( ) | (pc) | (pc) | (pc) | Ref. | |||
|---|---|---|---|---|---|---|---|---|
| ONC | 0.046 | 0.8 | 2.8 | 2.7 | 0.062 | 2.2 | 0.94 | 1, 2 |
| Arches | 0.2 | 0.4 | 4.3 | 400 | 9.2 | 650 | 0.40 | 3, 4 |
| NGC 5253 | 5 | 1.0 | 4.5 | 4000 | 92 | 0.55 | 5 | |
| M82 LaaM82 objects are super star clusters, whose identifiers correspond to those given in McCrady & Graham (2007) | 40 | 1.4 | 5.0 | 13000bbAn ionizing luminosity for this object has not been reported in the literature, so we estimate it by taking , the value for a fully-sampled zero-age IMF (Krumholz et al., 2006). | 290 | 0.44 | 6 | |
| M82 F | 1.5 | 4.0 | 1700bbAn ionizing luminosity for this object has not been reported in the literature, so we estimate it by taking , the value for a fully-sampled zero-age IMF (Krumholz et al., 2006). | 40 | 1100 | 0.82 | 6 | |
| M82 11 | 1.1 | 4.3 | 1200bbAn ionizing luminosity for this object has not been reported in the literature, so we estimate it by taking , the value for a fully-sampled zero-age IMF (Krumholz et al., 2006). | 28 | 1200 | 0.57 | 6 | |
| M82 9 | 2.5 | 4.0 | 7300bbAn ionizing luminosity for this object has not been reported in the literature, so we estimate it by taking , the value for a fully-sampled zero-age IMF (Krumholz et al., 2006). | 170 | 2700 | 1.2 | 6 | |
| M82 8 | 1.6 | 3.9 | 1300bbAn ionizing luminosity for this object has not been reported in the literature, so we estimate it by taking , the value for a fully-sampled zero-age IMF (Krumholz et al., 2006). | 29 | 680 | 0.91 | 6 | |
| M82 7 | 2.7 | 3.9 | 7000bbAn ionizing luminosity for this object has not been reported in the literature, so we estimate it by taking , the value for a fully-sampled zero-age IMF (Krumholz et al., 2006). | 160 | 2200 | 1.4 | 6 | |
| M82 6 | 1.4 | 3.9 | 850bbAn ionizing luminosity for this object has not been reported in the literature, so we estimate it by taking , the value for a fully-sampled zero-age IMF (Krumholz et al., 2006). | 20 | 520 | 0.83 | 6 | |
| M82 k | 3.0 | 3.2 | 1800bbAn ionizing luminosity for this object has not been reported in the literature, so we estimate it by taking , the value for a fully-sampled zero-age IMF (Krumholz et al., 2006). | 41 | 290 | 2.3 | 6 | |
| M82 m | 1.4 | 4.3 | 2300bbAn ionizing luminosity for this object has not been reported in the literature, so we estimate it by taking , the value for a fully-sampled zero-age IMF (Krumholz et al., 2006). | 53 | 2000 | 0.62 | 6 | |
| M82 q | 1.9 | 3.4 | 890bbAn ionizing luminosity for this object has not been reported in the literature, so we estimate it by taking , the value for a fully-sampled zero-age IMF (Krumholz et al., 2006). | 20 | 280 | 1.4 | 6 | |
| M82 3 | 1.5 | 3.7 | 850bbAn ionizing luminosity for this object has not been reported in the literature, so we estimate it by taking , the value for a fully-sampled zero-age IMF (Krumholz et al., 2006). | 20 | 420 | 1.0 | 6 | |
| M82 1a | 2.1 | 3.8 | 2700bbAn ionizing luminosity for this object has not been reported in the literature, so we estimate it by taking , the value for a fully-sampled zero-age IMF (Krumholz et al., 2006). | 62 | 1100 | 1.1 | 6 | |
| M82 1c | 1.5 | 4.0 | 1600bbAn ionizing luminosity for this object has not been reported in the literature, so we estimate it by taking , the value for a fully-sampled zero-age IMF (Krumholz et al., 2006). | 38 | 1000 | 0.80 | 6 | |
| M82 r | 1.7 | 3.6 | 950bbAn ionizing luminosity for this object has not been reported in the literature, so we estimate it by taking , the value for a fully-sampled zero-age IMF (Krumholz et al., 2006). | 22 | 370 | 1.2 | 6 | |
| M82 t | 1.7 | 3.5 | 790bbAn ionizing luminosity for this object has not been reported in the literature, so we estimate it by taking , the value for a fully-sampled zero-age IMF (Krumholz et al., 2006). | 18 | 290 | 1.2 | 6 | |
| Ant B1ccAntennae objects are emission line clusters, whose identifiers correspond to those given in Gilbert & Graham (2007) | 42 | 29ddThis radius is almost certainly an overestimate of the radius at formation, since the Antennae emission line clusters have undergone significant expansion (Gilbert & Graham, 2007). Correcting for this effect would raise , which in turn would increase and decrease . | 1.0 | 5100 | 120 | 24 | 34 | 7 |
| Ant B | 50 | 49ddThis radius is almost certainly an overestimate of the radius at formation, since the Antennae emission line clusters have undergone significant expansion (Gilbert & Graham, 2007). Correcting for this effect would raise , which in turn would increase and decrease . | 0.47 | 5500 | 130 | 9.9 | 71 | 7 |
| Ant D | 19 | 40ddThis radius is almost certainly an overestimate of the radius at formation, since the Antennae emission line clusters have undergone significant expansion (Gilbert & Graham, 2007). Correcting for this effect would raise , which in turn would increase and decrease . | 0.30 | 1500 | 36 | 3.3 | 68 | 7 |
| Ant C | 41 | 21ddThis radius is almost certainly an overestimate of the radius at formation, since the Antennae emission line clusters have undergone significant expansion (Gilbert & Graham, 2007). Correcting for this effect would raise , which in turn would increase and decrease . | 1.5 | 1300 | 30 | 18 | 16 | 7 |
| Ant D1 | 16 | 11ddThis radius is almost certainly an overestimate of the radius at formation, since the Antennae emission line clusters have undergone significant expansion (Gilbert & Graham, 2007). Correcting for this effect would raise , which in turn would increase and decrease . | 2.0 | 100 | 2.3 | 6.9 | 5.2 | 7 |
| Ant D2 | 8.0 | 35ddThis radius is almost certainly an overestimate of the radius at formation, since the Antennae emission line clusters have undergone significant expansion (Gilbert & Graham, 2007). Correcting for this effect would raise , which in turn would increase and decrease . | 0.11 | 1000 | 23 | 1.8 | 79 | 7 |
| Ant E1 | 2.6 | 13ddThis radius is almost certainly an overestimate of the radius at formation, since the Antennae emission line clusters have undergone significant expansion (Gilbert & Graham, 2007). Correcting for this effect would raise , which in turn would increase and decrease . | 0.91 | 170 | 3.8 | 1.9 | 21 | 7 |
| Ant E2 | 4.1 | 25ddThis radius is almost certainly an overestimate of the radius at formation, since the Antennae emission line clusters have undergone significant expansion (Gilbert & Graham, 2007). Correcting for this effect would raise , which in turn would increase and decrease . | 0.25 | 170 | 3.9 | 0.7 | 48 | 7 |
| Ant E3 | 0.7 | 11ddThis radius is almost certainly an overestimate of the radius at formation, since the Antennae emission line clusters have undergone significant expansion (Gilbert & Graham, 2007). Correcting for this effect would raise , which in turn would increase and decrease . | 0.60 | 170 | 3.9 | 1.2 | 31 | 7 |
| Ant F | 7.4 | 9.3ddThis radius is almost certainly an overestimate of the radius at formation, since the Antennae emission line clusters have undergone significant expansion (Gilbert & Graham, 2007). Correcting for this effect would raise , which in turn would increase and decrease . | 1.8 | 220 | 5.0 | 8.9 | 7.3 | 7 |
| Ant E5 | 26 | 23ddThis radius is almost certainly an overestimate of the radius at formation, since the Antennae emission line clusters have undergone significant expansion (Gilbert & Graham, 2007). Correcting for this effect would raise , which in turn would increase and decrease . | 1.2 | 200 | 4.7 | 3.2 | 16 | 7 |
| Ant F2 | 3.5 | 17ddThis radius is almost certainly an overestimate of the radius at formation, since the Antennae emission line clusters have undergone significant expansion (Gilbert & Graham, 2007). Correcting for this effect would raise , which in turn would increase and decrease . | 0.71 | 440 | 10 | 2.7 | 32 | 7 |
| Ant F1 | 15 | 15ddThis radius is almost certainly an overestimate of the radius at formation, since the Antennae emission line clusters have undergone significant expansion (Gilbert & Graham, 2007). Correcting for this effect would raise , which in turn would increase and decrease . | 1.4 | 74 | 1.7 | 2.5 | 9.2 | 7 |
| Ant E4 | 6.5 | 36ddThis radius is almost certainly an overestimate of the radius at formation, since the Antennae emission line clusters have undergone significant expansion (Gilbert & Graham, 2007). Correcting for this effect would raise , which in turn would increase and decrease . | -0.01 | 1100 | 26 | 1.6 | 94 | 7 |
| Ant A1 | 5.0 | 15ddThis radius is almost certainly an overestimate of the radius at formation, since the Antennae emission line clusters have undergone significant expansion (Gilbert & Graham, 2007). Correcting for this effect would raise , which in turn would increase and decrease . | 1.0 | 2100 | 48 | 12 | 30 | 7 |
| Ant S | 32 | 14ddThis radius is almost certainly an overestimate of the radius at formation, since the Antennae emission line clusters have undergone significant expansion (Gilbert & Graham, 2007). Correcting for this effect would raise , which in turn would increase and decrease . | 1.9 | 210 | 3.9 | 10 | 6.3 | 7 |
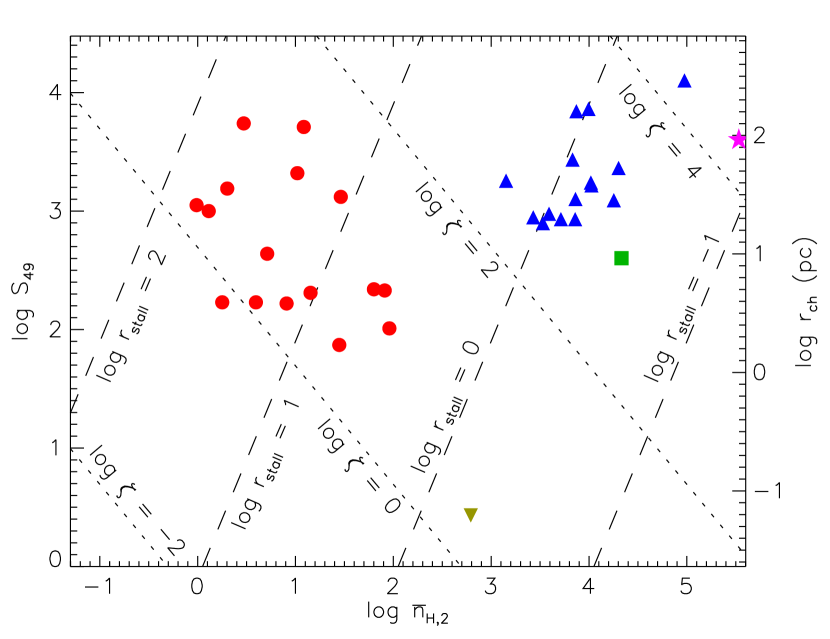
Thus we see that for single OB stars, , expanding into Galactic molecular clouds, , radiation force is negligible once the H ii region reaches a tenth of a pc in size ( pc), and is often negligible as soon as the ionized region has finished its initial rapid expansion to the Strömgren radius (). Thereafter the usual gas pressure-driven expansion solution applies. However, we reach a very different conclusion if we consider the formation of very massive clusters in dense environments. In Table 2.1 we list properties for a sample of massive star clusters in the Milky Way, M82, the Antennae, and NGC 5253. We plot versus for these objects in Figure 2. As the plot shows, these clusters have in the range , indicating that they go from the border between radiation- and gas-dominated to completely radiation-dominated. The characteristic radii where gas pressure becomes comparable to radiation pressure run from pc, which is generally larger than the physical size of the cluster in question. The exception is the Orion Nebular Cluster (the inverted triangle), by far the smallest cluster shown in Figure 2. This has pc (assuming a blister-type H ii region, which is observed), considerably smaller than the pc radius of the cluster.
We should add a caution here, which is that for the clusters described in Table 2.1 and plotted in Figure 2, we have computed , , and using the full ionizing luminosity of the cluster. This is not correct very early in the expansion process, since the initial Strömgren radius around each massive star is so small that it may enclose at most a few of its neighbors. Since this will lower the ionizing luminosity compared to our value, the very early expansion could be gas-driven. However, as the expanding shells overlap, the incorporation of more stars into their interiors will rapidly convert the expansion to a radiatively-driven one; since , the expanding shell in a cluster for which we have computed reaches and becomes radiation-dominated when the shell includes only of the cluster luminosity. Since luminosity tends to be strongly centrally concentrated, this will occur well before the shell includes this fraction of the cloud volume. Thus radiation takes over very early in the expansion process for those clusters for which we have computed values of .
2.2. The Dynamics of Expansion with Radiation Pressure
To study the dynamics of an expanding H ii region with significant radiation pressure, it is convenient to non-dimensionalize the equation of motion (1). We let and , where
| (9) |
With this change of variables equation (1) becomes
| (10) |
The first term on the right hand side represents radiation pressure, and the second represents gas pressure. This equation is not exactly correct near , because in writing the gas pressure term we have implicitly assumed that the density inside the H ii region is uniform and has the value given by ionization balance, equation (2). This assumption cannot be precisely true when , because while radiation pressure is significant it will exert a force on material in the H ii region interior that will make the density higher toward the shell wall than near the H ii region center, while equation (2) assumes uniform density. Nonetheless, equation (10) represents a reasonable approximation that becomes exact everywhere except near .

At early times, when , we can drop the gas pressure term on the right hand side, and the resulting equation admits the similarity solution
| (11) |
The dynamics of this solution can be understood by noting that since the momentum of the shell equals the radiant momentum modified by the trapping factor (), the shell’s kinetic energy is a very small fraction, , of the total radiated energy . In fact, if , then the energy of the shell’s motion approximately matches the energy of the photons currently crossing its interior: , where . The inefficiency of direct radiation driving is related to the low value of , an issue we return to in § 3.
If we were to drop the radiation pressure term, we would have the usual similarity solution for gas pressure expansion
| (12) |
Although the exact solution will approach this value when , the existence of a characteristic scale implies that there is no true similarity solution that includes both the radiation- and gas-driven phases. When radiation pressure is significant it provides an extra boost of momentum in the phase before gas pressure takes over, accelerating the expansion relative to the standard similarity solution. This breaks the self-similarity of the gas-driven expansion phase, although the expansion approaches self-similarity as and the extra momentum provided by the radiation becomes small compared to that input by the gas. In the absence of a similarity solution, however, it is trivial to integrate equation (10) numerically. We do so subject to the boundary condition that and approach the values that correspond to the similarity solution (11) as , and plot the result in Figure 3 for some sample values of . For comparison, we also show the pure radiation and pure gas similarity solutions. The true solution may be reasonably approximated by an appropriately weighted sum between the two. The expression
| (13) |
is accurate to better than 5% for .
2.3. H ii Region Stalling
As discussed in § 1, one of the reasons that radiation-driven expansion is of interest is that gas-driven expansion will fail in regions where the ambient velocity dispersion and escape velocity exceed the ionized gas sound speed (e.g. Matzner, 2002; Krumholz et al., 2006). The expansion velocity is , where
| (14) |
The expansion rate therefore drops to the ionized gas sound speed when . Since we have solved for numerically, it is trivial to numerically invert this equation for a given to obtain the radius and time at which the expansion becomes subsonic. However, it is more illuminating to consider the radiation-dominated case , because in that case the similarity solution (11) applies, and the resulting analytic form for allows us to solve for the radius at which the subsonic transition occurs in closed form. In this limit, expansion becomes subsonic at
| (15) |
To give some idea of this in physical units, for the radius at which the expansion becomes subsonic is
| (16) |
Clearly the transition to subsonic expansion will not happen until an H ii region has swept up a significant fraction of the gas in the protocluster, and it is therefore likely that radiation-driven H ii regions can expel gas from clouds where gas-driven ones could not.
Alternately, we can ask when the H ii region expansion velocity becomes comparable to the velocity dispersion within the parent cloud. This should be a reasonable estimate of when the expansion will stall. To the extent that the parent cloud is in virial balance, this will also a good estimate of at what radius the expansion velocity will be reduced to the point where gravity can prevent expansion.111One might expect that comparing radiation forces to gravitational ones would not produce a characteristic radius, since both vary as . However, this argument is only valid if the gravitational force is dominated by a central point mass. Forming star clusters, however, are dominated by gas mass, and for a gas mass distribution , the gravitational force varies as . Thus it is possible to obtain a characteristic radius at which gravity balances radiation. We write the velocity dispersion of material within a radius of the cloud center as
| (17) | |||||
| (18) |
where is the mass within a radius of the origin, , and is the virial ratio of the material inside radius (Bertoldi & McKee, 1992). The factor appears because the gas is spherical in the embedded case and hemi-spherical in the blister case. The velocity dispersion can be either larger or smaller than depending on the density and radius: for , we have . The expansion velocity of the shell is equal to this velocity at the dimensionless radius for which
| (19) |
As with the problem of determining when the expansion becomes subsonic, it is simple to find a numerical solution to this equation for a given choice of and , but it is more illuminating to consider the radiation-dominated case, for which we can find a solution analytically. If we set equal to the value given by equation (11) for the radiation-dominated phase, then the dimensionless radius that satisfies equation (19) is
| (20) |
Putting this in dimensional terms, for and the stalling radius is
| (21) |
Numerical evaluations of for our sample clusters are given in Table 2.1. For most of the clusters shown, the stall radius is comparable to or larger than the total cluster radius. This demonstrates that, unlike gas pressure-driven H ii regions, radiation pressure-driven ones can potentially expel gas from the large clouds that form massive clusters. We show lines of constant (computed for the radiation-dominated case), with observed clusters over-plotted, in Figure 2.
3. Radiative Trapping
Our derivation of the shell motion in § 2 assumes that during the radiation-dominated phase shells are momentum driven, in the sense that the force exerted on the shell is the radiation momentum flux multiplied by at most a modest enhancement factor . However, if stellar radiation energy becomes trapped in the bubble interior, then the full amount of bolometric energy emitted by the stars can be used to drive expansion, and . Here we estimate considering three possible sources of trapping:
| (22) |
where the 1 represents absorption of the direct radiation and the remaining three factors on the right are the contributions to trapping due to stellar winds, infrared photons, and Ly photons.
3.1. Stellar Winds
Massive stars emit strong winds, during their main sequence evolution and afterward. The observational and theoretical status of these winds is somewhat uncertain, due to the effects of line blanketing (which affects the mapping between spectral type and effective temperature; Martins et al. 2002, 2005; Repolust et al. 2004) and of wind clumpiness (which affects the inferred momentum flux). Nevertheless the wind-luminosity relation (Kudritzki et al., 1999), which appears to remain valid after these corrections (Repolust et al., 2004), implies that a young cluster massive enough to sample the entire initial mass function emits about one half as much force in winds as in starlight, with . The ratio reflects the flux-averaged optical depth of line overlap in the winds from hot stars, and so indicates a transfer of momentum from photons to wind.222In optically thick Wolf-Rayet winds and LBV outbursts, by contrast, the wind momentum can exceed ; however the stellar energy budget is smaller after core H burning, and we assume the momentum budget is as well.
In a dense cluster, the winds emitted by different stars rapidly collide with each other and shock-heat up to temperatures of K. The hot, shocked gas will then accelerate to supersonic speeds in a thermally-driven wind (Cantó et al., 2000), creating a bubble in the surrounding K gas. Models of stellar wind bubbles (Castor et al., 1975a; Koo & McKee, 1992a, b) typically assume that motions are efficiently energy-driven, rather than momentum-driven, so long as the wind is fast enough for its stopping shock to be non-radiative. An energy-driven bubble expands much more violently than the momentum-driven solutions presented above: the kinetic energy of a radiation-driven shell is times smaller than the wind energy. Thus our solution is valid only if the expansion is momentum-driven. However, Harper-Clark & Murray (2009) point out that wind energy is easily lost if the shell is porous so the shocked wind gas can escape. Indeed, such escape is mandated by observations showing that the x-ray luminosity of large bubbles is far below what would be expected if all of the stellar wind energy remained trapped.
We use a modified version of Harper-Clark & Murray’s analysis to quantitatively estimate what this implies for . Suppose that the shell of material swept up the by the expanding H ii region covers a fraction of the sky as seen from the driving cluster; for blister case clearly , while for the embedded case could take any value between 0 and 1 depending on the shell’s porosity. Stars in the cluster launch winds with a mass flux at a velocity , and the fast wind material shock-heats to a temperature . The hot gas exerts a pressure on the shell, where is the density of the shocked material within the shell and is its isothermal sound speed, so
| (23) |
The pressure of hot gas is set by the balance between the injection and escape of mass and thermal energy. Both are injected directly by stellar winds and escape through holes in the shell, but additional mass is incorporated through the interaction of hot gas with the dense shell. We assume this stripping occurs through hydrodynamical ablation rather than thermal evaporation, partly because magnetic fields inhibit thermal conduction. Similarly, stellar photons only heat gas to temperature , not to , so they do not contribute; heating of gas to by x-ray photons is relatively insignificant. The equations for mass and energy conservation of the hot gas are
| (24) | |||||
| (25) | |||||
where middle terms in both equations assume the hot fluid escapes through holes at speed and has its average properties as it does so. Leakage ensures that mass and energy do not accumulate, implying that the LHS of both equations is effectively zero; furthermore the last term in , which represents adiabatic work, is negligible in the presence of holes because .
The term is the rate at which ionized gas at temperature ablates off the inner edge of the shell and heats up to through its interaction with the wind. The ablation process is a complex one, and the rate of ablation depends on the thermal behavior of the shocked wind. When the cooling time within the mixing layer is long, as it tends to be when the hot gas originates in a fast stellar wind. mass ablation occurs in the “jet-limited” regime described by Canto & Raga (1991). In this case the ablation rate is limited by the rate at which the wind can supply momentum to a thin mixing layer between the two fluids, and these authors estimate that the ablation rate per unit area is , where is the density of the ionized layer abutting the mixing layer. Assuming this process occurs over the entire shell, the total ablation rate is
| (26) |
Since the ionized gas is in pressure balance with the hot gas, . Inserting this and into equations (24) and (25) and omitting the negligible terms,
| (27) | |||||
| (28) |
The solution is
| (29) |
so that, using ,
| (30) |
The divergence as approaches unity is not real, as our neglect of adiabatic losses and of accumulation within the shell are incorrect when the holes close up. Likewise values of less than are not realistic, because the wind force is always present; our error in this limit is to assume that the wind energy is thermalized, when in fact it remains mostly kinetic if the shell is mostly holes.
Since , this implies that unless we are considering the case of an embedded H ii region with an extremely non-porous shell, . Such low porosity is implausible given the turbulent, clumpy nature of the interstellar medium and the fact that pressure-driven shocks tend to run down density gradients and “blow out”. Even if one started with a perfectly uniform ISM, the expanding shell is subject to Vishniac (1983) instability of a pressure-driven slab; moreover if the wind caused the expanding shell to accelerate then the Rayleigh-Taylor instability would spontaneously create holes in the shell, reducing below unity. Thus we conclude that is at most a few, and is likely to be small than order unity. Our conclusion is consistent with the numerical simulations of Tenorio-Tagle et al. (2006), who also find that, in a non-uniform medium, the bulk of the mass around a young star cluster is not swept up into the thermal wind driven by K gas. Instead, that gas escapes rapidly through the porous shell, while the bulk of the mass expands more slowly (see their Figure 9).
The above calculation depends somewhat on our estimate of the term , which is uncertain for several reasons: because the physics of ablation is not well understood, because the ablating area could be very different from , for instance if the shell’s structure is more interesting than a broken sphere, and because other mechanisms like thermal evaporation, photoevaporation, and cloud disruption can all inject mass. Similarly, the density of the ablating gas could be higher than indicated by our pressure-balance argument, since photoevaporation might compress the gas (e.g. Bertoldi & McKee, 1990). Given these uncertainties, one might consider better constrained than – for instance, an upper limit on the X-ray luminosity implies a lower limit on . Taking as given and solving equations (24) and (25) for , we find
| (31) |
so trapping is important when .
Protostellar winds represent a separate, brief, but very intense phase which deserve separate mention. Being magnetically launched, they are strongly collimated and may far exceed the photon momentum; moreover the entire stellar population generates them. Rather than assess them directly we appeal to the treatment by Matzner (2007), who found that protostellar winds are very significant in the formation of the Pleiades and Orion Nebula clusters, but quite insignificant in the formation of the Arches or more massive clusters.
3.2. Trapped Infrared Photons
If the expanding shell traps the infrared light emitted within it, then its momentum will exceed that of the driving starlight by a factor
| (32) |
where is the pressure of the trapped IR radiation field inside the shell. We first consider the highly idealized case of a uniform, non-porous shell, , which provides an upper limit on , before treating leakage through holes.
When a uniform shell is optically thick to its own thermal emission, it radiates from a photosphere above which the flux-averaged optical depth is 2/3. The emission is characterized by the shell’s effective temperature, which satisfies , and the flux-averaged mass opacity above the photosphere is approximately the Planck mean , implying a column above the photosphere. Shells with are optically thin to reprocessed light. Thick shells, with , can be treated in the diffusion approximation ( with and the Rosseland mean mass opacity), below the photosphere. The solution for the pressure within an optically thick shell is
| (33) |
where , and is the inverse function of . Evaluating equation (33) for the Weingartner & Draine (2001) standard dust model “A” for , we find that
| (34) |
to good accuracy, where is understood to be in g cm-2. This result shows that radiation trapping can be quite significant, for instance when and K, as is expected around a luminous young cluster; however this estimate is unrealistically high when radiation can leak away.
In the more realistic case where leakage is important, we can compute in a manner analogous to our calculation of , by balancing the rate at which energy the stars inside the shell add energy against the rate at which it leaks out. Our treatment here is a simplified version of that given in Appendix D of McKee & Tan (2008). We limit our attention to the case where the shell is optically thick () on average: in this limit we can compute the energy density of the trapped radiation field when the shell is porous, , simply by treating the shell as a perfectly opaque sphere with holes in it. In this case energy balance requires that
| (35) |
Here the left hand side is the rate at which the stars in the cluster inject radiant energy. The first term on the right hand side is the rate at which this beamed radiation field escapes the shell without interacting, while the second term represents the rate at which the reprocessed infrared radiation field leaks out. In writing this term, we have approximated that the IR radiation is isotropic, so the radiation flux escaping through a hole in the shell is given by the expression for the flux through an infinitesimal pinhole in an oven: . If the holes have finite size the true flux will be higher because the radiation field in the vicinity of the hole will be beamed outward. Solving this equation for gives
| (36) |
and substituting this into equation (32) gives
| (37) |
As with , this is an upper limit. The true value will be smaller because radiation leaks out of the shell by diffusion at a finite rate even when , because we have assumed that the internal radiation field has had an infinite amount of time to reach its steady state value, and because we have neglected the enhanced rate of energy loss through holes of finite size compared to those of infinitesimal size.
Even with this overestimate, our analysis shows find that for realistic values of , the ratio of the force provided by trapped IR to that provided by the direct radiation field is . We further note that, even if we started with a perfectly uniform ISM and did not have any winds to punch holes in the shell, numerical simulations show that a trapped IR radiation field is in itself sufficient to induce a Rayleigh-Taylor-like instability that punches holes in the shell (Krumholz et al., 2009). This will ensure that is always well below 1, so that is no more than a few.
3.3. Trapped Lyman Photons
Even blown-out sections of the shell that are transparent to infrared radiation may still be opaque to Lyman photons, since they interact via a resonant process that produces a far larger cross section than absorption of IR photons by dust grains. As a result, our analysis based on does not apply to Ly radiation. However, as pointed out by Henney & Arthur (1998), the influence of Ly trapping is severely limited by the presence of dust grains. Absorption by dust grains in the H ii region interior or its bounding shell converts Ly radiation to IR, which can then escape through the porous shell as discussed in the previous section. This process limits the energy density and pressure that can build up in Lyman . We refer readers to Henney & Arthur for a detailed treatment of this problem, and here simply quote the result: the Lyman radiation pressure saturates at a value , where and is the dust cross section per H nucleus for Ly photons. Milky Way gas has . We therefore have
| (38) |
Thus during the radiation-pressure dominated phase, , trapped Ly radiation is negligible in comparison to direct radiation pressure unless the dust is less opaque than typical Milky Way gas by a factor of . Once gas pressure begins to dominate, , trapped Ly radiation may exert more pressure than direct stellar radiation, but in this case it will still be negligible in comparison to gas pressure. For this reason we can simply set without making a significant error in any phase of the expansion.
4. Radiation-Driven H ii Regions Versus Supernovae
We have argued that radiation pressure dominates the dynamics of H ii regions in massive clusters, but this by itself does not establish that radiation-dominated H ii regions are the dominant source of feedback in star clusters. The primary alternative model is that supernovae are the main form of feedback (e.g. Parmentier et al., 2008; Baumgardt et al., 2008). However, we can show on the basis of time scales that supernovae can play only a limited role. The crossing time in an object (either star cluster or gas cloud) of mass and surface density is (Tan et al., 2006)
| (39) |
where is the object’s virial ratio (Bertoldi & McKee, 1992), , and . Both observations and theory indicate that gas clumps that are forming massive star clusters have (McKee & Tan, 2003; Krumholz & McKee, 2008), and a virial ratio would preclude the possibility of forming a gravitationally bound cluster. Thus we expect yr unless the cluster mass exceeds . This theoretical argument is in good agreement with observed star cluster crossing times in cases where those can be measured directly. For example, McCrady & Graham (2007) find crossing times of yr for 21 clusters in M82. Thus we conclude that the crossing time in protoclusters is at least an order of magnitude shorter than the Myr required for the first supernova explosion. Numerical studies of star cluster formation show that, in the absence of a source of energy to drive the turbulence (such as stellar feedback), star formation generally proceeds to efficiencies of order unity within a few crossing times (e.g. Bonnell et al., 2003). Thus supernovae could be an effective form of feedback only if some other, different energy source, most likely a different form of stellar feedback, inhibited star formation and kept the protocluster from collapsing for crossing times. While there is some observational evidence for such an extended star formation history (Tan et al., 2006; Huff & Stahler, 2006), even then supernovae would at most remove the last vestiges of gas from the cluster after most of the gas had been consumed by star formation or expelled by other mechanisms.
This argument argument does not by itself rule out the possibility that supernovae from neighboring star clusters that formed earlier might act as a source of delayed feedback. However, this idea also has timescale problems. In Orion, for example, there have been only SN explosions in the last 12 Myr (Bally, 2008), a rate of per Myr. Thus the typical cluster-forming cloud is not hit by a SN blast wave within its Myr crossing time. Moreover, even if a blast wave did hit a cluster-forming cloud, any shock strong enough to affect a cloud significantly tends to destroy it completely, rather than leaving it intact but exciting turbulent motions (Nakamura et al., 2006). Thus if SN from neighboring clusters were a dominant form of feedback, then most cluster-forming gas cloud would their lives being shredded by a blast wave. This is inconsistent with the observed morphologies of disrupting clouds, which typically show no evidence for interaction with a strong external shock.
5. Summary
We examine the role of radiation pressure in determining the dynamics of expanding H ii regions around young star clusters. We derive a characteristic number (equation 7) that describes the importance of radiation pressure in H ii region expansion, and we show that for very massive star clusters such as the Arches or the large clusters found in starburst galaxies, this number is always , indicating that radiation pressure dominates at least the initial phases of expansion. For such clusters, we derive a solution describing the expansion of a shell of material driven by a combination of radiation and gas pressure. Our solution shows that radiation pressure is capable of driving expansion at speeds considerably larger than the ionized gas sound speed, and therefore radiation-driven H ii regions can be an effective feedback mechanism in clusters where a high escape speed renders gas-driven H ii regions ineffectual.
Radiation-driven H ii regions are likely to be the dominant feedback mechanism that regulates the formation of massive star clusters. Unlike supernovae, they begin to operate immediately upon formation of the stars, rather than with a delay of many dynamical times. While stellar wind bubbles or trapped infrared radiation fields are potentially more effective than direct stellar photons as a source of feedback, we argue that they are unlikely to be dominant because they are sapped by leakage of energy out of the expanding shell. Future models of feedback in massive star cluster formation must therefore be careful to take radiation pressure-driven H ii regions into account.
Appendix A The Role of Dust Absorption
For most of the time that an H ii region is expanding, dust within it will be able to absorb photons. Assuming that all of a source’s radiant energy is eventually absorbed by dust grains (even if ionizing photons are first absorbed by hydrogen atoms and are eventually down-converted to photons below the Lyman limit), the equilibrium dust temperature at a distance from the source is given implicitly by
| (A1) |
where is dust the absorption efficiency, which depends on grain properties. Dust can survive wherever is below the sublimation temperature ; for the most refractory grains Wolfire & Cassinelli (1986, 1987) estimate erg cm-2 s-1, so at least some dust exists at all radii greater than the sublimation radius
| (A2) |
Even for the most luminous sources we consider, , this is much less than the cluster radius, , or . However, dust absorption does not affect the dynamics of the radiation pressure-dominated phase directly, since the dust and gas are likely to be well-coupled by magnetic fields. The momentum transferred by radiation to the gas therefore does not depend on whether photons are absorbed by dust grains or hydrogen atoms. However, dust grains do play a role when gas pressure becomes important, because they modify the ionized gas density and thus change the gas pressure; this dependence is captured through our parameter . A full discussion of the behavior of dust inside H ii regions is beyond the scope of this work, and we refer readers to Dopita et al. (2002) and Arthur et al. (2004). In this appendix we make some simple estimates to show that our use of a constant is unlikely to lead to serious error.
Arthur et al. (2004) show that the value of (which is equivalent to the parameter in Arthur et al.’s treatment) is determined by the dust optical depth through the ionized gas; for typical gas pressure-dominated H ii regions whose metallicity is not vastly greater than Solar, and is appropriate, consistent with our value of from McKee & Williams (1997). To see how this might vary for the radiation-dominated case, it is useful to estimate in terms of the ionization parameter
| (A3) |
where is the ionizing photon flux into the recombining gas and is its density. Ionization-recombination balance requires , where is the thickness of the recombining gas layer and is its number density, so the dust optical depth is
| (A4) |
where is the dust cross section per H nucleus to ionizing photons. The numerical evaluation uses cm2, appropriate for Solar metallicity.
Since , this result shows that as long as . When gas pressure dominates, is constant and an increase in ionizing luminosity increases . However, once radiation pressure becomes significant, there is a countervailing effect: radiation pressure piles up gas against the inner wall of the expanding shell, increasing its density and thus driving down. Under the assumption of hydrostatic equilibrium, Dopita et al. (2002) find that this effect ensures that never rises above . While our expanding shell is of course not in hydrostatic equilibrium, as long as the expansion is slow compared to the signal speed within the shell, quasi-hydrostatic equilibrium should be established in the shell interior, and thus we also expect a maximum value of . This ensures that dust absorption never dominates over ionized gas absorption, and we can safely adopt a constant, order-unity value of .
However, we note that even if this argument is incorrect, we only make a significant error in following the dynamics when , i.e. when gas and radiation pressure are nearly of equal importance. That is because our choice is appropriate when gas pressure dominates (), and does not affect the dynamics significantly when radiation pressure dominates (). Since our treatment of the crossover regime is very approximate in any event, inaccuracy in estimating in this regime would not further degrade our accuracy.
References
- Arthur et al. (2004) Arthur, S. J., Kurtz, S. E., Franco, J., & Albarrán, M. Y. 2004, ApJ, 608, 282
- Bally (2008) Bally, J. 2008, in Handbook of Star Forming Regions, Volume I: The Northern Sky, ed. B. Reipurth (ASP Monograph Publications), 459
- Baumgardt et al. (2008) Baumgardt, H., Kroupa, P., & Parmentier, G. 2008, MNRAS, 384, 1231
- Bertoldi & McKee (1990) Bertoldi, F., & McKee, C. F. 1990, ApJ, 354, 529
- Bertoldi & McKee (1992) —. 1992, ApJ, 395, 140
- Bonnell et al. (2003) Bonnell, I. A., Bate, M. R., & Vine, S. G. 2003, MNRAS, 343, 413
- Canto & Raga (1991) Canto, J., & Raga, A. C. 1991, ApJ, 372, 646
- Cantó et al. (2000) Cantó, J., Raga, A. C., & Rodríguez, L. F. 2000, ApJ, 536, 896
- Carpenter (2000) Carpenter, J. M. 2000, AJ, 120, 3139
- Castor et al. (1975a) Castor, J., McCray, R., & Weaver, R. 1975a, ApJ, 200, L107
- Castor et al. (1975b) Castor, J. I., Abbott, D. C., & Klein, R. I. 1975b, ApJ, 195, 157
- Dopita et al. (2006) Dopita, M. A., et al. 2006, ApJ, 639, 788
- Dopita et al. (2002) Dopita, M. A., Groves, B. A., Sutherland, R. S., Binette, L., & Cecil, G. 2002, ApJ, 572, 753
- Dopita et al. (2003) Dopita, M. A., Groves, B. A., Sutherland, R. S., & Kewley, L. J. 2003, ApJ, 583, 727
- Fall et al. (2005) Fall, S. M., Chandar, R., & Whitmore, B. C. 2005, ApJ, 631, L133
- Figer et al. (1999) Figer, D. F., Kim, S. S., Morris, M., Serabyn, E., Rich, R. M., & McLean, I. S. 1999, ApJ, 525, 750
- Figer et al. (2002) Figer, D. F., et al. 2002, ApJ, 581, 258
- Gail & Sedlmayr (1979) Gail, H. P., & Sedlmayr, E. 1979, A&A, 77, 165
- Gilbert & Graham (2007) Gilbert, A. M., & Graham, J. R. 2007, ApJ, 668, 168
- Harper-Clark & Murray (2009) Harper-Clark, E., & Murray, N. 2009, ApJ, 693, 1696
- Henney (2007) Henney, W. J. 2007, in Diffuse Matter from Star Forming Regions to Active Galaxies, ed. T. W. Hartquist, J. M. Pittard, & S. A. E. G. Falle (Dordrecht: Springer), 103
- Henney & Arthur (1998) Henney, W. J., & Arthur, S. J. 1998, AJ, 116, 322
- Hillenbrand & Hartmann (1998) Hillenbrand, L. A., & Hartmann, L. W. 1998, ApJ, 492, 540
- Huff & Stahler (2006) Huff, E. M., & Stahler, S. W. 2006, ApJ, 644, 355
- Inoue (2002) Inoue, A. K. 2002, ApJ, 570, 688
- Kim et al. (2000) Kim, S. S., Figer, D. F., Lee, H. M., & Morris, M. 2000, ApJ, 545, 301
- Koo & McKee (1992a) Koo, B.-C., & McKee, C. F. 1992a, ApJ, 388, 93
- Koo & McKee (1992b) —. 1992b, ApJ, 388, 103
- Krumholz et al. (2009) Krumholz, M. R., Klein, R. I., McKee, C. F., Offner, S. S. R., & Cunningham, A. J. 2009, Science, 323, 754
- Krumholz et al. (2006) Krumholz, M. R., Matzner, C. D., & McKee, C. F. 2006, ApJ, 653, 361
- Krumholz & McKee (2008) Krumholz, M. R., & McKee, C. F. 2008, Nature, 451, 1082
- Kudritzki et al. (1999) Kudritzki, R. P., Puls, J., Lennon, D. J., Venn, K. A., Reetz, J., Najarro, F., McCarthy, J. K., & Herrero, A. 1999, A&A, 350, 970
- Lada & Lada (2003) Lada, C. J., & Lada, E. A. 2003, ARA&A, 41, 57
- Martins et al. (2002) Martins, F., Schaerer, D., & Hillier, D. J. 2002, A&A, 382, 999
- Martins et al. (2005) Martins, F., Schaerer, D., Hillier, D. J., Meynadier, F., Heydari-Malayeri, M., & Walborn, N. R. 2005, A&A, 441, 735
- Mathews (1967) Mathews, W. G. 1967, ApJ, 147, 965
- Mathews (1969) —. 1969, ApJ, 157, 583
- Matzner (2002) Matzner, C. D. 2002, ApJ, 566, 302
- Matzner (2007) —. 2007, ApJ, 659, 1394
- McCrady & Graham (2007) McCrady, N., & Graham, J. R. 2007, ApJ, 663, 844
- McKee & Tan (2003) McKee, C. F., & Tan, J. C. 2003, ApJ, 585, 850
- McKee & Tan (2008) —. 2008, ApJ, 681, 771
- McKee & Williams (1997) McKee, C. F., & Williams, J. P. 1997, ApJ, 476, 144
- Nakamura et al. (2006) Nakamura, F., McKee, C. F., Klein, R. I., & Fisher, R. T. 2006, ApJS, 164, 477
- O’dell (2001) O’dell, C. R. 2001, ARA&A, 39, 99
- Parmentier et al. (2008) Parmentier, G., Goodwin, S. P., Kroupa, P., & Baumgardt, H. 2008, ApJ, 678, 347
- Pellegrini et al. (2007) Pellegrini, E. W., et al. 2007, ApJ, 658, 1119
- Pellegrini et al. (2009) Pellegrini, E. W., Baldwin, J. A., Ferland, G. J., Shaw, G., & Heathcote, S. 2009, ApJ, 693, 285
- Repolust et al. (2004) Repolust, T., Puls, J., & Herrero, A. 2004, A&A, 415, 349
- Spitzer (1978) Spitzer, L. 1978, Physical Processes in the Interstellar Medium (New York: Wiley-Interscience)
- Tan et al. (2006) Tan, J. C., Krumholz, M. R., & McKee, C. F. 2006, ApJ, 641, L121
- Tenorio-Tagle et al. (2006) Tenorio-Tagle, G., Muñoz-Tuñón, C., Pérez, E., Silich, S., & Telles, E. 2006, ApJ, 643, 186
- Turner et al. (2000) Turner, J. L., Beck, S. C., & Ho, P. T. P. 2000, ApJ, 532, L109
- Vishniac (1983) Vishniac, E. T. 1983, ApJ, 274, 152
- Weaver et al. (1977) Weaver, R., McCray, R., Castor, J., Shapiro, P., & Moore, R. 1977, ApJ, 218, 377
- Weingartner & Draine (2001) Weingartner, J. C., & Draine, B. T. 2001, ApJ, 548, 296
- Whitmore et al. (2007) Whitmore, B. C., Chandar, R., & Fall, S. M. 2007, AJ, 133, 1067
- Whitmore et al. (1999) Whitmore, B. C., Zhang, Q., Leitherer, C., Fall, S. M., Schweizer, F., & Miller, B. W. 1999, AJ, 118, 1551
- Williams & McKee (1997) Williams, J. P., & McKee, C. F. 1997, ApJ, 476, 166
- Wolfire & Cassinelli (1986) Wolfire, M. G., & Cassinelli, J. P. 1986, ApJ, 310, 207
- Wolfire & Cassinelli (1987) —. 1987, ApJ, 319, 850