Enhanced electric field sensitivity of rf-dressed Rydberg dark states
Abstract
Optical detection of Rydberg states using electromagnetically induced transparency (EIT) enables continuous measurement of electric fields in a confined geometry. In this paper, we demonstrate the formation of rf-dressed EIT resonances in a thermal Rb vapour and show that such states exhibit enhanced sensitivity to dc electric fields compared to their bare counterparts. Fitting the corresponding EIT profile enables precise measurements of the dc field independent of laser frequency fluctuations. Our results indicate that space charges within the enclosed cell reduce electric field inhomogeneities within the interaction region.
pacs:
32.80.Rm,42.50.Gy,03.67.Lx1 Introduction
Rydberg atoms are interesting in the context of precision measurement and sensing due to their strong interatomic interactions and extreme sensitivity to electric fields [1]. The application of Rydberg states as electric field sensors has been explored using a supersonic beam of krypton atoms with principal quantum number [2]. This experiment demonstrates the potential for electrometry using highly excited Rydberg states with a measured sensitivity of 20 V cm-1. However, a disadvantage of using Rydberg atoms is that the standard detection technique of pulsed field ionization means that the measurement cannot be performed continuously, and typically the detection system is relatively large. Recently, the coherent optical detection of Rydberg states using electromagnetically induced transparency (EIT) has been demonstrated in a thermal vapour cell [3], in an atomic beam [4] and in ultra-cold atoms [5]. This detection technique has the advantage that it is continuous and can be performed in confined geometries down to the micron scale [6]. Consequently one can envisage a compact electrometry device analogous to the chip scale atomic magnetometer [7].
Ladder EIT [8] involving a Rydberg state arises due to the formation of Rydberg dark states, which are coherent superpositions of the ground state and a Rydberg state. Rydberg dark resonances result in a narrow feature in the susceptibility, and thereby an enhanced electro-optic effect compared to bare Rydberg states [9]. This electro-optic effect can be measured either directly, by the displacement of the EIT dips in the absorption spectrum [3], or indirectly, by the phase shift of the probe field due to the electric-field dependence of the refractive index [9]. By reducing the probe laser intensity the Rydberg population in the dark state can be made vanishingly small while the change in transmission remains unchanged. Consequently, the effect of collisional ionization, which is often observed in high density vapours [10], can be eliminated.
Possible applications of Rydberg dark states include single-photon entanglement [11], the generation of exotic entangled states [12] and mesoscopic quantum gates [13]. In addition they are of interest to applications in electrometry, owing to their giant dc Kerr coefficient [9]. However, the sensitivity of a Rydberg dark state electrometer is limited by laser frequency fluctuations. Since reducing those to a suitable level entails a considerable experimental overhead, a technique to measure electric fields that is insensitive to the absolute laser frequency is desirable. Measurements of the splitting between D Stark sublevels [3] or between Stark states of higher angular momentum may be used to this end.
In this paper, we demonstrate the formation of Rydberg dark states dressed by a radio frequency (rf) field. Microwave or rf dressing of Rydberg states has previously been observed using laser excitation and field ionization of an atomic beam [14, 16] or of cold atoms [17]. Here, however, the resulting Floquet states are observed as EIT resonances in the absorption spectrum of the probe laser beam in a vapour cell. We show that these rf-dressed dark states have an enhanced sensitivity to dc electric fields. We also show that the strength of the dc electric field is encoded not only in the overall shift of the corresponding EIT feature but also in the shape of the transparency window. As a consequence, and as we illustrate by an actual measurement, rf dressing may help determine the dc field without absolute knowledge of the laser frequency. In addition, we show how the line shape of the dark state resonance provides information about the electric field inhomogeneity within the interaction region.
2 Theory
We focus on EIT in the ladder system in which a weak probe laser (wavelength 780 nm) is scanned through resonance with the transitions from the ground 5S state to the 5P states of 87Rb, in the presence of both dc and ac electric fields and a coupling laser (wavelength 480 nm) resonant with the 5P to the 32S transition. Such a ladder system is ideal for rf dressing as the two components of the dark state have a large differential shift in an external field and there is no additional splitting of the Rydberg state.
At any point in the cell, the local applied electric field can be written as . In the experiment, ranges from 10 to 30 MHz, which is much less than the relevant optical transition frequencies. Ignoring the laser fields and decoherence for the time being, we can work within the adiabatic approximation and describe each of the hyperfine components of the 32S1/2 state by a time-dependent state vector of the form [18]
| (1) |
In this expression, is the Stark state that develops from the field-free state when a static field is adiabatically turned on from 0 to , and is the corresponding eigenenergy of the Stark Hamiltonian. The dc and ac fields are sufficiently weak that one can take and , where denotes the static dipole polarizability of the Rydberg state [20], and are the energy and state vector in the absence of the field, and is the first-order coefficient of the perturbative expansion of the Stark state in powers of . Since the field is monochromatic, the state vector of the rf-dressed Rydberg state can also be written in the Floquet-Fourier form
| (2) |
with . A short calculation [16, 17] shows that within the approximations made above,
| (3) |
and , with
| (4) |
and . Hence, when decoherence is ignored, each of the two hyperfine components of the 32S1/2 state effectively turns into a manifold of equally spaced states under the action of the ac field [14, 16, 17]. Because the vectors and have opposite parity, does not couple to the 5P3/2 state. Therefore, the Rabi frequency for the transition from a particular hyperfine component of this state to a particular component of the dressed Rydberg state differs from the corresponding zero-field Rabi frequency only by a factor (for the transition to the component with energy ). The 5S1/2 and 5P3/2 states are also dressed by the applied field, but their polarizability is too small for any of their Floquet sideband states to be significantly populated at the ac field amplitudes considered here.
It follows that under the action of the ac field, and provided the relevant relaxation times are much longer than , one should expect that the Rydberg dark states turn into Floquet manifolds of dark states and that each EIT dip in the absorption spectrum acquires multiple side bands. That such Floquet dark states can be obtained in conditions easily accessible to experiment is one of the results of this paper. (In the opposite limit where the decoherence time is much shorter than the period of modulation, EIT happens as if the applied electric field is static and the experimental signal is the time-average of the instantaneous absorption spectrum over the distribution of values of .)
3 Comparison between theory and experiment
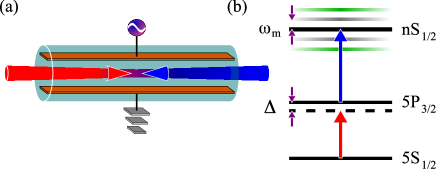
Schematics of the experimental set up and of the energy levels scheme are shown in figure 1. We employ a specially fabricated 11 mm-long Rb vapour cell containing two parallel plane electrodes running along its whole length and separated by a 5 mm gap. The probe beam and the co-axial, counter-propagating coupling beam are directed along the electrode cell axis and are both polarized parallel to the electrodes. Each beam is focussed using 10 cm lenses. The probe beam has an input power of 300 nW and a radius of 1.7 mm. The corresponding values for the coupling beam are 40 mW and 1.0 mm. The latter is stabilized against slow drift using EIT in a reference cell [21]. The transmission through the electrode cell is monitored as a function of the probe detuning. To increase the number density of Rb atoms the electrode cell is heated to c. 40 ∘C. The probe beam is split into two with one component propagating through the electrode cell, and the other passing through a longer room temperature cell. By subtracting these two signals, the Doppler background is removed. Measuring the off-resonant probe beam power after the electrode cell allows the change in transmission, , to be calibrated. The detuning axis is calibrated using saturation/hyperfine pumping spectroscopy.
A typical EIT spectrum with an applied ac field is shown in figure 2 together with theoretical fits for different spatial profiles of the electric field. The theoretical model of EIT is based on the steady-state solution of the optical Bloch equations in the weak probe limit [22], assuming that the different magnetic sub-levels of the ground state are equally populated. In the experiment, the intensity of the probe beam, , is considerably higher than the ideal weak probe limit [23], however, good agreement can still be obtained. The absorption spectrum is obtained by integrating the absorption coefficient over the velocity distribution of the atoms, the spatial profiles of the two laser beams and the length of the cell. The absorption coefficient is a function of four parameters that must be derived from the data, namely the Rabi frequency for the 5P to 32S transition, the dephasing rates of the 5P3/2–5S1/2 and 32S1/2–5P3/2 coherences, and the temperature of the vapour. The values of these experimental parameters are obtained by a least-square fit of the theoretical change in transmission, , to the data. The fit covers a range of probe detunings encompassing both the 5P and states whereas only latter is shown in figure 2. The mean separation between the plates is not known with sufficient precision, and therefore is derived from the data by fitting the Stark shift of the EIT resonances to equation (3) for a number of different values of the applied voltage.
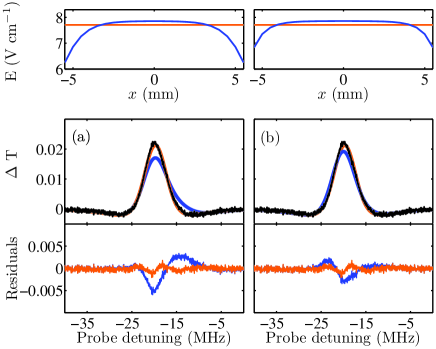
The spatial profile of the applied electric field along the laser beam axis is unknown due to the possibility of free charges inside the cell [3]. The field produced by the Stark plates drops significantly at their edges (see the top panels of figure 2). If we assume that the field experienced by the atoms exposed to the laser beams varies accordingly, the resulting theoretical EIT profile is asymmetric and inconsistent with the data (see the middle and bottom panels of figure 2). The theoretical results are found to be in good agreement with the data if the field is assumed to be uniform. This would occur if the free charges inside the cell equalize the electric field in the interaction region. We note in this respect that charges can be created by the photoelectric effect where the coupling laser intersects the Rb vapour on the inner surface of the cell, the photoelectrons being ejected from the surface. A net positive charge of on each window distributed over the waist of the coupling laser is sufficient to produce a total field with a spatial profile consistent with the experimentally observed lineshape. We cannot exclude a misalignment of the laser beams with respect to the centre of the plates, but the resulting offset would be less than 1 mm and even at 1 mm from the axis the field produced by the plates is more inhomogeneous than is compatible with the data (see the right-hand column of figure 2).
4 Observation of Floquet dark states
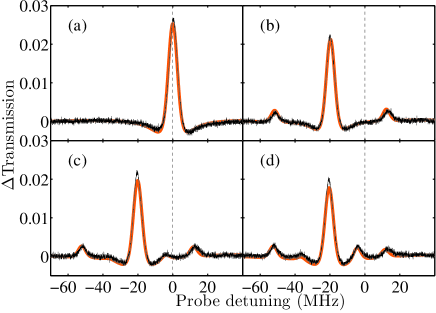
Following the analysis in the previous section we assume that the electric field experienced by the atoms is homogeneous, and measure spectra for different combinations of ac and dc applied fields ( and ). The results are presented in figure 3. The theoretical spectra are calculated assuming that the Rydberg state is described by the Floquet state vector (2) and that the four experimental parameters mentioned in Section 3 have the same values as in the zero-field case.
In figure 3(b), we consider a case where only a pure ac field is applied. As compared to figure 3(a), the main EIT peak is shifted by the ac Stark effect and the EIT profile acquires sidebands at the second harmonics of the modulation frequency. The spacing between the sidebands and the carrier in the transmission spectrum is smaller than by a factor 480/780 due to the Doppler mismatch. In view of the good agreement between theory and the measured data, we attribute the observed sidebands to the formation of Floquet dark states.
There are no odd-order sidebands in the absence of a dc field since for odd values of when . Their absence is consistent with the dipole selection rules, which forbid transitions from a P state to an S state by exchange of one laser photon and an odd number of rf photons. The effect of adding a weak dc offset is shown in figure 3(c). The spectrum acquires first order sidebands, since contributes to every when . As can be seen by comparing figures 3(c) and 3(d), increasing the dc field modifies the EIT spectrum in several ways. The largest change occurs on the sideband. In contrast, the additional Stark shift in the position of the central peak, which would be the only effect of the increase in the dc field in the absence of the modulation, is almost invisible on the scale of the figure. The comparison demonstrates the enhanced dc field sensitivity of rf-dressed Rydberg dark states.
5 Enhanced electric field sensitivity of Floquet dark states
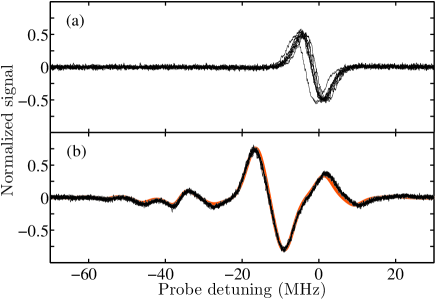
To further illustrate this enhancement effect, we now show that adding an ac modulation helps deduce the dc component of the electric field from the EIT resonance. The difference between transmission spectra measured with and without applying a dc field are shown in figure 4. Here we employ a double modulation technique where the dc field is switched on and off at a frequency of 50 kHz, i.e., much less than the modulation frequency. The effect of the dc field is then extracted using lock-in detection resulting in a derivative lineshape. Each thin black line represented in figure 4 gives the difference signal averaged over four consecutive scans. Figure 4(a) shows the difference spectrum in the absence of ac field for 10 individual data sets. The spread in the data reflects the instability of the probe laser. Deriving from these results is hindered by the fact that only the position of the EIT feature on the frequency axis, and not its shape, varies significantly with the strength of the dc field. Due to the experimental uncertainty in the probe frequency, a value of cannot be obtained by fitting the model to the data from figure 4(a). However, the fit is possible when these data are augmented by the difference EIT signal arising from the 5P state and by frequency calibration data obtained by saturation spectroscopy. The theoretical difference signal is calculated using the same values of the Rabi frequency, dephasing rates and temperature as in figure 3(a). We treat as an unknown parameter. For comparison with the theory, we correct the experimental results for random variations in the calibration of the probe frequency and of the signal by rescaling and shifting the origins of the respective axes. The corresponding offsets and scaling factors are found for each individual data set, together with , by fitting the rescaled experimental difference signal to the model. From the 10 values of obtained in this way, we find that V cm-1. This value is in agreement with that derived from the dc voltage applied to the electrodes, V cm-1, but it has a larger uncertainty.
A constant ac field is then added and the lineshape extracted once more, figure 4(b). The lock-in detection still only detects changes in signal due to the dc field. In this case, for the same dc field, the difference signal is larger and contains more features. As the details of these features depend on , the change in the spectrum due to the dc field is readily separated from the frequency fluctuations of the probe laser. Measuring is thus easier. The theoretical difference signal is calculated in the same way as in the absence of the rf field. We assume for the value derived from the voltage applied to the electrodes. From the 10 values of obtained by fitting the data from figure 4(b) to the model, we find that V cm-1 (or V cm-1 when the saturation spectroscopy data and the signal from 5P state are also taken into account). For these parameters, introducing an ac modulation thus reduces the uncertainty in the dc field measurement by one order of magnitude.
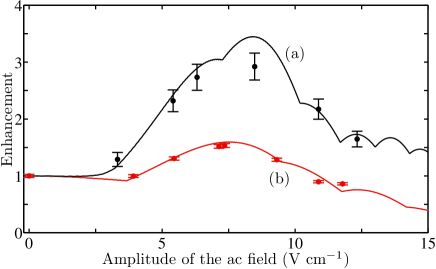
In the case considered in figure 4, the application of the ac field also increases the amplitude of the difference signal by about 50%. As shown in figure 5, larger enhancements (of up to 3) can be obtained for other combinations of dc fields and modulation frequencies.
6 Summary and outlook
In summary, we have demonstrated the formation of Floquet dark states induced by the application of an ac field to a ladder system involving a highly polarizable Rydberg state. We have shown that these states display enhanced sensitivity to dc electric fields and provide information on the strength of the dc field independent of the laser frequency. Potentially, an ac modulation may thus facilitate the measurement of the local electric field inside a vapour cell, which is a relevant issue in the control of Rydberg-Rydberg interactions. The simple theory outlined above can be generalized to the case where the field splits the Rydberg state into several Stark components, thereby opening the possibility of using ac modulation to enhance the sensitivity of measurements based on the D states or on states of higher angular momentum. We have shown that charge imbalances in an enclosed vapour cell can cancel the spatial inhomogeneities of the field, therefore for local field measurements the interaction region may need to be limited to a small volume. This would be the case, for instance, in a 3-photon Doppler-free excitation scheme in which the two pump and probe laser beams intersect at appropriate angles within a restricted volume.
Acknowledgments
We thank the EPSRC and the DPST Programme of the Thai Government for financial support.
References
References
- [1] Gallagher T F 1994 Rydberg Atoms (Cambridge: Cambridge University Press)
- [2] Osterwalder A and Merkt F 1999 Phys. Rev. Lett. 82 1831
- [3] Mohapatra A K, Jackson T R and Adams C S 2007 Phys. Rev. Lett. 98 113003
- [4] Mauger S, Millen J and Jones M P A 2007 J. Phys. B: At. Mol. Opt. Phys. 40 F319
- [5] Weatherill K J, Pritchard J D, Abel R P, Bason M G, Mohapatra A K and Adams C S 2008 J. Phys. B: At. Mol. Opt. Phys. 41 201002
- [6] Kübler H, Shaffer J P, Baluksian T, Löw R and Pfau T, arXiv:0908.0275.
- [7] Schwindt P D D, Knappe S, Shah V, Hollberg L, Kitching J, Liew L A and Moreland J 2004 Appl. Phys. Lett. 85 6409
- [8] Fleischhauer M, Imamoglu M and Marangos J P 2005 Rev. Mod. Phys. 77 633
- [9] Mohapatra A K, Bason M G, Butscher B, Weatherill K J and Adams C S 2008 Nature Phys. 8 890
- [10] Keeler M L 2008 Phys. Rev. A 77 034503
- [11] Friedler I, Petrosyan D, Fleischhauer M and Kurizki G 2005 Phys. Rev. A 72 043803
- [12] Møller D, Madsen L B and Mølmer K 2008 Phys. Rev. Lett. 100 170504.
- [13] Müller M, Lesanovsky I, Weimer H, Büchler H P and Zoller P 2009 Phys. Rev. Lett. 102 170502
- [14] Bayfield J E, Gardner L D, Gulkok Y Z and Sharma S D 1981 Phys. Rev. A 24 138
- [15] [] van Linden van den Heuvell H B, Kachru R, Traa N H and Gallagher T F 1984 Phys. Rev. Lett. 53 1901
- [16] Zhang Y, Ciocca M, He L-W, Burkhardt C E and Leventhal J J 1994 Phys. Rev. A 50 1101
- [17] van Ditzhuijzen C S E, Tauschinsky A and van Linden van den Heuvell H B, arXiv 09:07.4275v1
- [18] Autler S H and Townes C H 1955 Phys. Rev. 100 703
- [19] [] Pont M, Potvliege R M, Shakeshaft R and Teng Z-J 1992 Phys. Rev. A 45 8235
- [20] O’Sullivan M S and Stoicheff B P 1985 Phys. Rev. A 31 2718
- [21] Abel R P, Mohapatra A K, Bason M G, Pritchard J D, Weatherill K J, Raitzsch U and Adams C S 2009 Appl. Phys. Lett. 94 071107
- [22] Gea-Banacloche J, Li Y Q, Jin S Z and Xiao M 1995 Phys. Rev. A 51 576
- [23] Siddons P, Adams C S, Ge C and Hughes I G 2008 J. Phys. B: At. Mol. Opt. Phys. 41 155004