figure0em1.5em \cftpagenumbersofffigure
Optical memory based on ultrafast wavelength switching in a bistable microlaser
Abstract
We propose an optical memory cell based on ultrafast wavelength switching in coupled-cavity microlasers, featuring bistability between modes separated by several nanometers. A numerical implementation is demonstrated by simulating a two-dimensional photonic crystal microlaser. Switching times of less than 10 ps, switching energy around 15–30 fJ and on-off contrast of more than 40 dB are achieved. Theoretical guidelines for optimizing the performance of the memory cell in terms of switching time and energy are drawn.
pacs:
210.4680, 130.4815, 190.1450, 140.3948, 230.5298In recent years, several designs of an optical memory (flip-flop) cell were proposed. Elements based on bistability in active laser-based systems KawaguchiReview ; OksanenAPL ; LiuIEEE ; OsborneOE were shown to be promising in terms of switching performance. All-optical switching between the two memory states at the sub-nanosecond time-scale was reported for directionally bistable injection-locked microring lasers HillNature ; LiuIEEE and for bistable gain-quenching semiconductor optical amplifiers OksanenAPL . Microlasers offer an advantage in the switching energy due to a small cavity size and high Q-factors ourPRA09 . Recently, it was reported ourPSS07 ; ourPRL07 ; ourPRA09 that a coupled-cavity microlaser can lase into either of its supermodes in a bistable manner with a possibility of ultrafast picosecond-scale switching between these modes ourPRL07 .
In this Letter, we build up on our recent findings on bistability in microlasers ourPSS07 ; ourPRL07 ; ourPRA09 to propose a design of an ultrafast optical memory cell. We consider two identical coupled defects in a two-dimensional (2D) triangular protonic crystal (PhC) lattice (see Fig. 1) with active centers (e.g., quantum dots or quantum wires) embedded into the defects AtlasovAPL07 ; AtlasovAPL08 . Such structures are within the state of the art of current fabrication possibilities AtlasovOE . Direct SNOM observations confirm the formation of coupled-cavity supermodes in such a system IntontiSNOM . Unlike in polarization bistability, directional bistability in bidirectional ring lasers, or bistability among longitudinal modes in unidirectional ring lasers NarducciPRA , bistable modes in coupled-cavity microlasers can be up to tens of nanometers apart from each other ourPRL07 , which makes the output signal subject to an easy spectral separation compatible with a WDM arrangement. Our numerical simulations show that for a laser operating 100–300 times above threshold (which is still practically realizable), switching between modes 3 nm apart can occur at less than 10 ps (see Fig. 1), with switching energy estimated to be around 15–30 fJ.
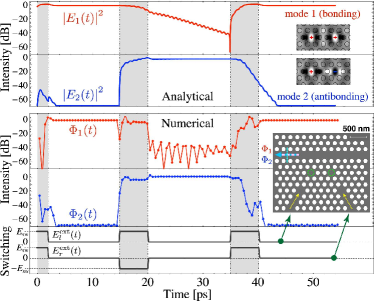
To describe the laser dynamics, we use the coupled mode theory ourPRA09 , which is a generalization of existing models (see, e.g., NarducciPRA ) for the case of arbitrary cavity shape. A resonator comprising two identical coupled cavities supports two modes (the bonding and the antibonding supermodes) characterized by symmetric (in-phase) vs. antisymmetric (out-of-phase) cavity field distribution, respectively (see inset in Fig. 1) We assume the supermodes to have frequencies and decay rates . The total cavity field can be written in terms of spatial mode distributions and time-dependent mode amplitudes as . In the limit of class-B laser, the mode amplitudes obey the equations ourPRA09
| (1) |
where = and . The terms account for the -th mode projection of the externally injected signal ourPSSMethods07 . are projections of population inversion governed by the equations
| (2) |
Here and are projections of the external pumping rate . Other parameters are listed in Table 1. The elements of the matrix are composed of and . For symmetric pumping and near-orthogonal modes, the non-zero elements are
| (3) |
It was shown that Eqs. (1)–(2) support bistable solutions provided and the pumping rate is high enough ourPRA09 . A corresponding flow diagram is shown in Fig. 2a, clearly indicating two stable states (M1 and M2) with two equally sized domains of attraction divided by a separatrix.
| Symbol | Value | Comment (see also ourPRA09 for details) |
|---|---|---|
| dipole moment of atomic laser transition | ||
| dielectric constant of the host (GaAs) | ||
| operating frequency (around 885 nm) | ||
| polarization decay rate (laser linewidth) | ||
| intermode frequency separation | ||
| cavity mode decay rate | ||
| population inversion decay rate | ||
| non-zero mode overlap integrals |
The principle of optical memory operation proposed here is based on the switching of the bistable microlaser between its two stable states by injection locking. Either mode can be locked into by choosing the right spatial profile of the injection signal while keeping the same spectral profile ourPRL07 . Suppose the laser is at M2, i.e., generating into mode 2 so that . An injected pulse shifts the mode balance in favor of mode 1, i.e., moves the resonator away from M2 and over the separatrix. Due to bistability, the system will relax to the other stable point M1, i.e., ends up lasing into mode 1 (see Fig. 2a). In order to reach the separatrix the minimal energy delivered by the switching pulse should be at least where is the energy stored in the cavity.
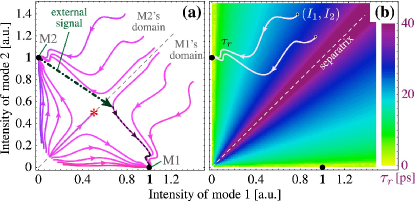
In response to the switching pulse, assumed to be a step function with height and duration , two processes can be distinguished (Fig. 2a): evolution of the system away from M2 under the action of the pulse and relaxation to M1 after the pulse has subsided. The former is time-limited by the switching pulse duration . The duration of the latter depends only on the initial point on the flow diagram that the switching pulse brings the system to. This duration is large near the separatrix and rapidly decreases away from it (Fig. 2b). It is thus desired that the switching pulse brings the system close to mode-1 axis or M1. The desired pulse energy is then . When varies between and , the switching time is expected to drop significantly.
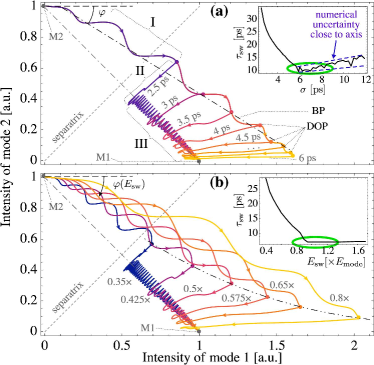
This can be confirmed by plotting the switching diagrams in -space (Fig. 3). One can see that while the pulse remains in effect, the system evolves along a straight line, build-up path (BP), accompanied by relaxation oscillations. The pulse duration determines how far the system progresses along BP (I in Fig. 3a). As soon as the pulse ends, the system leaves BP at a drop-off point (DOP), quickly relaxing onto the M2-M1 line (II) and then slowly continuing along this line towards the other stable point (III).
The slope angle of the BP depends on the balance between and . Higher increases the injection rate for the mode 1 while higher -factors (smaller ) make the decay of the mode 2 slower. Both effects lead to a decrease of (Fig. 3b). Hence, setting the finesse of the resonator too high makes switching excessively long while lowering the -factors increases and, in turn, the operating pumping rate . and can be selected so as to provide the fastest switching. Most of the BP should be covered and the DOP should be as close to M1 as possible (Fig. 3). There is a clear tradeoff between switching time and energy, as seen in the plots in Fig. 3. A similar tradeoff was recently observed in low-energy all-optical switching between transverse patterns in atomic vapor and semiconductor microresonators Transverse08 ; Transverse09 . Further increase of or moves the DOP away from M1, causing a slight growth of . Operating the laser beyond the minimum in may be useful to improve the reliability if system parameters vary due to fabrication disorder or environmental factors.
These optimization guidelines were used in the design of a proof-of-the principle memory cell for direct numerical simulations (Fig. 1). The choice of geometry (coupled defects in a PhC lattice) was based on state-of-the-art fabrication capabilities AtlasovOE . The active medium was modeled using 4-level laser rate equations coupled to a 2D finite-difference time-domain (FDTD) solver ourPSSMethods07 . Switching is effectuated by in-phase () and out-of-phase () quasi-monochromatic rectangular pulses with frequency delivered into the defects through PhC waveguides. Due to symmetry matching, these patterns couple to the bonding (M1) and the antibonding (M2) mode, respectively. The output radiation is extracted from another PhC waveguide (the “bus”). The signal for the two frequencies is determined as the across-the-bus flux of the Poynting vector obtained from coarse-graining Fourier transform of the fields at as where ps. This mimics the response of a spectrally selective time-resolving detector. The laser was pumped at 300 times threshold in order to assure bistable regime despite a considerable mismatch of the mode decay rates (), which is also the reason why and show different on-off contrast ourPRA09 .
Numerical simulations demonstrate switching between the two modes on the scale of several (less than 10) picoseconds (Fig. 1), with a decent qualitative agreement between FDTD and coupled-mode results. Analytical calculations tend to underestimate the switching times compared to numerics, both in this work and in earlier ones ourPRA09 ; ourPSSMethods07 . One possible reason may be due to the difference in laser system (4-level in FDTD vs. 2-level in analytics) but this remains a topic of further studies. The on-off contrast is at least 40 dB. To estimate the switching energy one should take into account that the energy transferred to a microstructure is a fraction of the externally delivered power. In such lasers, the operating absorbed power and is around 0.1–0.2. From the simulations, the cavity field enhancement factor was . Thus, for the estimation for the switching pulse energy is 15–30 fJ, comparable to the earlier accounts HillNature . It can be further reduced, e.g, using coupling optimization fanAPL09 . The storage time of the proposed device is theoretically infinite as long as the laser stays pumped and the in-cavity energy fluctuations remain smaller than .
The authors acknowledge helpful assistance of C. Kremers on numerical simulations. This work was supported in part by the Deutsche Fouschungsgemeinschaft (FOR 557).
References
- (1) H. Kawaguchi, IEEE J. Sel. Top. Quant. Electron. 3, 1254–1270 (1997).
- (2) Y. Liu, M. T. Hill, N. Calabretta, H. de Waardt, G. D. Khoe, and H. J. S. Dorren, IEEE Photon. Tech. Lett. 15, 1461–1463 (2003).
- (3) J. Oksanen and J. Tulkki, Appl. Phys. Lett. 88, 181118 (2006).
- (4) S. Osborne, K. Buckley, A. Amann, and S. O’Brien, Opt. Express 17, 6293–6300 (2009).
- (5) M. T. Hill, H. J. S. Dorren, T. de Vries, X. J. M. Leijtens, J. Hendrik den Besten, B. Smalbrugge, Y.-S. Oei, H. Binsma, G.-D. Khoe, and M. K. Smit, Nature 432, 206–209 (2004).
- (6) S. V. Zhukovsky, D. N. Chigrin, and J. Kroha, Phys. Rev. A 79, 033803 (2009).
- (7) S. V. Zhukovsky, D. N. Chigrin, A. V. Lavrinenko, and J. Kroha, Phys. Stat. Sol. B 244, 1211–1218 (2007).
- (8) S. V. Zhukovsky, D. N. Chigrin, A. V. Lavrinenko, and J. Kroha, Phys. Rev. Lett. 99, 073902 (2007).
- (9) K. A. Atlasov, K. F. Karlsson, E. Deichsel, A. Rudra, B. Dwir, and E. Kapon, Appl. Phys. Lett. 90, 153107 (2007).
- (10) P. Gallo, M. Felici, B. Dwir, K. A. Atlasov, K. F. Karlsson, A. Rudra, A. Mohan, G. Biasio, L. Sorba, and E. Kapon, Appl. Phys. Lett. 92, 263101 (2008)
- (11) K. A. Atlasov, K. F. Karlsson, A. Rudra, B. Dwir, and E. Kapon, Opt. Express 16, 16255–16264 (2008).
- (12) S. Vignolini, F. Intonti, M. Zani, F. Riboli, D. S. Wiersma, L. H. Li, L. Balet, M. Francardi, A. Gerardino, A. Fiore, and M. Gurioli, Appl. Phys. Lett. 94, 151103 (2009).
- (13) L. M. Narducci, J. R. Tredicce, L. A. Lugiato, N. B. Abraham, and D. K. Bandy, Phys. Rev. A 33, 1842–1854 (1986).
- (14) S. V. Zhukovsky and D. N. Chigrin, Phys. Stat. Sol. B 244, 3515–3527 (2007).
- (15) R. Kheradmand, M. Sahrai, H. Tajalli, G. Tissoni, and L. A. Lugiato, Eur. Phys. J. D 47, 107–112 (2008).
- (16) A. M. C. Dawes, D. J. Gauthier, S. Schumacher, N. H. Kwong, R. Binder, and A L. Smirl, Laser and Photon. Rev., DOI 10.1002/lpor.200810067 (2009).
- (17) C. R. Otey, M. L. Povinelli, and S. Fan, Appl. Phys. Lett. 94, 231109 (2009)