Molecular Gas Disk Structures around AGNs
Abstract
We present new high resolution numerical simulations of the interstellar medium (ISM) in a central parsecs region around a supermassive black hole () at a galactic center. Three-dimensional hydrodynamic modeling of the ISM (Wada & Norman 2002) with the nuclear starburst now includes tracking of the formation of molecular hydrogen (H) out of the neutral hydrogen phase as a function of the evolving ambient ISM conditions with a finer spatial resolution (0.125 pc). In a quasi equilibrium state, mass fraction of His about 0.4 (total Hmass is ) of the total gas mass for the uniform far UV (FUV) with in Habing unit. As shown in the previous model, the gas forms an inhomogeneous disk, whose scale-height becomes larger in the outer region. Hforms a thin nuclear disk in the inner , which is surrounded by molecular clouds swelled up toward . The velocity field of the disk is highly turbulent in the torus region, whose velocity dispersion is on average. Average supernova rate (SNR) of is large enough to energize these structures. Gas column densities toward the nucleus larger than are observed if the viewing angle is smaller than from the edge-on. However, the column densities are distributed over almost two orders of magnitude around the average for any given viewing angle due to the clumpy nature of the torus. For a stronger FUV (), the total Hmass in an equillibrium is only slightly smaller ( 0.35), a testimony to the strong self-shielding nature of H2, and the molecular gas is somewhat more concentrated in a mid-plane. Other properties of the ISM are not very sensitive either to the FUV intensity and the supernova rate. Finally the morphology and kinematics of the circumnuclear molecular gas disks emerging from our models is similar to that revealed by recent near infrared observations using VLTI/Keck.
Subject headings:
galaxies: Seyfert – galaxies: starburst – ISM: structure – ISM: molecules – method: numerical1. INTRODUCTION
Optically thick molecular materials have been postulated to unify various observational properties of active galactic nuclei (AGNs), especially the two major categories of the AGN, namely type-1 and type-2 (Antonucci, 1993). It is often assumed that the obscuration is caused by dusty molecular gas around a supermassive black hole (SMBH), whose geometry is schematically described as a doughnut-like ‘torus’ (e.g. Urry & Padovani, 1995). Its spatial extent and structures are deduced from comparison between observations in near/far infrared and theoretical spectral energy distributions (SED) based on radiative transfer calculations (e.g. Fritz, Franceschini, & Hatziminaoglou, 2006; Elitzur, 2008). Detailed three-dimensional radiative transfer calculations suggest that the torus should not be uniform but clumpy (Schartmann et al., 2008). In these model calculations, structures of the torus and its internal clumps are freely assumed, and then are tested in comparison with the observed SEDs. For example, the inner and outer edges of the torus are assumed typically as a sub-parsec and several tens of parcecs, respectively, and several hundred dense internal clumps are also assumed. It was then suggested that SEDs with the silicate absorption feature at 10 are mostly affected by the inner pc region of the torus (Schartmann et al., 2008).
Recently the dusty gas in the circum nuclear region are directly observed in some nearby Seyfert galaxies using interferometric mid-infrared observations. The prototypical type-2 Seyfert NGC 1068 harbors a warm (320 K) dust in a structure 3.4 pc in diameter and 2.1 pc in thickness (Jaffe et al., 2004). VLTI/MIDI survey of nearby AGNs with various types recently revealed that in the most objects AGN-heated dust is spatially compact ( a few pc)(Poncelet et al., 2006; Tristram et al., 2007; Meisenheimer et al., 2007; Tristram et al., 2009). These observations showed a structure of the hot dust and gas in a central few pc region, which may not necessarily encompass the whole structure of the molecular gas in the central region. Colder molecular gas probably extends further out, in 10 pc to sub-kpc regions. Indeed using line observations, Hsieh et al. (2008) revealed that the molecular gas in Seyfert 1 galaxy, NGC 1097, is concentrated in 175 pc, with an average density of the molecular hydrogen of . Central concentrations of high density gas around AGNs have been found via the observations of molecular lines with high critical densities such as ) (e.g. Kohno et al., 2003).
If such quantities of circumnuclear molecular gas are present, then star formation is naturally expected. In fact, there are many lines of evidence of circum nuclear starbursts in various types of AGNs and quasars (Cid Fernandes et al., 2004; Imanishi & Wada, 2004; Davies et al., 2007; Maiolino et al., 2007; Riffel et al., 2007; Watabe et al., 2008; Chen et al., 2009). Hicks et al. (2009) recently revealed structures of the ISM in local AGNs traced by line of molecular hydrogen at 2.1 using VLT/SINFONI. They found that the ISM whose scale is pc forms a rotating disk with a high velocity dispersion, and correlated with the star formation rate. The average gas mass is estimated to , with a column density of . They suggest that star formation occurs within a clumpy molecular gas phase. It has been observationally suggested that the starburst phenomena is linked with the nuclear activities (Watabe et al., 2008; Chen et al., 2009), and this connection was analytically studied based on a clumpy, turbulent accretion disk (Vollmer & Beckert, 2003; Vollmer et al., 2004; Kawakatu & Wada, 2008; Vollmer et al., 2008; Collin & Zahn, 2008).
In order to construct physical models of the obscuring material around a SMBH, influenced also by concomitant star formation, three-dimensional radiative magneto-hydrodynamic calculations with a sufficiently high resolution and a fairly large dynamic range (e.g. from 100 Schwarzschild radii to 100 pc) are ultimately necessary. However, until now, there are a few hydrodynamic studies in the central tens pc (Wada & Norman, 2002; Wada & Tomisaka, 2005; Yamada et al., 2007; Schartmann et al., 2009). Wada & Norman (2002) (hereafter WN02) investigated evolution of the ISM in the inner 100 pc region around a SMBH using three-dimensional Euler-grid hydrodynamic simulations, taking into account self-gravity of the gas, radiative cooling and heating due to supernovae. They found that a clumpy torus-like structure is naturally reproduced on a scale of tens pc around a SMBH. The internal density, temperature are highly inhomogeneous, and the velocity field is turbulent, but the global geometry, i.e. a flared thick disk, is quasi-stable, implying that energy input from supernovae is balanced with turbulent dissipation. They suggested that AGNs could be obscured by the surrounding interstellar material. These results support observational findings that some AGNs are obscured by nuclear starbursts (Levenson, Weaver, & Heckman, 2001; Levenson et al., 2007; Ballantyne, 2008, and references therein). However, the models in WN02 are not necessarily applicable to all circumnuclear regions with active star formation, because 1) the assumed supernova rate is extremely high (), which would be appropriate only for intense starburst, like ultra-luminous infrared galaxies, but not to standard circum nuclear starbursts (e.g. Hicks et al., 2009), and 2) the cold, dense gas in their simulations does not necessary represent the dusty molecular gas phase around an AGN, because Hformation and its radiative destruction by far ultra-violet radiation (FUV) from massive stars and collisional destruction are not included. As a result, the radiative cooling in WN02 is not consistent with the chemical abundances in the low temperature medium.
Including the molecular gas in numerical models will eventually yield a much richer interface with current and future observations. This is because unlike the dust continuum, the effectively optically thin molecular line emission (even large line-center optical depths allow full view of turbulent media), is a direct probe of the velocity fields and thus of the gaseous disk dynamics, unobscured by the concomitant dust. The upcoming commissioning of ALMA will drastically enlarge such an interface by enabling the imaging of a whole suite of molecular lines probing different density and temperature regimes at high angular resolution. However from the results of WN02 it is still unclear how the various density regimes of the H2 gas would be distributed in the circumnuclear region, and what would influence its structures. We hereby extend the three-dimensional hydrodynamic simulations of WN02 to explicitly track the evolution of the Hphase in the central pc region, and its interplay with the HI phase, with a 0.125 pc resolution (cf. 0.25 pc in WN02). We also vary the strength of the uniform FUV field and the supernova rate (SNR) in order to examine their effect on the structures of molecular gas.
2. NUMERICAL METHOD AND MODELS
2.1. Numerical Methods
We use a numerical scheme based on Eulerian hydrodynamics with a uniform grid, which is the same as those described in Wada & Norman (2001); Wada (2001). Here we briefly summarize them. We solve the following equations numerically to simulate the three-dimensional evolution of a rotating gas disk in a fixed spherical gravitational potential.
| (1) | |||||
| (2) | |||||
| (3) | |||||
| (4) |
where, the specific total energy , with . We assume a time-independent external potential , where pc, kpc, km s-1, km s-1, and , where and pc. See Fig. 1 for the rotation curve based on the external potentials and . Observationally it is hard to determine exact rotation curves in the central 100 pc region of external galaxies, the adopted mass distribution with a core radius of 100 pc is roughly consistent with the rotation curves around nearby Seyfert nuclei observed by VLTI/Keck (Hicks et al., 2009). CO(1-0) observations of the central region of nearby spiral galaxies also show that their rotation curves are steep in the central part, suggesting central massive components (Sofue et al., 1999). This could correspond to the stellar cores found by HST/NICMOS in nearby galaxies (Carollo et al., 2002). The potential caused by the BH is smoothed inside pc by introducing a ‘softening’ parameter , in order to avoid too small time steps around the BH. This softening does not change the rotation curve in the range shown in Fig. 1, but we should not rely on the gas dynamics and structures at pc. In the central grid cells at pc, physical quantities stay constant to represent a sink cell.
The hydrodynamic part of the basic equations is solved by AUSM (Advection Upstream Splitting Method)(Liou & Steffen, 1993; Wada & Norman, 2001). We use grid points in high resolution models and grid points in low resolution models to investigate long term evolution with different parameters111In the high resolution models, a calculation for 4.5 Myr requires about 180 CPU hours using 16 CPUs of NEC SX-9 whose peak performance is about 1.6 TFlops.. Cartesian grid points cover a pc3 region around the galactic center (i.e. the spatial resolution is 0.125 pc in the high-resolution runs and 0.25 pc for the low resolution runs). The Poission equation, eqn. (4) is solved to calculate the self-gravity of the gas using the Fast Fourier Transform and the convolution method, where grid points and a periodic Green’s function is used to calculate the potential of an isolated system (Hockney & Eastwood, 1981).
An essential progress in the present calculations compared to WN02 is that we now solve non-equilibrium chemistry of hydrogen molecules along with the hydrodynamics. Formation of Hon dust and its radiative and collisional destruction are explicitly tracked, therefore we can deduce the distribution of Hin the central tens pc region. See details in Appendix A.
In the energy equation (eq. (3)), we use a cooling function based on a radiative transfer model of photo-dissociation regions (Meijerink & Spaans, 2005), assuming solar metallicity, which is a function of the molecular gas fraction and intensity of FUV, (see Appendix B for the detail). The radiative cooling rate below is self-consistently modified depending on , which is determined in each grid cell. We adopt heating due to the photoelectric effect, and energy feedback from type-II SNe (see below), . We assume a uniform UV radiation field, whose strength is an important parameter in the model, represented by the Habing unit (), the incident FUV field normalized to the local interstellar value.
2.2. Initial conditions and Model parameters
The initial condition is an axisymmetric and rotationally supported thin disk with a uniform density profile (thickness is 2.5 pc) and a total gas mass of . Since we allow outflows from the computational boundaries, the total gas mass decreases during the evolution, and it settles to at a quasi-equilibrium state. Random density fluctuations, which are less than 1 % of the unperturbed values, are added to the initial gas disk. A uniform disk with pc-3 at is evolved for Myr (the rotational period at is about 0.2 Myr) using grid points (i.e. spatial resolution is 0.25 pc), then it continues to higher resolution runs with grid points. The system settles into a quasi-equilibrium state, where the total molecular gas mass is nearly constant, after Myr (see §3.2 and Fig. 6).
Since the current integration time is short ( Myr) due to a limitation of our computational resources, instead of tracking the whole life of massive stars, here we assume that supernova (SN) explosions occur at random positions with a constant rate in the region confined by pc and pc. Here we effectively assumed that massive, cold molecular gases from which stars formed are not distributed spherically, but they are rather concentrated in a disk with a small scale height. Therefore we expect that supernova explosions mostly occur near the disk plane.
The average SN rate (SNR) is one of the free parameters in the present study. Observationally there is a large ambiguity in the star forming activities around AGNs. the star formation rate (SFR) around AGNs was suggested to several tens (Davies et al., 2007). For the Salpeter initial mass function (IMF) and stellar mass rage of 0.1-125 , type-II supernova rate is SFR, and a corresponding supernova rate per unit area would be . For the circumnuclear disk of pc in the present model, this rate suggest that . On the other hand, using the scaling relation on the star formation rate in galactic disks and in starbursts (Kennicutt, 1998), the initial gas density in the present model yields . We here change the supernova rate from 5.4 to 540 . For each type-II supernova explosion, the energy of ergs as thermal energy and gas mass 8 are instantaneously injected into a single cell. Note that since we set a maximum temperature of K, not all the injected thermal energy is used to create blast waves. Three dimensional evolution of blast waves caused by SNe in an inhomogeneous and non-stationary medium with global rotation are followed explicitly, taking into account the radiative cooling, which makes the evolution of the supernova remnants depending on the local gas density distribution around the SNe.
We here assume a spatially uniform FUV field with and 100. For a photo-dissociation region (PDR) surrounding an HII region, (e.g. Tielens, 2005). For the star formation rate , which is a typical rate in starburst galaxies, the luminosity of massive stars formed for yr that contribute to the FUV field is roughly . If we assume that the massive stars are embedded in the uniform gas disk with , contribution from local ( a few pc) stars is important. Then the average local FUV field in a grid cell of 0.1 pc would be . On the other hand, an AGN would have a negligible effect on the FUV field in the most regions, because the average column density through the initial thin disk is for . However, as we will see in §3, the star forming disk in a quasi-equilibrium state is highly inhomogeneous, especially in the outer region (). Therefore, could be several for the low column density regions () at pc from a typical AGN with luminosity . In reality, both the density field and distribution of massive stars are not uniform, and should have a large dispersion with some radial dependence. Effect of the non-uniform radiation field will be an important subject to solve by three-dimensional radiative transfer calculations in the future.
Beside the FUV, the X-ray radiation from the AGN would be important for the thermal and chemical structures of the ISM around an AGN (Maloney et al., 1996; Meijerink et al., 2007). This will be discussed in §5.
Model parameters are summarized in Table 1. For simplicity, we here assume that the FUV intensity and SNR are independent free parameters. In reality those quantities are tied to the ambient star formation rate density, which in turn is regulated by the Hgas density since stars always form out of the Hgas. It is therefore expected that FUV, SNR and Hgas mass fraction evolve in a highly coupled manner, leading perhaps towards a self-regulating, quasi-stationary state. This important issue can only be explored if a SF-regulating Hgas distribution is included in the ISM+stars model, and we intend to do so in a future paper.
| Model | [pc] | SNR [ yr-1] | |
|---|---|---|---|
| H10a | 10 | 0.125 | 5.4 |
| L10a | 10 | 0.25 | 5.4 |
| H100a | 100 | 0.125 | 5.4 |
| L100a | 100 | 0.25 | 5.4 |
| L100b | 100 | 0.25 | 54.0 |
| L100b* | 100 | 0.25 | 54.0 |
| L100c | 100 | 0.25 | 540.0 |

3. RESULTS
3.1. Structures of a fiducial model
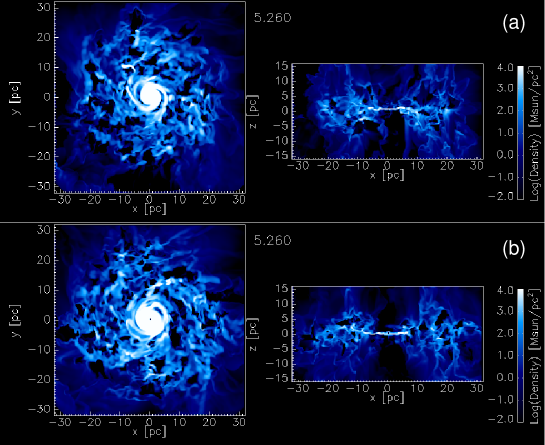
In a quasi-steady state (), as reported by WN02, the gas forms a highly inhomogeneous, flared disk, as seen in Fig. 2, which shows gas density, temperature and molecular hydrogen density in model H100a at Myr. The temperature map shows that cold ( K) gas is mainly distributed in the high density regions. In the central funnel-like cavity, the temperature of the gas is hot ( K). Hot gases are also patchily distributed in the cold, flared disk. Typical size of these hot cavities is a few pc. A large fraction of the volume is occupied by warm gas ( K). As expected distribution of Hroughly follows the cold, dense gas, and therefore it forms a high density circum nuclear disk whose radius is about 5 pc, surrounded by a porous torus which extends to pc above the disk plane.
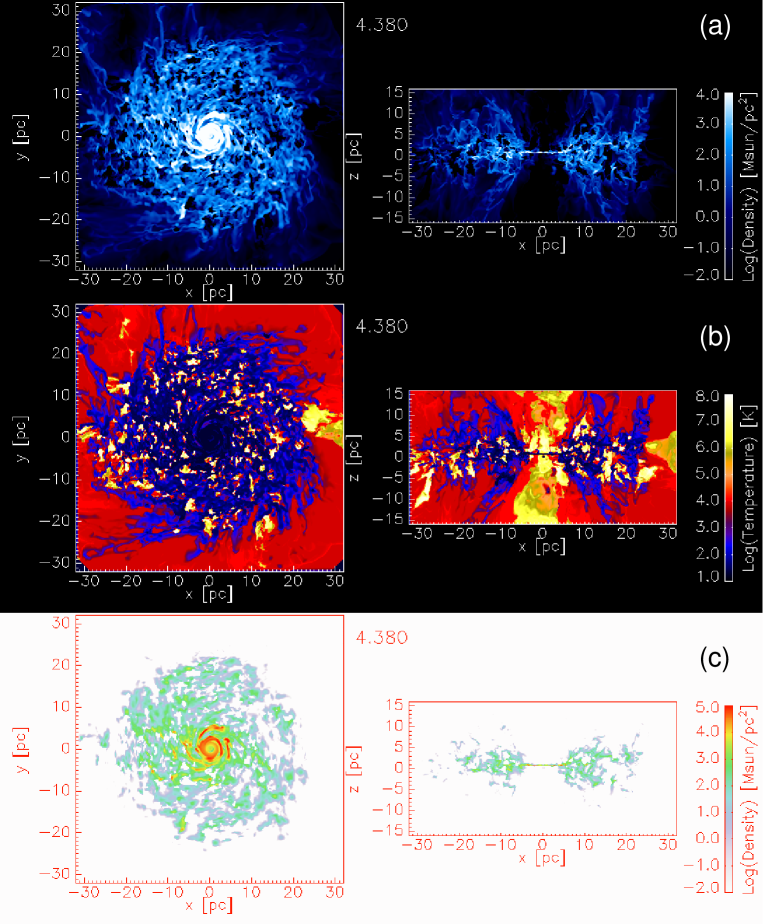
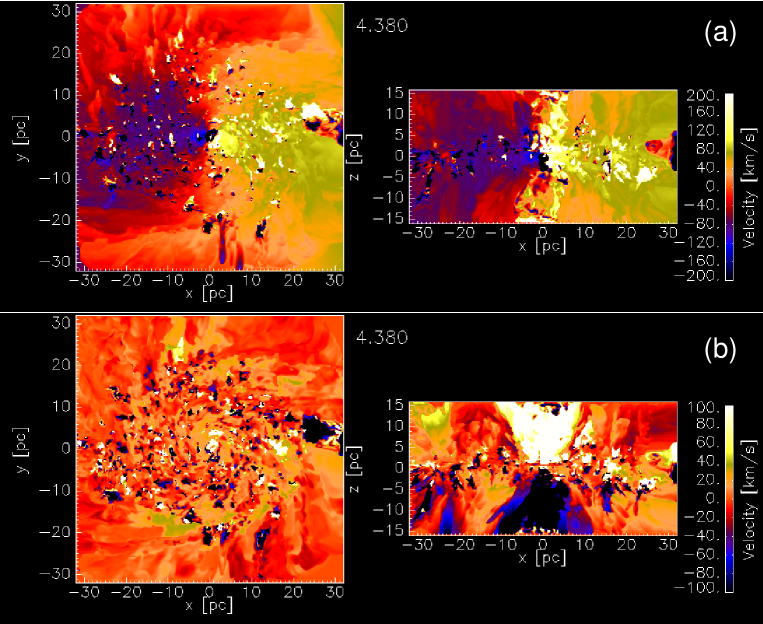
Figure 3 shows velocity fields of two components ( and ) at the same snapshot of Fig. 2. The torus shows a global rotation, but there are also large internal random motions. This complicated velocity field is naturally expected in an inhomogeneous, self-gravitating disk (Wada, Meurer, & Norman, 2002), but the vertical motions are mainly enhanced by energy input from supernovae (see also Fig. 8). The vertical velocity field also shows a bipolar outflow in the central funnel, which is mostly warm and hot gases as seen in Fig. 2b.
In Figs. 4a and 4b, we plot total column density () and Hcolumn density () toward the galactic center as a function of the viewing angle in model H10a. It clearly shows that the total gas and Hcolumn densities are both largest at (i.e. edge-on), and the average column density decreases on average towards the pole-on view as expected. We should note, however that the scatter around the average is two orders of magnitude or more for any viewing angles, which is comparable to the change of the average value between and . Figure 4b shows His distributed similary, but it is more concentrated near the disk plane. The scatter of is more significant than that in especially for , reflecting that Hgas is highly inhomogeneous and more sparsely distributed in larger latitudes.

3.2. Dependence of Model Parameters
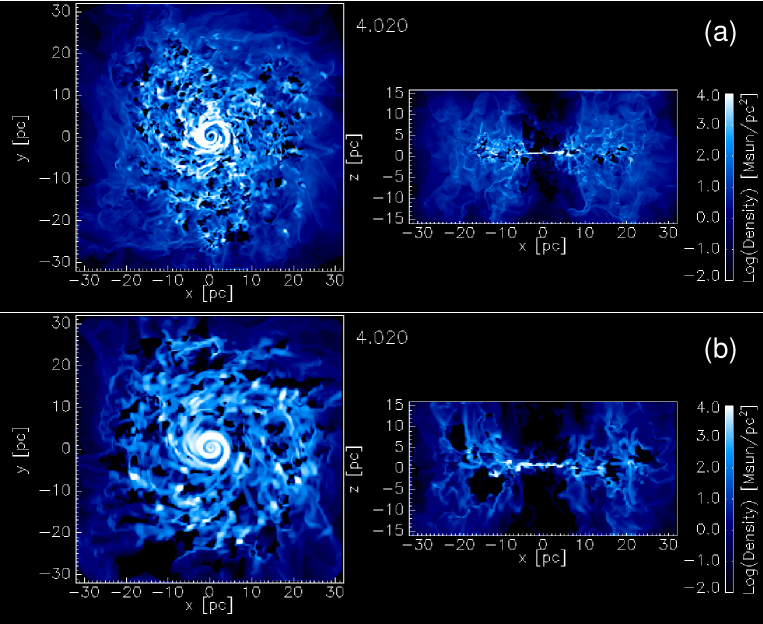
Figure 5 shows density distributions of models with two resolutions, H100a ( pc) and L100a ( pc) at Myr. The inhomogeneous density fields and global morphology of the thick disk in the two models are qualitatively similar, but clumpy structures are finer in the high resolution model, H100a than in L100a. In Fig. 6 evolution of molecular gas fractions, in five models are shown. The molecular gas fraction in H10a rapidly decreases from to in the first Myr, then it increases and slightly oscillates around . The model with ten times stronger FUV (H100a) shows a similar time evolution, with only about 10% smaller than in model H10a. In order to see a longer term evolution, we restart calculations from a snapshot of the high resolution data at Myr with a lower resolution (i.e. 0.25 pc)222The computational time in the high resolution run is about 16 times longer than that in the low resolution runs.. The low resolution run (L10a) shows rapid decrease of in the first Myr, reverses to an increase at Myr, and then settles around after Myr in L10a as in H10a. Molecular fraction of L100a in the quasi-equilibrium state is . These results suggest that for a given supernova rate and the FUV intensity there is an equilibrium Hfraction which does not significantly depend neither on the numerical resolution nor on the initial state. For stronger FUV fields, His less abundant, but this is not very sensitive to because of the effective H2 self-shielding against far-UV dissociation. In the low resolution runs, we change energy input rate due to the supernova rate by a factor of 100 (see Table 1). As seen in Fig. 6, L100a and L100c show similar evolution, but the molecular fraction is only slightly smaller in the model with 100 times larger supernova rate.

Figure 7 shows column density distribution of Hin models H10a and H100a at Myr. The dependence of on the viewing angles are similar in the two models, but in H100a, Hmore rapidly decreases toward high latitudes. This is naturally expected because His mainly formed in the dense regions, which are concentrated near the disk plane. Strong FUV can easily dissociate Hin the relatively diffuse regions at high latitudes. However, those differences in the two models are not significant. Even in the strong FUV model, His inhomogeneously distributed in the central tens pc.

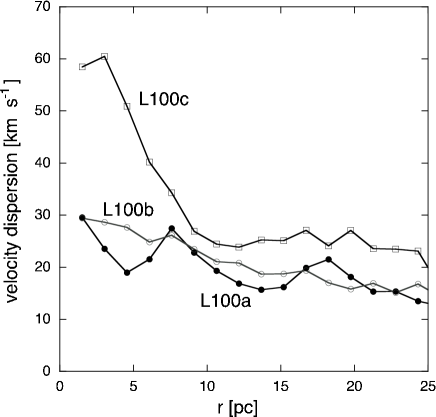
We compare vertical velocity dispersion of the gas below K in three models (L100a, L100b, and L100c) with different supernova rates in Figure 8. It shows that velocity dispersion tends to increase with higher supernova rate. However its dependence in the torus region is less than factor of two when the supernova rate is 100 times larger. The effect is more significant in the inner region, where there is a bipolar outflow from the central funnel (Fig. 3).
4. DISCUSSION
4.1. Comparison with Observations
Hicks et al. (2009) recently revealed structures of the ISM in local AGNs traced by a line of molecular hydrogen at 2.1 using the near-infrared field spectrograph SINFONI at ESO Very Large Telescope and OSIRIS at Keck Observatory. They found that ISM with a radius of pc forms a rotating disk with a high velocity dispersion (several tens km s-1), and suggested that star formation is concomitant with clumpy molecular gas. The average gas mass is estimated to , assuming a 10% mass fraction to the dynamical mass. The size, mass and dynamics of these nuclear molecular gas disk around AGNs are very similar to what we found here. The turbulent-like velocity field revealed by their observations qualitatively resembles to those seen in our models (Fig. 3). They also suggest a positive correlation between the velocity dispersion of the hot molecular gas and the star formation rate, which is consistent with our result (Fig. 8), and it is reasonable if turbulent velocity is energized by supernovae and balanced by gas dissipation (WN02). Although is emitted from warm gas, it is expected from our simulations that the cold molecular gas have also similar random velocity field.
Hsieh et al. (2008) observed a Seyfert 1 galaxy, NGC 1097 using by the Submillimeter Array at angular resolution of (290 pc 220 pc), and deduced a total mass of molecular hydrogen of , with column densities , and . They suggest a clumpy disk configuration to explain inconsistency between the large column density suggested by their observations and two orders of magnitude smaller column density ( cm-2) suggested by X-ray observations (Terashima et al., 2002). If the nucleus of this galaxy surrounded by a torus consisted of high density, small gas clumps, it would be possible to observe the broad line region through gaps between the clumps. On the other hand, the Hcolumn density represents an average one in the large beam size ( 250 pc), which should be much larger than than the value suggested by X-ray observations. Could this be the case in the clumpy Hin our results? The ratio is in NGC 1097. Among our models, model H10a, in which the moderate star forming activity is assumed ( and SNR yr-1), would be appropriate for comparison. If one supposes that the Hcolumn density inferred from the CO line observations represents an average column density of all the molecular gas present in the central several tens parsecs (), and column density of H suggested by X-ray reflects the amount of material along the line-of-sight (its viewing angle is ) for the nucleus (). In Fig. 9, we plot in model H10a at Myr. It is clear that we have smaller chances to observe small if the line of sight is closer to the edge-on. can be achieved for deg or larger. One should note again that the scatter of the ratio is significant for any given viewing angles, and it also depends on the structure of molecular gas around the nucleus. It is therefore hard to conclude at this moment on structures of the circumnuclear region of NGC 1097. Future observations of AGNs using CO or other lines with much higher resolutions, at least with a few pc beam, by for example ALMA are necessary.

Jaffe et al. (2004) observed the central region of NGC 1068 by the Very Large Telescope Interferometer (VLTI), and suggested a dusty “torus” of thickness 2.1 pc, diameter 3.4 pc, and temperature of . This could correspond to the central, relatively smooth molecular dense disk typically seen in our models (Fig. 2). Due to the strong gravity and shear caused by the central BH, it is natural that molecular gas forms a thin, smooth disk in the central few pc. However, if the observed central disk of NGC 1068 is geometrically thick, a strong heating source, e.g. infrared radiation would be necessary (Pier & Krolik, 1993; Krolik, 2007). Tristram et al. (2007) suggested a clumpy torus plus a central thick disk model from mid-IR observations using VLTI of Circinus, which has a Seyfert 2 nucleus. Although the size is smaller ( pc), the geometry and structures suggested by their high resolution observations (see a schematic picture in their Fig. 9) is quite similar to the models presented here.
4.2. Effects of X-rays
The strong X-ray continuum emanating from the AGN could affect the chemical state of the ISM in the central region (Maloney et al., 1996; Meijerink et al., 2007). It is known that the chemical state of the X-ray Dissociated Region (XDR) is mainly determined by , where is a X-ray heating deposition rate and is the number density of the gas (Maloney et al., 1996). Although we do not include the effect of X-ray from the nucleus, here we estimate its potential effect using one of our models. In Fig. 10, we plot a fraction of Hand temperature as a function of at randomly selected points in the computational box. Here we assume that the X-ray luminosity of the AGN is . Although there is a large scatter, for or smaller the molecule fraction increases significantly and the temperature in most regions is less than 100 K. At high gas densities (), large () Hfractions can be sustained for the range of values, limiting the impact of XDR effects (Meijerink et al., 2007). This is partly because the free electrons associated with ionization processes help to form Hthrough the route and also because Hformation scales with density squared. Still, for significantly larger than , gas is mostly atomic as expected (Maloney et al. 1996).
These results suggest that XDR chemistry may change distribution of Haround an AGN, if we explicitly include X-ray from the nucleus in the following sense. The Habundance is indeed robust in a clumpy medium, but the XDR gas temperature should rise relative to the PDR case by a factor of for (Meijerink et al., 2007). After all, X-ray ionization heating with for example , is more efficient than photo-electric emission by dust grains, therefore Hgas would have higher temperatures. This leads to stronger emission in the pure rotational Hlines, like e.g. , at 28m, 17m. Similar considerations hold for CO (Spaans & Meijerink, 2008). Shocks can heat as well, therefore observational data on line profile kinematics would be useful in the future.


4.3. A self-regulated Hand the star formation rate
In the present results it is notable that although the assumed FUV and supernova rate differ by orders of magnitude among the models, total molecular gas fraction settle between . There is a weak ‘negative’ feedback of FUV and supernovae on the star formation in the central region. This suggests that the molecular gas disk could survive around AGNs associated with a starburst. Since the negative feedback of FUV and supernova rate on Hmass is ‘weak’, it is also implied that if there is an episodic large mass inflow into the circum nuclear region, we expect a burst of star formation, because star formation rate depends on Hdensity. This could also affect the mass accretion rate toward the AGN via turbulent viscosity (Kawakatu & Wada, 2008). To explore these mechanisms, the star formation, the radiative feedback from the AGN/stars affecting H(the star formation fuel), and a coupled SNR should be self-consistently followed (e.g. Wada, 2008) for at least several tens Myr. These effects, along with incorporating the H-tracing CO molecule, will be investigated in a future paper.
4.4. Positions of supernovae
Finally, effect of position of supernovae on the gas density distribution is compared between L100b and L100b* (Fig. 11). As explained in §2.2, we assumed that SN explosions occur at random positions with a constant rate in the region confined by pc. This is justified by the results that His more concentrated in the disk plane. However, orbits of massive stars formed near the disk plane could have large inclination angles, as a result, energy from supernovae could be released at higher latitudes. In model L100b*, supernovae are assumed to be exploded in pc (Fig. 11b), but we do not see significant differences in the distribution of gas around AGNs.
5. CONCLUSIONS
We present new high resolution numerical simulations of the interstellar medium (ISM) in a central pc region around a supermassive black hole () at a galactic center. Three-dimensional hydrodynamic modeling of the ISM (Wada & Norman 2002) along with a concomitant starburst now includes tracking of the formation of molecular hydrogen (H) out of the neutral hydrogen phase as a function of the evolving ambient ISM conditions with a finer spatial resolution (0.125 pc). Radiative cooling rate is self-consistently changed depending on abundance of Hin each grid cell. In a quasi equilibrium state, mass fraction of His about 0.4 (total Hmass is ) of the total gas mass for the uniform far UV (FUV) with in Habing unit. As shown in the previous model, the gas forms an inhomogeneous disk, whose scale-height becomes larger in the outer region. Hforms a thin disk in the inner , and it is clumpy and swelled up toward . The velocity field of the disk is highly turbulent in the torus region. Outflow of the gas forms a hot ( K) funnel in the inner region. These structures and dynamics are energized by supernovae with average supernova rate (SNR) of . Gas column densities toward the nucleus larger than are found if the viewing angle is smaller than from the edge-on. However, the column densities are distributed over almost two orders of magnitude around the average for any given viewing angle due to the clumpy nature of the torus. The column density of Hshows a similar distribution, and is achieved for . For stronger FUV (), the total Hmass in an equilibrium is only a little smaller ( 0.35) and the molecular gas is slightly more concentrated in a plane, while other properties of the ISM are also not very sensitive to the FUV intensity and supernova rate. Vertical velocity dispersion of the gas in the torus ( on average) is enhanced only by a factor of 1.5 for increasing the supernova rate by two orders of magnitude.
The structure and dynamics of these nuclear molecular disk presented here are very similar to molecular gas disk in various types of nearby AGNs recently revealed by ro-vibration line of Husing VLTI/SINFONI and Keck/OSIRIS (Hicks et al., 2009). The inconsistency on column density toward the center in NGC 1097 between the large column density suggested by CO observations (Hsieh et al., 2008) and X-ray (Terashima et al., 2002) could be attributed to the inhomogeneous structures emerging from the hereby presented disk models.
Finally, in the present results it is notable that although the assumed FUV and supernova rate may differ by orders of magnitude among the models, the total molecular gas fraction settles between . This weak ‘negative’ feedback from FUV and supernovae on the star formation in the central region, suggests that substantial molecular gas disks can survive around AGNs with strong ongoing star formation.
References
- Antonucci (1993) Antonucci, R. 1993, ARA&A, 31, 473
- Ballantyne (2008) Ballantyne, D. R. 2008, ApJ, 685, 787
- Buch & Zhang (1991) Buch, V. & Zhang, Q. 1991, ApJ, 379, 647
- Cazaux & Spaans (2009) Cazaux, S., & Spaans, M. 2009, A&A, 496, 365
- Carollo et al. (2002) Carollo, C. M., Stiavelli, M., Seigar, M., de Zeeuw, P. T., & Dejonghe, H. 2002, AJ, 123, 159
- Cid Fernandes et al. (2004) Cid Fernandes, R., Gu, Q., Melnick, J., Terlevich, E., Terlevich, R., Kunth, D., Rodrigues Lacerda, R., & Joguet, B. 2004, MNRAS, 355, 273
- Chen et al. (2009) Chen, Y.-M., Wang, J.-M., Yan, C.-S., Hu, C., & Zhang, S. 2009, ApJ, 695, L130
- Chieze & Pineau Des Forets (1987) Chieze, J.-P., & Pineau Des Forets, G. 1987, A&A, 183, 98
- Collin & Zahn (2008) Collin, S., & Zahn, J.-P. 2008, A&A, 477, 419
- Elmegreen (1989) Elmegreen, B. G. 1989, ApJ, 338, 178
- Draine & Bertoldi (1996) Draine, B. T., & Bertoldi, F. 1996, ApJ, 468, 269
- Davies et al. (2007) Davies, R. I., Sánchez, F. M., Genzel, R., Tacconi, L. J., Hicks, E. K. S., Friedrich, S., & Sternberg, A. 2007, ApJ, 671, 1388
- Elitzur (2008) Elitzur, M. 2008, New Astronomy Review, 52, 274
- Fritz, Franceschini, & Hatziminaoglou (2006) Fritz, J., Franceschini, A., & Hatziminaoglou, E. 2006, MNRAS, 366, 767
- Glover & Mac Low (2007) Glover, S. C. O., & Mac Low, M.-M. 2007, ApJ, 659, 1317
- Hsieh et al. (2008) Hsieh, P.-Y., Matsushita, S., Lim, J., Kohno, K., & Sawada-Satoh, S. 2008, ApJ, 683, 70
- Heyer& Brunt (2004) Heyer, M. H., & Brunt, C. M. 2004, ApJ, 615, L45
- Hicks et al. (2009) Hicks, E. K. S., Davies, R. I., Malkan, M. A., Genzel, R., Tacconi, L. J., Sánchez, F. M., & Sternberg, A. 2009, ApJ, 696, 448
- Hockney & Eastwood (1981) Hockney, R. W., Eastwood, J. W. 1981, Computer Simulation Using Particles (New York : McGraw Hill)
- Imanishi et al. (2009) Imanishi, M., Nakanishi, K., Tamura, Y., & Peng, C.-H. 2009, AJ, 137, 3581
- Imanishi & Wada (2004) Imanishi, M., & Wada, K. 2004, ApJ, 617, 214
- Jaffe et al. (2004) Jaffe, W., et al. 2004, Nature, 429, 47
- Jura (1975) Jura, M. 1975, ApJ, 197, 581
- Kennicutt (1998) Kennicutt, R., 1998, ApJ, 498, 541
- Kawakatu & Wada (2008) Kawakatu, N., & Wada, K. 2008, ApJ, 681, 73
- Kohno et al. (2003) Kohno, K., Ishizuki, S., Matsushita, S., Vila-Vilaró, B., & Kawabe, R. 2003, PASJ, 55, L1
- Krolik (2007) Krolik, J. H. 2007, ApJ, 661, 52
- Larson (1981) Larson, R. B. 1981, MNRAS, 194, 809
- Levenson, Weaver, & Heckman (2001) Levenson, N. A., Weaver, K. A., & Heckman, T. M. 2001, ApJ, 550, 230
- Levenson et al. (2007) Levenson, N. A., Sirocky, M. M., Hao, L., Spoon, H. W. W., Marshall, J. A., Elitzur, M., & Houck, J. R. 2007, ApJ, 654, L45
- Liou & Steffen (1993) Liou, M., Steffen, C., 1993, J.Comp.Phys., 107,23
- Maiolino et al. (2007) Maiolino, R., Shemmer, O., Imanishi, M., Netzer, H., Oliva, E., Lutz, D., & Sturm, E. 2007, A&A, 468, 979
- Maloney et al. (1996) Maloney, P. R., Hollenbach, D. J., & Tielens, A. G. G. M. 1996, ApJ, 466, 561
- Martin et al. (1998) Martin, P. G., Keogh, W. J., & Mandy, M. E. 1998, ApJ, 499, 793
- Meijerink et al. (2007) Meijerink, R., Spaans, M., & Israel, F. P. 2007, A&A, 461, 793
- Meijerink & Spaans (2005) Meijerink, R., & Spaans, M. 2005, A&A, 436, 397
- Meisenheimer et al. (2007) Meisenheimer, K., et al. 2007, A&A, 471, 453
- Poelman & Spaans (2005) Poelman, D. R., & Spaans, M. 2005, A&A, 440, 559
- Papadopoulos et al. (2002) Papadopoulos, P. P., Thi, W.-F., & Viti, S. 2002, ApJ, 579, 270
- Pelupessy et al. (2006) Pelupessy, F. I., Papadopoulos, P. P., & van der Werf, P. 2006, ApJ, 645, 1024
- Pier & Krolik (1993) Pier, E. A., & Krolik, J. H. 1993, ApJ, 418, 673
- Poncelet et al. (2006) Poncelet, A., Perrin, G., & Sol, H. 2006, A&A, 450, 483
- Riffel et al. (2007) Riffel, R., Pastoriza, M. G., Rodríguez-Ardila, A., & Maraston, C. 2007, ApJ, 659, L103
- Schartmann et al. (2009) Schartmann, M., Meisenheimer, K., Klahr, H., Camenzind, M., Wolf, S., & Henning, T. 2009, MNRAS, 393, 759
- Schartmann et al. (2008) Schartmann, M., Meisenheimer, K., Camenzind, M., Wolf, S., Tristram, K. R. W., & Henning, T. 2008, A&A, 482, 67
- Sofue et al. (1999) Sofue, Y., Tutui, Y., Honma, M., Tomita, A., Takamiya, T., Koda, J., & Takeda, Y. 1999, ApJ, 523, 136
- Spaans & Meijerink (2008) Spaans, M., & Meijerink, R. 2008, ApJ, 678, L5
- Terashima et al. (2002) Terashima, Y., Iyomoto, N., Ho, L. C., & Ptak, A. F. 2002, ApJS, 139, 1
- Tristram et al. (2007) Tristram, K. R. W., et al. 2007, A&A, 474, 837
- Tristram et al. (2009) Tristram, K. R. W., et al. 2009, arXiv:0903.4892
- Tielens (2005) Tielens, A.G.G.M., “The Physics and Chemistry of the Interstellar Medium”, Cambridge university press, Cambridge, 2005, p. 319
- Urry & Padovani (1995) Urry, C. M., & Padovani, P. 1995, PASP, 107, 803
- Vollmer et al. (2008) Vollmer, B., Beckert, T., & Davies, R. I. 2008, A&A, 491, 441
- Vollmer et al. (2004) Vollmer, B., Beckert, T., & Duschl, W. J. 2004, A&A, 413, 949
- Vollmer & Beckert (2003) Vollmer, B., & Beckert, T. 2003, A&A, 404, 21
- Wada (2001) Wada, K. 2001, ApJ, 559, L41
- Wada (2008) Wada, K. 2008, ApJ, 675, 188
- Wada & Norman (2001) Wada, K. & Norman, C. A. 2001, ApJ, 547, 172
- Wada & Norman (2002) Wada, K. & Norman, C. A. 2002, ApJ, 566, L21 (WN02)
- Wada & Tomisaka (2005) Wada, K. & Tomisaka, K. 2005, ApJ, 619, 93
- Wada, Meurer, & Norman (2002) Wada, K., Meurer, G., & Norman, C. A. 2002, ApJ, 577, 197
- Watabe et al. (2008) Watabe, Y., Kawakatu, N., & Imanishi, M. 2008, ApJ, 677, 895
- Wolfire et al. (2003) Wolfire, M. G., McKee, C. F., Hollenbach, D., & Tielens, A. G. G. M. 2003, ApJ, 587, 278
- Yamada et al. (2007) Yamada, M., Wada, K., & Tomisaka, K. 2007, ApJ, 671, 73
Appendix A Numerical recipe of Hformation and destruction
Abundance of hydrogen molecule of each hydrodynamic grid-cell (0.125 or 0.25 pc) at a given time step is determined by the following time-dependent approach coupled with hydrodynamic equations. In this approach Hand HI are assumed fully mixed within “cells” of typical radius whose choice is motivated by the ISM physics, while it remains unresolved by the simulation during the course of the thermodynamic and dynamic evolution of the gas. This allows a smooth treatment of the HI-Hmass exchange in both the Cold Neutral Medium (CNM) and Warm Neutral Medium (WNM) phases, with all factors now incorporated in a single equation, namely
| (A1) | |||||
The factor is the unshielded FUV-induced Hdissociation rate, is the FUV radiation field in Habing units (), is the FUV optical depth, (: neutral hydrogen density, : Hdensity), and , are the H-Hand H-Hcollisional destruction rates of Hfor gas temperature that can be fitted using data from Martin et al. (1998). The function is the Hformation factor. We set (Jura, 1975; Pelupessy et al., 2006) for K, otherwise . The factor represents obsevational uncertainties in the Hformation rate, with the canonical value (Jura, 1975) corresponding to , but values up to are possible (see Papadopoulos et al., 2002). Here we adopt , since this seems more probable form ISO studies of Galactic Photodissociation regions (Papadopoulos et al., 2002, and references therein). The function quantifies the sticking probability of an H atom on a grain, which we set to unity for most of the modeling done in this work (the Hformation probability after sticking is considered unity throughout). We only test the case of where which was obtained by Buch & Zhang (1991), and is thought to be good for dust grains in general, as long as they are covered by a few layers of weakly bonded material.
The function denotes the Hself-shielding factor, with being the Hcolumn density, and
| (A2) | |||||
where =3/4 (see Draine & Bertoldi (1996)).
If we integrate eq. (A1) over the volume of the cell, while assuming negligible dust absorption within it () we obtain,
| (A3) | |||||
where the factor ( is a cloud radius) is
| (A4) | |||||
| (A5) | |||||
| (A6) |
and for results to . Unlike Pelupessy et al. (2006), the description of the HI-Hgas mass exchange here does not involve the density-size power law. It utilizes only the much better established line-width-size scaling law found for molecular clouds (Heyer& Brunt, 2004), and used here to define the “cell” size (A.7) within which HI and Hare assumed fully mixed. Aside from the much smoother implementation of the Hformation and destruction mechanisms that this allows, it yields a treatment that remains suitable for a gas phase that may not follow both scaling relations (i.e. diffuse and non self-gravitating gas).
The assumption of a typical HI-Hmixing sub-grid “cell” where Hformation and dissociation takes places in full concomitance with HI greatly simplifies the problem of tracking the HIHgas phase exchange by reducing a non-local radiative transfer problem to a local one. Thus the Hfractions estimated are likely to be lower limits since Hself-shielding from FUV radiation occurring between distant “cells” (or dust absorption of the FUV radiation over scales larger than 2) can only result to higher Hfractions.
The local approximation made here in order to simplify a formidable radiative transfer problem in turbulent media still leaves the choice of the HI-Hmixing scale open. A natural choice of for our three dimensional hydrodynamic+thermodynamic ISM models would be , where is the scale where the turbulent ISM pressure begins to dominate the thermal pressure, or equivalently the scale where the cloud size -linewidth () relation breaks down and . The corresponding radius is then given by:
| (A7) |
where is the size-linewidth relation found for the cool ISM. Several observational and theoretical studies favor (e.g. Larson, 1981; Elmegreen, 1989; Heyer& Brunt, 2004). The normalization factor for both CNM and WNM (Wolfire et al., 2003). Below such scales the thermal velocity fields take over, setting a natural resolution limit for any hydrodynamic ISM models tracking macroscopic gas motions. Moreover tracking the thermal state of the gas as a function of time and position allows to adjust accordingly (cf. eq. A7), as expected in the true multiphase medium (e.g. Chieze & Pineau Des Forets, 1987). Finally, by avoiding linking to the numerical resolution of our hydrodynamic models (e.g. Glover & Mac Low, 2007) keeps the computed Hgas mass fraction independent of it. We set a maximum value of corresponding to the scale length of gas (cf. eq. A7). This temperature limit broadly marks the CNM WNM thermodynamic transition zone beyond which purely thermal motions fully overtake the macroscopic ones over the scales resolved here, while little Hcontent is expected ( for while collisional destruction of Hbecomes very efficient).
In the case of CNM-to-WNM or the WNM gas phase can be substantial, and the dust extinction term can be important. Then we use
| (A8) |
which after some simplifications results to,
| (A9) |
The latter expression encompasses both dust extinction and Hself-shielding and is the correct one for use in eq. (A3). For , becomes identical to that given in eq. (A6). In the case of pure dust shielding (i.e. ), and after some calculations it becomes
| (A10) |
Appendix B Cooling Function based on PDR models
The cooling curves in temperature (), H2 abundance and radiation field strength are derived from a grid of photo-dissociation region (PDR) models that have a range in irradiation ( values) and density . The radiation field extends beyond 13.6 eV according to a starburst99 spectrum for a Salpeter IMF, i.e., the HII region is computed as part of the PDR. The code of Meijerink & Spaans (2005), with the latest chemical rates and grain surface reactions as in Cazaux & Spaans (2009) is adopted.
The PDR models, for a given and density, are evaluated at the particular H2 abundances and temperatures that they enjoy with depth to get a parameterization of the cooling rate in , H2 abundance and . In general, the chemical and thermal balance in PDR models depends on the ambient density. As it turned out, a cooling curve extraction (density squared scaling) was possible because many cooling lines have critical densities well in excess of cm-3.
However, optical depth effects can suppress cooling and drive level populations to LTE. Therefore, information on the typical column over which coolants exist chemically in a PDR are used to correct for line trapping, as follows. A local turbulent velocity dispersion (Gaussian ) of is adopted and some turbulent coherence length (between 3 and 0.3 pc). This yields a formal velocity gradient for scales larger than . If the opacity is concentrated on small physical scales, then radiation is trapped. Still, different parts of the PDR cloud do not see each other on large physical scales. In effect, one has an effective Sobolev approximation or not depending on the chemical stratification. We adopt pc in these simulations to mimic the effects of a turbulently active nuclear region. In this, the multi-zone escape probability code of Poelman & Spaans (2005) is used for the radiative transfer in the cooling lines (under statistical equilibrium). Each zone in a PDR was treated this way, and a correction on the cooling curve due to line trapping effects can be derived.
For the warm and dense gas in the simulation clumps, the opacity is concentrated on small physical scales, leading to line trapping. For example, cooling lines like [CII] 158 m, [OI] 63 m and CO all have optical depths significantly larger than unity across a single PDR interface. Given that this PDR sub-structure is not resolved in the simulations, we feel that these opacity effect should be included.
The dust temperature is computed as part of the PDR model and is often larger than 30 K. The far-infrared radiation field produced by this dust is included in the statistical equilibrium of all cooling agents. Particularly water is quite sensitive to dust pumping and is an effective heater in the presence of dust grains warmer than 50 K.
At temperatures above K the presence of an ionizing component in the impinging radiation field was found to suppress the cooling rate, compared to a collisionally ionized plasma, by a factor of for K. This is of little concern in our hydrodynamical simulations. Line transfer in the resonantly scattered Lyman line benefits very strongly from dust absorption and re-radiation in the optically thin far-infrared continuum.

