VLT optical observations of the isolated neutron star
RX J0420.05022††thanks: Based on observations collected at ESO, Paranal, under Programmes 66.D-0128(A), 078.D-0162(A)
Abstract
Context. X-ray observations performed with the Röntgen Satellite (ROSAT) led to the discovery of seven radio-silent isolated neutron stars (INSs) which are detected only through the relatively dim and purely thermal X-ray emission from the cooling star surface. A few of these INSs (a.k.a. X-ray Dim INSs, or XDINSs) have been also detected at optical wavelengths where they seem to feature thermal spectra. Optical studies of XDINSs thus play a crucial role in mapping the temperature distribution on the neutron star surface and in investigating the existence of an atmosphere around the neutron star.
Aims. The aim of this work is to investigate the optical identification of the XDINS RX J0420.05022, tentatively proposed by Haberl et al. (2004) based on Very Large Telescope (VLT) observations.
Methods. We re-analysed the original observations of Haberl et al. (2004) to assess the detection significance of the proposed counterpart and we performed deeper VLT observations aiming at a higher confidence detection.
Results. With a detection significance and a re-computed flux of , we can not rule out that the proposed counterpart was spurious and produced by the halo of a very bright nearby star. While we could not detect the proposed counterpart in our deeper VLT observations, we found evidence for a marginally significant () detection of a similarly faint object (), north of it and coincident with the updated Chandra position of RX J0420.05022. Interestingly, the angular separation is consistent with the upper limit on the RX J0420.05022 proper motion (Motch et al. 2009), which suggests that we might have actually detected the Haberl et al. proposed counterpart. From the flux of the putative RX J0420.05022 counterpart we can rule out a optical excess with respect to the extrapolation of the XMM-Newton spectrum.
Conclusions. High spatial resolution observations with the refurbished Hubble Space Telescope (HST) are the only way to confirm the detection of the putative candidate counterpart and to validate its identification with RX J0420.05022.
Key Words.:
Optical: stars; neutron stars: individual RX J0420.050221 Introduction
X-ray observations performed with the Röntgen Satellite (ROSAT) yielded to the identification of a group of seven radio-silent (Kondriatev et al. 2008)111The claimed low-frequency pulsed emission from two of them (Malofeev et al. 2007) has not been confirmed yet. Isolated Neutron Stars (INSs). Their relatively dim X-ray emission (– erg) originally earned them the nickname of X-ray Dim INSs, or XDINSs (see Haberl 2007; van Kerkwijk & Kaplan 2007, and Kaplan 2008 for recent reviews). Recently, a new XDINS candidate has been identified in archival XMM-Newton observations (Pires et al. 2009). XDINSs have purely thermal X-ray spectra which are best represented by a blackbody (–100 eV), as expected for middle-aged ( Myr) cooling INSs, whose emission radius is consistent with a sizable fraction of the neutron star surface. The derived hydrogen column densities cm-2 suggest distances 500 pc (Posselt et al. 2007), as confirmed in two cases by their optical parallaxes (e.g. van Kerkwijk & Kaplan 2007). X-ray pulsations (–12 s) have been detected for all of them (Haberl et al. 1997, 1999;
Haberl & Zavlin 2002;
Hambaryan et al. 2002;
Zane et al. 2005;
Tiengo & Mereghetti 2007) but RX J1605.3+3249, although with different pulsed fractions. The measurement of the period derivative (Cropper et al. 2004; Kaplan & van Kerkwijk 2005a; Kaplan & van Kerkwijk 2005b; van Kerkwijk & Kaplan 2008) yielded spin-down ages of Myrs and rotational energy losses erg s-1. Broad absorption features (–0.7 keV) have been observed in all XDINSs but RX J1856.53754 (Haberl et al. 2003, 2004; van Kerkvijk et al. 2004; Zane et al. 2005), superimposed to the thermal continuum. These features are likely due to proton cyclotron and/or bound-free, bound-bound transitions in H, H-like and He-like atoms. The inferred magnetic fields of G are consistent with the values derived from the neutron star spin down and suggest that XDINSs might be (evolutionary) linked to other class of INSs, the magnetar candidates (see Mereghetti 2008 for a recent review) and
the Rotating Radio Transients (e.g. Popov, Turolla, Possenti 2006).
In the optical, only RX J1856.53754 (Walter & Matthews 1997; Walter 2001), RX J0720.43125 (Motch & Haberl 1998; Kulkarni & van Kerkwijk; 1998; Motch et al. 2003) and RX J1605.3+3249 (Kaplan et al. 2003; Motch et al. 2005; Zane et al. 2006) have counterparts certified by their proper motion measurements, while likely candidates have been proposed for RX J1308.6+2127 (Kaplan et al. 2002) and 1RXS J214303.7+065419 (Zane et al. 2008; Schwope et al. 2009) based on their coincidence with the X-ray positions. Apart from providing a clear evidence of the optical identification, proper motion measurements are important to obtain an estimate of the kinematic age of the neutron star, to be compared with the characteristic age derived from the spin-down. The XDINS optical fluxes usually exceed by a factor of (or more) the extrapolation of the X-ray blackbody, and their optical spectra, when measured, seem to follow a Rayleigh-Jeans distribution (e.g., Kaplan 2008). The XDINS optical emission has been interpreted
either in terms of a non-homegeneous surface temperature distribution, with the cooler part emitting the optical (e.g., Pons et al. 2002), or of reprocessing of the surface radiation by a thin H atmosphere around a bare neutron star (Zane et al. 2004; Ho 2007), or of non-thermal emission from particles in the star magnetosphere (Motch et al. 2003). However, for the measured , magnetospheric emission would not be detectable, at least if an average optical emission efficiency of rotation–powered neutron stars (e.g. Zharikov et al. 2006) is assumed. Alternatively, like for the magnetars, optical magnetospheric emission might be powered by the neutron star magnetic field, as proposed for 1RXS J214303.7+065419 (Zane et al. 2008).
One of the XDINSs without a certified optical counterpart is RX J0420.05022. The first optical observations of the field performed with the New Technology Telescope (NTT) soon after the discovery of the X-ray source (Haberl et al. 1999) did not reveal any candidate counterpart brighter than B and R. More recently, thanks to the updated Chandra position, a possible optical identification was proposed by Haberl et al. (2004) with a faint object (B, V) tentatively detected on archival Very Large Telescope (VLT) images. However, the identification has not been confirmed so far. The field of RX J0420.05022 was also observed in the near-infrared (NIR) with the VLT but no candidate counterpart was detected down to H (Mignani et al. 2007; Lo Curto et al. 2007; Posselt et al. 2009) and K (Mignani et al. 2008).
In this paper we re-analyze the original VLT observations of RX J0420.05022 presented by Haberl et al. (2004) and we report on follow-up, longer optical observations of the candidate counterpart, performed by our team with the VLT. Observations and data analysis are described in Sect. 2, while results are presented and discussed in Sect. 3 and Sect. 4, respectively.
2 Observations
2.1 Observation description
Optical observations of RX J0420.05022 were performed in service mode with the VLT at the ESO Paranal observatory on November 21st 2000, on November 25th 2006, January 16th and 22nd, and February 11th 2007 (see Tab. 1 for a summary).
The 2000 observations were performed with FOcal Reducer/low dispersion Spectrograph (FORS1), a multi-mode camera for imaging and long-slit/multi-object spectroscopy, as part of the ESO guaranteed time programme. At the epoch of the
observations FORS1 was equipped with the original four port 20482084 CCD detector and it was mounted at the VLT Antu telescope. The observations were performed in standard resolution mode, with a 02 pixel size and a field of view of 6. The low gain, fast read-out, single port mode was chosen. A sequence of three 1200 s exposures was obtained through the Bessel B filter, with an airmass of , an image quality of , and dark time conditions. Since the seeing values measured by the differential image motion monitor (DIMM) are relative to the zenith and not to the pointing direction of the telescope they are not necessarily indicative of the actual image quality. We thus computed the actual image quality from the measured point spread function (PSF), derived by fitting the full width half maximum (FWHM) of a number of well-suited field stars using the Sextractor tool (Bertin & Arnouts 1996), as documented in the FORS1 data quality control pages222http://www.eso.org/observing/dfo/quality/FORS1/qc/qc1.html.
Two 600 s additional exposures were obtained in the V filter but since the proposed candidate counterpart was not detected we focus our analysis on the B-band data only. Sky conditions were reported to be photometric (see Haberl et al. 2004 for a more detailed observations description). A very bright star, CD-50 1353 (, as listed in Simbad), located at from the position of RX J0420.05022 was partially masked using the FORS1 occulting bars. Bias, twilight flat–fields frames, and images of the standard star fields SA 92 and Rubin 149 (Landolt 1992) were obtained as part of the FORS1 science calibration plan.
| Date | N | T (s) | IQ () | Airmass | |
|---|---|---|---|---|---|
| FORS1 | 2000-11-21 | 3 | 3600 | 0.74 (0.08) | 1.14 |
| FORS2 | 2006-11-25 | 5 | 2915 | 0.71 (0.10) | 1.24 |
| 2007-01-16 | 10 | 5830 | 0.93 (0.18) | 1.18 | |
| 2007-01-22 | 5 | 2915 | 0.82 (0.11) | 1.19 | |
| 2007-02-11 | 5 | 2915 | 0.82 (0.12) | 1.30 |
The 2006/2007 observations were performed with FORS2 as part of the ESO open time programme. At the epoch of the observations, FORS2 had swapped with FORS1 at the VLT Antu telescope. FORS2 is equipped with two 2k4k MIT CCD detectors. Due to vignetting, the effective sky coverage of the two detectors is smaller than the projected detector field of view, and it is larger for the upper CCD chip. Observations were performed in high resolution mode, with a 22 binning and a pixel size of 0125. The low gain, fast read-out mode was chosen. The telescope pointing was set in order to position RX J0420.05022 in the upper CCD chip to include a larger number of reference stars for a precise image astrometry thanks to its larger effective sky coverage (). Sequences of 580 s exposures were obtained through the Bessel B filter. The bright star CD-50 1353 was more efficiently masked both by positioning it at the centre of the gap between the two chips and by using the FORS2 occulting bars. Unfortunately, the distance of RX J0420.05022 from the gap () and the width of the occulting bars (), which can move along one CCD direction only, made it impossible to mask completely the star halo. Exposures were taken in dark time and under mostly clear but not perfectly photometric sky conditions. In particular, the night of February 11th was affected by the presence of thin variable cirri. Atmospheric conditions were not optimal either. The first two nights were affected by a strong wind, close to the telescope pointing limit, while the nights of January 16th and February 11th were affected by 40 % humidity. Unfortunately, although foreseen by the instrument science calibration plan, only for some nights both day and night time calibration frames were taken. In particular, no twilight flat–fields were taken for the night of November 25th, while B-band standard star images (of the Rubin 152 field) were taken on the night of February 11th only.
2.2 Data reduction and calibration
We retrieved the FORS1 science images from the public ESO archive333http://archive.eso.org and we reduced them using tools available in MIDAS for bias subtraction, and flat–field correction. The same reduction steps were applied to the FORS2 science images through the ESO FORS2 data reduction pipeline444http://www.eso.org/observing/dfo/quality/FORS2/pipeline. We searched the archive for suitable twilight flat–fields to reduce the FORS2 November 25th science images but the closest in time were those associated with our January 16th images. We evaluated the possibility of using lamp flat–fields as backup calibration frames, with the caveat that they are affected by reflections produced by the instrument atmospheric dispersion correctors. However, since lamp flat–fields are only taken for trending purposes, and the high resolution mode is not the standard one for FORS2, no suitable data was found in the archive. Thus, since the November 25th science images can not be calibrated with twilight flat–fields taken on the same night, initially we do not use them in the subsequent analysis. For both the FORS1 and FORS2 data sets the photometric calibration was applied using the available, extinction corrected, night zero points available through the instrument data quality control database555http://www.eso.org/observing/dfo/quality/FORS2/qc/qc1.html. For the January 16th and 22nd FORS2 observations, for which no standard star images were taken, we assumed as a zero point the value extrapolated from the night zero point trend. Since none of the FORS2 observations was taken in perfectly photometric conditions, we estimated that a relative photometry calibration, with the February 11th observations taken as a reference, would introduce an uncertainty comparable to that associated to the extrapolation of the zero point trend. We converted the trended FORS1 and FORS2 zero points, computed in units of electrons/s, to units of ADU/s by applying the corresponding electrons–to–ADU conversion factors. For each of the two data sets, we then used the MIDAS task average/window to cosmic rays filter and stack single exposures.
2.3 Astrometry
As a reference for the astrometric calibration we used the GSC-2 version 2.3 (Lasker et al. 2008). Approximately 70 GSC-2 objects are identified in the 2000 FORS1 image. From this list we filtered out extended objects, stars that are either saturated or too faint to be used as reliable astrometric calibrators or too close to the CCD edges. We finally performed our astrometric calibration using 30 well-suited GSC-2 reference stars, evenly distributed in the FORS1 field of view. The pixel coordinates of the selected GSC-2 stars were measured by fitting their intensity profiles with a Gaussian function using the dedicated tool of the Graphical Astronomy and Image Analysis (GAIA) interface666star-www.dur.ac.uk/ pdraper/gaia/gaia.html. The coordinate transformation between the detector and the celestial reference frame was then computed using the Starlink package ASTROM777http://star-www.rl.ac.uk/Software/software.htm using higher order polynomials to accounts for the CCD distortions. The rms of the astrometric solution turned out to be 02, accounting for the rms of the fit in the right ascension and declination components. Following Lattanzi et al. (1997), we estimated the overall uncertainty of our astrometry by adding in quadrature the rms of the astrometric fit and the precision with which we can register our field on the GSC-2 reference frame. This is estimated as , where the term accounts for the free parameters (x-scale, y-scale, and rotation angle) in the astrometric fit, is the mean positional error of the GSC-2 coordinates (03, Lasker et al. 2008) and is the number of stars used for the astrometric calibration. The uncertainty on the reference stars centroids is below 001 and was neglected. We also added in quadrature the 015 uncertainty (Lasker et al. 2008) on the tie of the GSC-2 to the International Celestial Reference Frame (ICRF). Thus, the overall accuracy of the FORS1 astrometry is 027 (). The astrometric calibration of the FORS2 image was computed in the same way but with a lower number of reference stars due to the smaller field of view of the FORS2 chip. The rms of the astrometric fit then turned out to be 036. Again, after accounting for systematic uncertainties (see above) the overall accuracy of the FORS2 astrometry is 043 ().
As a reference to compute the RX J0420.05022 position we considered X-ray coordinates derived from Chandra observations which are closest in time to our VLT observations. In particular, for the FORS1 observations (epoch 2000.89) we used the Chandra coordinates (epoch 2002.86) published in Haberl et al. (2004), i.e. , which have a nominal error of 06 (90% confidence level). For the FORS2 observations (epoch 2007.04) we reanalysed a more recent Chandra observations (epoch 2005.85). Like in Haberl et al. (2004), we determined the source position with the CIAO task celldetect and we obtained , (06; 90% confidence level). As shown in Haberl et al. (2004) a match between the coordinates of the X-ray sources detected in the Chandra field with those of their possible USNOB.10 counterpart did not reveal any significant systematic shift. No significant shift is found between the coordinates of the same X-ray sources between the 2002 and 2007 Chandra observations either. Thus, no boresight correction was applied to our reference coordinates.
Recently, an upper limit on the RX J0420.05022 proper motion (123 mas yr-1, ) was obtained with Chandra (Motch et al. 2009). We accounted for the proper motion uncertainty when we registered the reference Chandra coordinates on the FORS1 and on the FORS2 images. This yields an additional position uncertainty due to the unknown proper motion of and () for each of the two images, respectively. The overall uncertainty to be attached to the RX J0420.05022 position at the epoch of the FORS1 and FORS2 observations was finally obtained by adding in quadrature the error on the Chandra coordinates (), the coordinate uncertainty due to the proper motion, and the overall error of the astrometric calibration. This yields to uncertainties of 087 and 111 (90% confidence level) on the RX J0420.05022 position on the FORS1 and on the FORS2 image, respectively.
3 Results
3.1 The FORS1 observations
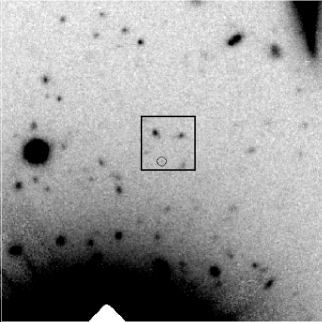
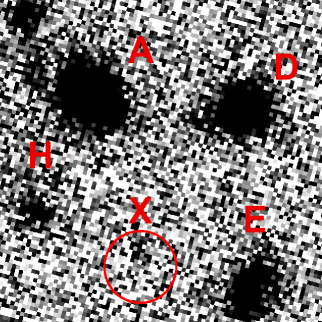
We first re–analyzed the VLT observations taken in 2000 to better assess the confidence of the optical identification of RX J0420.05022 proposed in Haberl et al. (2004). Fig. 1 (left) shows the computed Chandra position of RX J0420.05022 overlaied on a cutout of the 2000 FORS1 co–added B-band image. As seen from Fig. 1 (left), only the bright PSF core of star CD-50 1353 is masked, while its halo extends close to the target position. This increases the local sky background as well as the background noise, which results in a larger number of spurious detections. In order to enhance the detection significance for fainter objects we tried to minimise the effects of the halo of star CD-50 1353 on the local sky background. Firstly, we fitted the sky background in an area of around the target position using a second order polynomial and we subtracted the fitted value from the co–added B-band image using the MIDAS task fit/flat_sky. We warn here that the fit to the sky background is biased by the choice of the sampling areas. This can yield to more or less evident feature enhancements when the sky background subtraction is applied to the image. We thus carefully choose the sampling areas not to introduce systematic effects in our procedure. Fig. 1 (middle) shows a zoom of the sky-subtracted image. As already shown by Haberl et al. (2004), four objects are clearly detected close to the Chandra position. In addition, a very faint feature is possibly recognised within the Chandra error circle. We identify this feature with object of Haberl et al. (2004), which they tentatively proposed as a candidate counterpart to RX J0420.05022. However, the excess of counts at the feature position is comparable to the rms of the local sky background, which corresponds to a very low detection significance of . We re-computed the magnitude of the feature through PSF photometry. We derived the PSF parameters from a set of several non saturated objects selected for their stellar like profiles, located close to the RX J0420.05022, and spanning a large range of magnitudes. The airmass correction was applied using the Paranal extinction coefficients measured with FORS1888http://www.eso.org/observing/dfo/quality/FORS1/qc/qc1.html. We found . This is fainter than the value of reported in Haberl et al. (2004) but it is still compatible at the level when systematic uncertainties in their photometry are taken into account (see section 3 of Haberl et al.). For a better visualisation, we smoothed the image using a Gaussian filter over cells of pixels i.e. of size comparable to that of the image PSF. Since the image smoothing enhances the detection of very faint objects but also that of fluctuations of the noisy sky background we fine-tuned the smoothing parameters not to produce an over-enhancement of background features. The result is shown in Fig. 1 (right). However, the image processing (sky subtraction and smoothing) does not single out object against the many, similarly significant, background features recognised around the Chandra position. Thus, we can not rule out that object was a spurious detection due to the high background noise induced by the halo of star CD-50 1353.
3.2 The FORS2 observations
We used our follow-up FORS2 observations to search for a higher confidence candidate counterpart to RX J0420.05022. In order to minimise the effects of the halo of star CD-50 1353, we first co–added only the exposures taken with an image quality better than . In first place, we used the co-addition of the best image quality exposures of all nights with the exception of those taken on November 25th 2006, which were calibrated using twilight flat–fields taken about 40 days apart (see Sect 2.2).
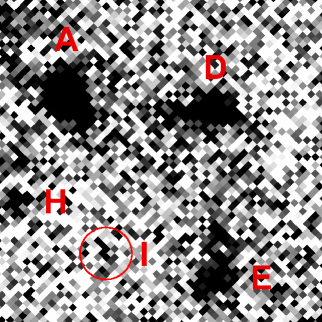
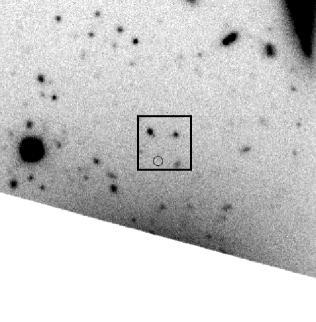
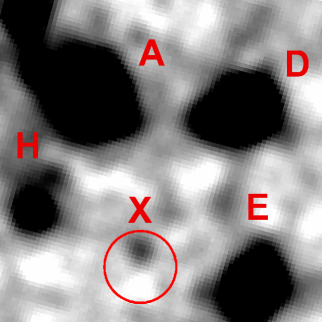
Fig. 2 (left) shows the computed Chandra position of RX J0420.05022 overlaid on a cutout of the FORS2 B-band image (6960 s) obtained from the co-addition of the twelve best image quality (08-09) January/February 2007 exposures. Indeed, although the more efficient masking reduced the contamination from the halo of star CD-50 1353, the sky background at the Chandra position remained significantly affected by scattered light. As we did in Sect. 3.1, we fitted and subtracted the sky background from the co–added image. In order to increase the S/N ratio per pixel we then rebinned the sky-subtracted image by a factor of 2, ending up with a pixel size of 025 which well matches that of FORS1 (02). We did not find evidence for object , the feature tentatively proposed by Haberl et al. (2004) as a candidate counterpart to RX J0420.05022. However, we possibly recognised a second feature within the Chandra error circle, north of the expected position of object . Unfortunately, the low number of counts
only yields to a marginal detection significance ().
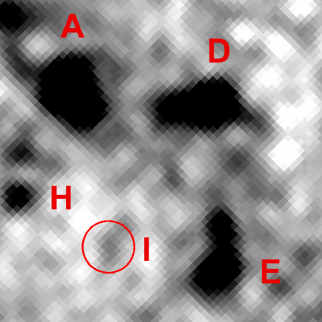
As a test, and being aware of possible issues related to the non optimal flat–fielding, we decided to use the five November 2006 exposures (2915 s) which happen to have the best image quality (07) in the FORS2 data set. As done for the January/February data set, we fitted and subtracted the sky background from the co–added image and we rebinned the sky-subtracted image by a factor of 2. Interestingly, a feature appears right at the same position of that seen in the co–addition of the January/February best image quality exposures, although with only a detection significance. While we do not claim that this is a strong detection evidence, it is quite unusual that a background feature appears at the same position in images taken weeks apart. To increase the S/N ratio, we both co–added all the twenty 2007 exposures (11680 s) and all the available exposures (14575 s), again applying sky-subtraction and rebinning, and we obtained a detection significance of and , respectively. A zoom of the longest integration time, co–added image is shown in Fig. 2 (middle), where the feature detected in the Chandra error circle is labelled . For a better visualisation, we smoothed the image using a Gaussian filter over cells of pixels (Fig. 2, right).
| ID | |||
|---|---|---|---|
| X | 04 20 01.94 | -50 22 47.75 | 27.5 0.3 |
| A | 04 20 02.10 | -50 22 42.60 | 24.350.05 |
| D | 04 20 01.59 | -50 22 43.17 | 24.950.05 |
| E | 04 20 01.57 | -50 22 48.75 | 25.370.07 |
| H | 04 20 02.28 | -50 22 46.30 | 26.490.10 |
As done in Sect. 3.1, we measured the flux of object through PSF photometry. The airmass correction was applied using the Paranal extinction coefficients measured with FORS2999http://www.eso.org/observing/dfo/quality/FORS2/qc/qc1.html. Due to the still low S/N in the aperture and to the noisy sky background the flux measurement is obviously affected by a large error. Our best estimate gives , where the statistical error obviously dominates over the uncertainty of our absolute photometry (Sect. 2.2). The object magnitude and coordinates are listed in Table 2 together with those of the other objects identified in Fig. 2, as a reference. Interestingly, the flux of object coincides with that of object (), the candidate counterpart tentatively proposed by Haberl et al. (2004), which we re-computed in Sect. 3.1. One may thus speculate whether we detected the same feature both in the FORS2 and in the FORS1 images, although at slightly different positions. The measured angular separation between object and object is , accounting for an estimated uncertainty of one pixel on the object centroid in both the FORS1 and FORS2 images. This would imply a yearly displacement of mas yr-1, consistent with the upper limit on the RX J0420.05022 proper motion (Motch et al. 2009). The yearly displacement would thus imply a transverse velocity of 140 km s-1, where is the neutron star distance in units of 350 pc (Posselt et al. 2007), i.e. within the range of the tangential velocities inferred for neutron stars. The actual proper motion measurement, to be eventually obtained with Chandra, will unambiguously address this speculation.
4 Discussion
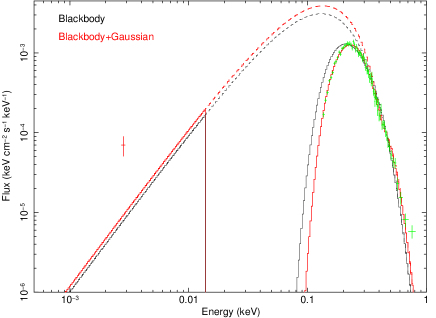
The very marginal detection significance () of object against the number of local spurious detections makes it difficult to determine whether or not it is real and, thus, whether or not we have detected a candidate optical counterpart to RX J0420.05022. We compared the flux of the putative candidate counterpart with the extrapolation in the optical domain of the models which best fit the XMM-Newton EPIC-pn spectrum of RX J0420.05022. To this aim, we have re-analysed the original data of Haberl et al. (2004) using updated calibration files. The spectrum can be fit by a single blackbody with temperature eV and NH= cm-2 (reduced , 64 d.o.f.), corresponding to an emission radius km, where is the X-ray emission as seen from infinity and is the neutron star distance in units of 350 pc (Posselt et al. 2007). However, a blackbody with eV and NH= cm-2 ( km) plus an absorption line with centroid energy eV and equivalent width eV gives a better fit (reduced , 62 d.o.f.). The line width ) was fixed at 70 eV, as in Haberl et al. (2004). For the spectral fits we used element abundances both from Anders & Grevesse (1989) and Wilms et al. (2000), obtaining virtually the same results. The best-fit, absorption-corrected X-ray spectra of RX J0420.05022 are shown in Fig. 3 together with the optical flux of its putative counterpart. We corrected for the absorption in the B band using as a reference the NH derived from the best-fit X-ray spectral model (blackbody plus absorption line) and applying the relation of Predehl & Schmitt (1995) with the extinction coefficients of Fitzpatrick (1999). From the flux of the putative counterpart we can rule out a optical excess with respect to the extrapolation of the XMM-Newton spectrum. We note that an optical excess of is usually observed in other optically identified XDINSs with the exception of RX J1605.3+3249 and 1RXS J214303.7+065419, where it is as large as (Motch et al. 2005) and (Zane et al. 2008; Schwope et al. 2009), respectively.
As a limit case, we checked whether an optical excess of would be compatible with either rotation-powered emission from the neutron star magnetosphere or with thermal emission from a fraction of the neutron star surface, colder and larger than that responsible for the X-ray emission. In the first case, the value of the X-ray period and the upper limit on the period derivative of RX J0420.05022 (s; s s-1; see Haberl 2007) only yield a rotational energy loss erg s-1. The flux of the putative counterpart would imply an optical luminosity erg s. This would correspond to an emission efficiency , which could still be compatible with the values expected for years old neutron stars (Zharikov et al. 2006). However, a period derivative s s-1, comparable to that of other XDINSs, would imply a factor of 100 lower and would make it less likely that the optical emission is powered by the rotational energy loss.
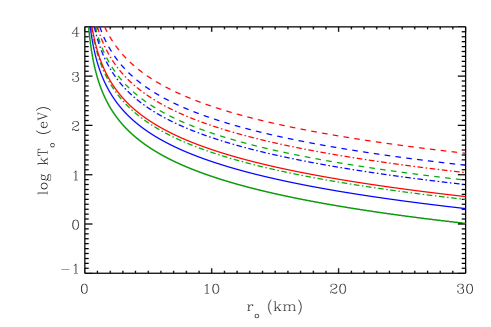
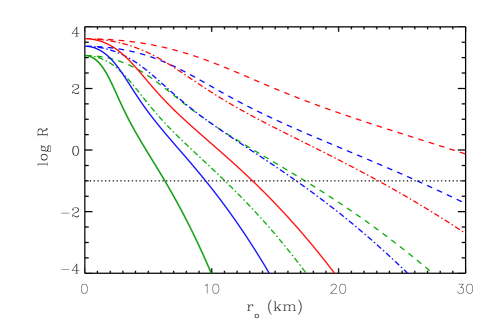
In the second case, we can constrain both the blackbody temperature and the emission radius , as seen from infinity. Since the fit to the XMM-Newton spectrum does not require the presence of a second blackbody component at lower temperature, we can impose that its relative contribution to the total X-ray flux in the 0.1-1 keV band (see Sect. 3 of Zane et al. 2008) must be . We chose as a reasonable threshold. We first computed the values of for a grid of values of and for different values of the optical excess and of the source distance (Fig. 4, upper panel), where eV and km are derived from the best X-ray spectral fit (blackbody plus absoption line, see above). We then computed from the values of and (Fig. 4, lower panel). As it is seen, for a neutron star distance of 350 pc an optical excess of would be compatible with a blackbody with eV and an an implausibly large emitting radius of 23 km. Thus, would our putative counterpart be confirmed, an optical excess of , for a neutron star distance of pc, might rather point towards a non-thermal origin for the optical emission, as proposed for RBS1̃774 (Zane et al. 2008). Actually, as Fig. 4 shows, unphysical large radii are required even if the actual counterpart is dimmer, –4, unless the neutron star is at pc.
5 Conclusions
We carefully re-analysed archival VLT/FORS1 observations of the field of the XDINS RX J0420.05022, taken in 2000, and we performed deeper follow-up observations with FORS2 in 2006 and in 2007. With a measured detection significance of and a re-computed flux of , we can not rule out that the candidate counterpart tentatively detected in the FORS1 images by Haberl et al. (2004) was a feature of the noisy sky background, produced by the very bright nearby star CD-50 1353.
While we could not confirm this detection in our deeper FORS2 images, we detected an apparently new feature () within the updated Chandra error circle of RX J0420.05022, north of the expected position of that detected in the FORS1 images. Interestingly, both their similar flux and their angular separation, compatible with the upper limit on the RX J0420.05022 proper motion, suggest that we might have actually detected the same feature both in the FORS1 and in the FORS2 images. However, its still marginal detection significance () makes it difficult to determine whether the latter feature is associated with a real object, and thus it is the RX J0420.05022 candidate counterpart, or it is also a possible background feature. From the flux of the putative counterpart we can rule out a optical excess with respect to the extrapolation of the XMM-Newton spectrum. An optical excess of (or lower) could be compatible either with rotation-powered emission from the neutron star magnetosphere or with thermal emission from the neutron star surface for a distance pc , i.e. much lower than the current best estimate of 350 pc (Posselt et al. 2007).
More observations are required to confirm the detection of the putative candidate counterpart and to validate its identification with RX J0420.05022. Unfortunately, the presence of star CD-50 1353 severely hampers ground-based follow-up observations, even if performed under sub-arcsec seeing conditions and using a very careful masking. High spatial resolution observations with the refurbished Hubble Space Telescope (HST), possibly to be performed in the ultraviolet, are the only way to settle the identification issue.
Acknowledgements.
RPM acknowledges STFC for support through a Rolling Grant and thanks S. Moheler (ESO) for reducing our observations through the ESO data reduction pipeline and C. Izzo (ESO) for technical details. SZ acknowledges STFC for support through an Advanced Fellowship. We thank the anonymous referee for his/her comments to the manuscript.References
- (1) Bertin, E. & Arnouts, S., 1996, A. & A. Suppl., 117, 393
- Cropper et al. (2004) Cropper, M., Haberl, F., Zane, S., Zavlin, V. E., 2004, MNRAS, 351, 1099
- (3) Fitzpatrick, E.L., 1999, PASP, 111, 63
- (4) Grevesse, N. & Anders, E., 1989, AIPC, 183, 1
- Haberl et al. (1997) Haberl, F., Motch, C., Buckley, D. A. H., Zickgraf, F.-J., Pietsch, W., 1997, A&A, 326, 662
- Haberl et al. (1999) Haberl, F., Pietsch, W., Motch, C., 1999, A&A, 351, L53
- Haberl & Zavlin (2002) Haberl, F., Zavlin, V.E., 2002, A&A, 391, 571
- Haberl et al. (2003) Haberl, F., Schwope, A. D., Hambaryan, V., Hasinger, G., Motch, C., 2003, A&A 403, L19
- Haberl et al. (2004) Haberl, F., Zavlin, V. E., Trümper, J., Burwitz, V., 2004, A&A 419, 1077
- Haberl et al. (2004) Haberl, F., Motch, C., Zavlin, V. E., et al., 2004, A&A, 424, 635
- Haberl (2007) Haberl, F., 2007, Ap&SS, 308, 181
- Hambaryan et al. (2002) Hambarayan, V., Hasinger, G., Schwope, A.D., Schulz, N.S., 2002, A&A, 381, 98
- Ho et al. (2007) Ho, W.C.G., et al. 2007, MNRAS, 375, 821
- Kaplan et al. (2002) Kaplan, D.L., Kulkarni, S.R., van Kerkwijk, M.H., 2002, ApJ, 579, L29
- Kaplan et al. (2003) Kaplan, D.L., Kulkarni, S.R., van Kerkwijk, M.H., 2003, ApJ, 588, L33
- Kaplan & van Kerkwijk (2005a) Kaplan, D.L., van Kerkwijk, M.H., 2005a, ApJ, 628, L45
- Kaplan & van Kerkwijk (2005b) Kaplan, D.L., van Kerkwijk, M.H., 2005b, ApJ, 635, L65
- Kaplan (2008) Kaplan, D. L., 2008, Proc. of ”40 Years of Pulsars: Millisecond Pulsars, Magnetars, and More”, AIP, 983, 331
- Kondriatev et al. (2008) Kondratiev, V. I., Burgay, M., Possenti, A., et al., 2008, Proc. of ”40 Years of Pulsars: Millisecond Pulsars, Magnetars, and More”, AIP, 983, 348
- (20) Kulkarni, S. R. & van Kerkwijk, M. H., 1998, ApJ, 507, L49
- (21) Lasker, B., Lattanzi, M. G., McLean, B. J., Bucciarelli, B., Drimmel, R., et al., 2008, AJ, 136, 735
- (22) Lattanzi, M. G., Capetti, A., Macchetto, F. D. 1997, A&A, 318, 997
- Lo Curto et al. (2007) Lo Curto, G., Mignani, R. P., Perna, R., et al. 2007, A&A 473, 539
- Malofeev et al. (2007) Malofeev, V. M., Malov, O. I., Teplykh, D. A., 2007, Ap&SS, 308, 211
- McLaughlin et al. (2006) McLaughlin, M.A., Lyne, A.G., Lorimer, D.R. et al., 2006, Nature, 439, 817
- Mereghetti (2008) Mereghetti, S., 2008, A&A Rev., 15, 225
- Mignani et al. (2007) Mignani, R., Bagnulo, S., de Luca, A., et al., 2007a, AP&SS, 308, 203
- Mignani et al. (2008) Mignani, R.P., Falomo, R., Moretti, A., Treves, A., Turolla, R., et al., 2008, A&A, 488, 267
- Motch & Haberl (1998) Motch, C., Haberl, F., 1998, A&A, 333, L59
- Motch et al. (2003) Motch, C., Zavlin, V.e., Haberl, F., 2003, A&A, 408, 323
- Motch et al. (2005) Motch, C., Sekiguchi, K., Haberl, F., Zavlin, V. E., et al., 2005, A&A, 429, 257
- Motch et al. (2009) Motch, C., Pires, A. M., Haberl, F., Schwope, A., Zavlin, V.E., 2009, A&A, 497, 423
- Perna et al. (2000) Perna, R., Hernquist, L., Narayan, R., 2000, ApJ, 541, 344
- (34) Pires, A. M., Motch, C., Turolla, R., Treves, A., Popov, S. B., 2009, A&A, 498, 233
- Pons et al. (2002) Pons, J.A., Walter, F.M., Lattimer, J.M., Prakash, M., Neuäuser, R., An, P. 2002, ApJ, 564, 981
- Popov et al. (2006) Popov, S. B., Turolla, R. & Possenti, A. 2006, MNRAS, 369, L23
- Posselt et al. (2007) Posselt, B., Popov, S. B., Haberl, F., et al., 2007, Ap&SS, 308, 171
- Posselt et al. (2009) Posselt, B., Neuhäuser, R., Haberl, F., 2009, A&A, 496, 533
- (39) Predehl, P. & Schmitt, J.H.M.M. 1995, A&A 293, 889
- (40) Schwope, A., Erben, T., Kohnert, J., 2009, A&A, 499, 267
- Tiengo & Mereghetti (2007) Tiengo, A., Mereghetti, S., 2007, ApJ, 657, L101
- Walter & Matthews (1997) Walter, F.M., & Matthews, L.D., 1997, Nature, 389, 358
- Walter (2001) Walter, F.M., 2001, ApJ, 549, 433
- van Kerkwijk& Kulkarni (2001) van Kerkwijk, M.H., Kulkarni, S.R., 2001, A&A, 378, 986
- van Kerkwijk et al. (2004) van Kerkwijk, M. H., et al., 2004, 608, 432
- van Kerkwijk & Kaplan (2007) van Kerkwijk, M. H., Kaplan, D. L., 2007, Ap&SS, 308, 191
- van Kerkwijk & Kaplan (2008) van Kerkwijk, M. H. & Kaplan, D. L., 2008, ApJ, 673, L163
- (48) Wilms, J., Allen, A., McCray, R., 2000, ApJ, 542, 914
- Zane et al. (2004) Zane, S.,Turolla, R., Drake, J.J., et al, 2004, AdSpR, 33, pp. 531-536.
- Zane et al. (2005) Zane, S., Cropper, M., Turolla, R., et al., 2005, ApJ, 627, 397
- Zane et al. (2006) Zane, S., De Luca, A., Mignani, R.P., Turolla, R., 2006, A&A, 457, 619
- Zane et al. (2008) Zane, S., Mignani, R.P., Turolla, R., et al., 2008, ApJ, 682, 487
- Zharikov et al. (2006) Zharikov, S., Shibanov, Yu., Komarova, V., 2006, AdSpR, 37, 1979