Bright Ly Emitters at z9: constraints on the luminosity function from HiZELS ††thanks: Based on observations obtained with the Wide Field CAMera (WFCAM) and the Cooled Grating Spectrometer (CGS4) on the United Kingdom Infrared Telescope (UKIRT) as part of the Hi-z Emission Line Survey (HiZELS)
Abstract
New results are presented, as part of the Hi- Emission Line Survey (HiZELS), from the largest area survey to date (1.4 deg2) for Ly emitters (LAEs) at . The survey, which is primarily targeting H emitters at , uses the Wide Field CAMera on the United Kingdom Infrared Telescope and a custom narrow-band filter in the band and reaches a Ly luminosity limit of erg s-1 over a co-moving volume of Mpc3 at . Only 2 candidates were found out of 1517 line emitters and those were rejected as LAEs after follow-up observations. The limit on the space density of bright Ly emitters is improved by 3 orders of magnitude, consistent with suppression of the bright end of the Ly luminosity function beyond . Combined with upper limits from smaller but deeper surveys, this rules out some of the most extreme models for high-redshift Ly emitters. The potential contamination of future narrow-band Ly surveys at by Galactic brown dwarf stars is also examined, leading to the conclusion that such contamination may well be significant for searches at , and .
keywords:
galaxies: high-redshift, galaxies: luminosity function, cosmology: observations, galaxies: evolution.1 Introduction
One of the most important questions in astronomy is “when did the first stars and galaxies form?”. Observations of the most distant galaxies offer one of the greatest possible constraints on structure formation, allowing models of early galaxy formation and evolution to be tested, refined or refuted. Over the last decade, considerable manpower and telescope time has been dedicated towards this goal: galaxies have now been identified out to redshift , just 750 Myr after the Big Bang (Iye et al., 2006), and recently a Gamma Ray Burst (GRB) has been detected even further away, at (Tanvir et al., 2009); the sample of very-high redshift galaxies is growing rapidly. Making the additional step out to redshifts of is of the upmost importance because it not only offers much tighter constraints on the first star formation or AGN activity of the Universe, but also allows the re-ionisation epoch of the Universe to be studied. As the mean fraction of neutral hydrogen in the intergalactic medium increases, the Ly emission from these star forming galaxies will be strongly attenuated, with dramatic consequences for the shape of the Ly luminosity function, although the precise details may depend upon the level of local ionization of the intergalactic medium by the star forming galaxies (e.g. Haiman & Cen, 2005). Little evolution is seen in the Ly luminosity function between and , suggesting that the Universe was effectively fully ionized by (e.g. Malhotra & Rhoads, 2004; Ouchi et al., 2008), although some hints of evolution have been found at the bright end of the luminosity function beyond (e.g. Kashikawa et al., 2006; Ota et al., 2008). Still, the re-ionisation epoch is widely believed to occur around , with this being supported by several models and observations; the latest results from the Cosmic Microwave Background (e.g. Dunkley et al., 2009; Komatsu et al., 2009) show that the bulk of the re-ionisation occurred at ().
Presently, there are three relatively effective methods for searching for very distant galaxies: the broad-band drop-out technique, “blind” spectroscopic searches and narrow-band imaging surveys. The widely-used drop-out technique (pioneered at by Steidel et al., 1996) requires very deep broad-band imaging, and can potentially identify galaxies as z-band drop-outs (e.g. Bouwens et al., 2008; Richard et al., 2008). This method is efficient for identifying candidates, but requires detailed spectroscopic follow-up to confirm the candidates, especially to rule out contributions from other populations with large z breaks, such as dusty or evolved galaxies and ultra-cool galactic stars (e.g. McLure et al., 2006). Thus, while Richard et al. (2008) identified two candidates by taking advantage of the lensing magnification of a high mass cluster, their spectroscopic follow-up was inconclusive with no emission lines detected. “Blind” spectroscopic surveys can potentially provide spectra directly. They are always limited to very small areas, although Stark et al. (2007) targetted the critical lensing lines of clusters and were able to identify 6 potential objects. Finally, the narrow-band imaging technique has the advantage of potentially probing very large volumes, but can only detect sources with strong emission lines, whilst it still depends on the Lyman-break technique to isolate very high-redshift emitters.
Narrow-band Ly searches at slightly lower redshifts have been extremely successful in detecting and confirming emitters (e.g. Hu et al., 1998), including the detection of the most distant (spectroscopically confirmed) Ly emitter to date at (Iye et al., 2006). There have been attempts to detect Ly at , and particularly at (e.g. Willis & Courbin, 2005; Cuby et al., 2007; Willis et al., 2008), some taking advantage of cluster lensing magnifications; all such studies have been unsuccessful to date, but have only surveyed very small areas (a few tens of square arcmins at most). With the advent of wide-field near-IR detectors, however, it is now possible to increase the sky areas studied by over 2 to 3 orders of magnitude and reach the regime where one can realistically expect to detect objects. This is a key aim of, for example, the narrow-band component of the UltraVISTA Survey (c.f. Nilsson et al., 2007). It is also an aim of HiZELS, the Hi-Z Emission Line Survey (c.f. Geach et al., 2008; Sobral et al., 2009), that we are carrying out using the WFCAM instrument on the 3.8-m UK Infrared Telescope (UKIRT). HiZELS is using a set of existing and custom-made narrow-band filters in the , and bands to detect emission line galaxies over 5 square degrees of extragalactic sky; the narrow-band filter (hereafter NBJ) is sensitive to Ly at .
In this work, an H km s-1 Mpc-1, and cosmology is used; magnitudes are given in the Vega system.
2 DATA AND SELECTION
Deep narrow-band (NB, 3, erg s-1 cm-2) imaging was obtained across 1.4 deg2 in the UKIRT Infrared Deep Sky Survey Ultra Deep Survey (UKIDSS UDS; Lawrence et al., 2007) and the Cosmological Evolution Survey (COSMOS; Scoville et al., 2007; Koekemoer et al., 2007) fields, both of which have a remarkable set of deep multi-wavelength data available – this resulted in the selection of 1517 potential line emitters. The NBJ filter (m) is sensitive to Ly emission at (assuming a top-hat filter shape), probing a co-moving volume of 1.12 Mpc3 – by far the largest probed by a narrow-band survey at these wavelengths. The reader is referred to Sobral et al. (2009) – hereafter S09 – for details regarding the observations, data reduction and the general selection of narrow-band emitters. Here the focus will be on identifying Ly emitters candidates within that data-set.
2.1 Search for Candidates
For a source to be considered a candidate Ly emitter it is required to: i) be selected as a narrow-band emitter in S09 (this required it to be clearly detected in NBJ () with a -NBJ colour excess significance of and observed equivalent width EW Å – see S09 for details in which it is shown that these criteria are very robust); ii) have at least one other detection in the near-infrared; iii) be visually believable in NBJ and the other band(s), avoiding noisy areas; and iv) be undetected ( and direct visual analysis) in the available visible band imaging (,,,,z) – subaru and ACS/hst).
The sample presented in S09 was used to search for potential Ly emitters at . However, the investigation was also extended to a slightly larger area in the UKIDSS UDS field to include areas where deep SUBARU and near-infrared imaging data were available – this corresponds to re-including areas which were conservatively masked for SED fitting purposes in S09, and increases the total area probed to deg2.
2.2 Candidates, testing and follow-up observations
No candidates were found in the UKIDSS UDS field, with all emitters that passed tests i) to iii) being clearly detected in z-band imaging. In COSMOS, however, 2 candidates were found that satisfied all criteria. Both sources are absent in all optical bands down to the 3 level (e.g. mag, mag). They are both detected in NBJ and , with Cand 1 having NB mag (5) and mag (9) and a drop mag, while Cand2 presents NB 20.8 mag (5) and mag (6) and a drop mag. They are both undetected in all other infra-red bands.
These two sources were then subjected to a series of further tests and follow-up observations. Splitting the data into subsets confirmed the detections across observations conducted on different nights (timescale from one day up to one month), with no evidence for variability or proper motion; they were also clearly excluded as potential cross-talk artifacts. Cand1 was followed-up spectroscopically using the CGS4 instrument on UKIRT in January 2009 – these data failed to confirm an emission line. Both candidates were then re-observed using WFCAM (further imaging in February 2009), resulting in the non-detection of both candidates. Also, imaging from the COSMOS public archive (which has become publicly available very recently) fails to detect the candidates. It is therefore clear that these sources are not Ly emitters at . Further investigation shows that the sources are likely to be artifacts; they are located at almost the same pixel position on WFCAM4 in 2 different paw-prints (later investigation showed that these were also found at similar pixel positions in the remaining 2 paw-prints, although at a lower level, and thus were not selected). They seem to be caused by an unfortunate coincidence of a set of slightly hot pixels (not sufficient to be flagged as bad pixels) which, combined with the ditter pattern, produced a few excess at one location on the combined image. No other artifacts like these were found either in UDS (which used a different dither pattern) or in other cameras for COSMOS data.
3 RESULTS & DISCUSSION
3.1 Ly luminosity function at
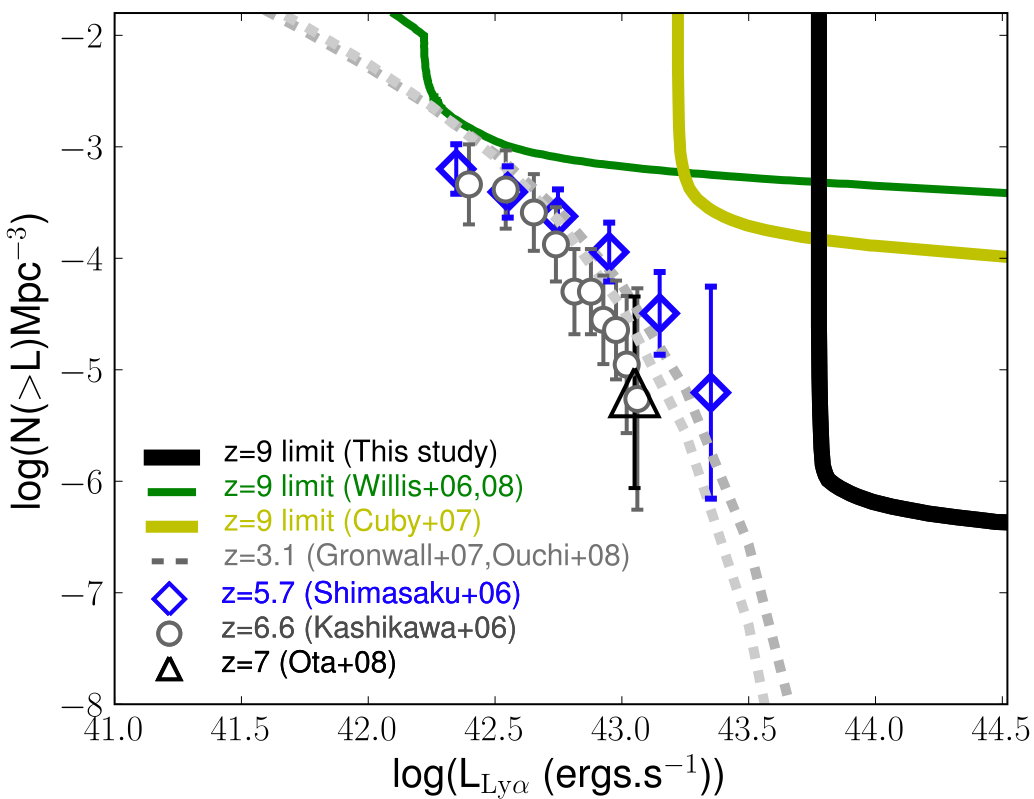
After conducting the widest survey of bright ( erg s-1) Ly emitters at , probing a co-moving volume of 1.12 Mpc3 (1.4 deg2), only 2 sources passed the selection criteria and even those were ruled out after follow-up observations. This result allows the tightest constraint on the bright end of the Ly luminosity function, as previous surveys (Willis & Courbin, 2005; Cuby et al., 2007; Willis et al., 2008) have only covered very small areas (a factor 1000 smaller). However, those surveys have gone significantly deeper (up to a factor of 100). Thus, by combining all the results from the literature, the luminosity function of LAEs at can be constrained across a wide range of luminosities: 10 erg s-1. Figure 1 presents the constraints from Willis & Courbin (2005), Cuby et al. (2007), Willis et al. (2008) and from this work, indicating the inverse of the volume selection function for each survey. These are compared to the measured Ly luminosity functions from to from recent studies. Although the samples of Ly emitters may suffer from significant biases due to the selection, cosmic variance and possible contamination, Figure 1 reveals that there is little evolution in the bright end of the luminosity function between and . However, those bright emitters seem to become much rarer at (Kashikawa et al., 2006), indicating that is not increasing from onwards. The results presented in this Letter are also consistent with no evolution in (log(L∗)0.5) from to .
3.2 Comparison with models and future surveys
Several authors have tried to predict the Ly luminosity function at , either by extrapolating the luminosity function of these emitters from lower redshift, or by using numerical or semi-analytical models (Thommes & Meisenheimer, 2005; Le Delliou et al., 2006; Nilsson et al., 2007). In this Letter, different models are compared with the observational constraints: semi-analytical models, observational extrapolations and phenomenological models. The semi-analytical models discussed here are obtained from galform (Baugh et al., 2005) – these are based on CDM, having been successful in reproducing a wide range of galaxy properties at different redshifts, including Ly emitters up to (Le Delliou et al., 2006). galform computes the build-up of dark matter halos by merging and the assembly of baryonic mass of galaxies and the semi-analytical approach allows the study of properties of the Ly emission – the reader is referred to Baugh et al. (2005), Le Delliou et al. (2006) and Orsi et al. (2008) for more details on these. The observational approach, as in Nilsson et al. (2007), extrapolates the Schechter function parameters based on those obtained in the redshift range. In practice, this results in little evolution but a significant negative evolution. Finally, the phenomenological approach in Thommes & Meisenheimer (2005) assumes that Ly emitters at high redshift are spheroids seen during their formation phase. These models are normalised to give the observed mass function of spheroids in the local Universe, and are combined with a phenomenological function that provides the distribution of spheroid formation events in mass and redshift. Each galaxy is assumed to be visible as a Ly emitter during a starburst phase of fixed duration that occurs at a specific redshift, drawn from a broad distribution. The reader is referred to Thommes & Meisenheimer (2005) for details.
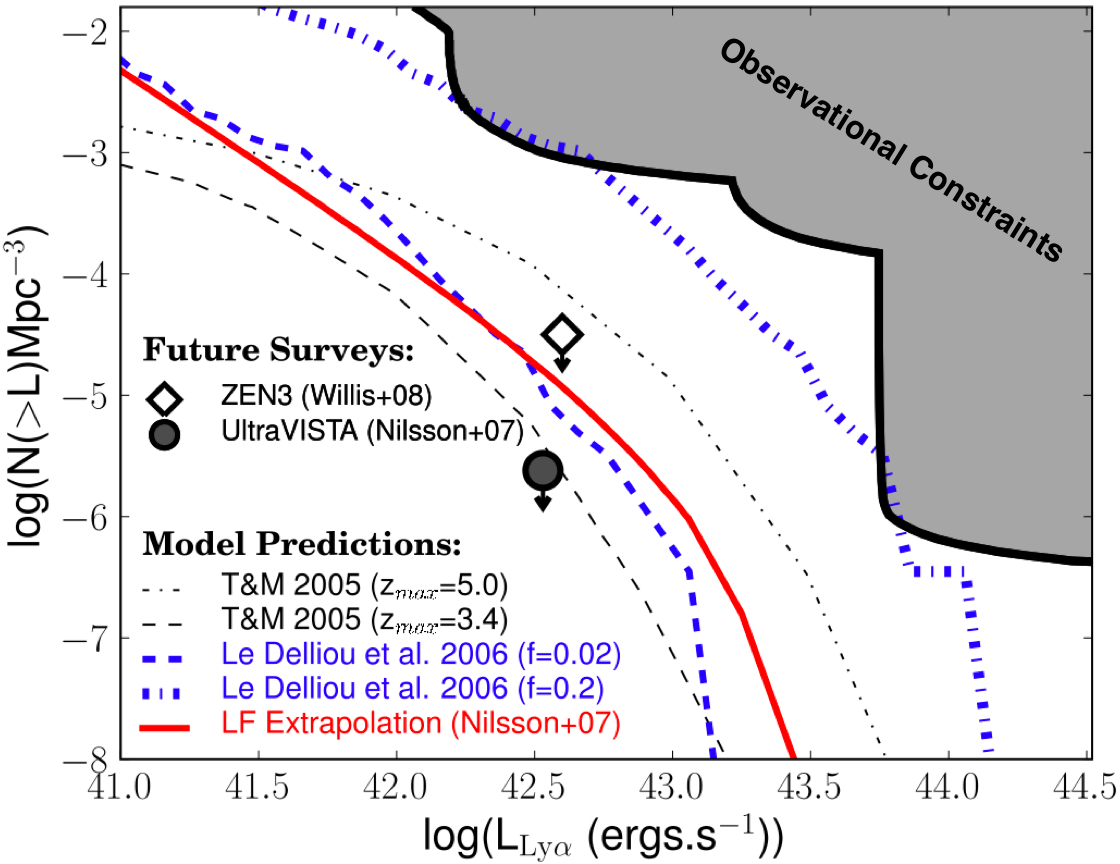
Figure 2 presents predictions from galform (Le Delliou et al., 2006), the observational luminosity function extrapolation from Nilsson et al. (2007) and updated phenomenological predictions (Thommes & Meisenheimer, 2005) assuming peak redshifts of and . Le Delliou et al. (2006) found that their model required an escape fraction of f to fit the observed Ly luminosity function at , but they also presented predictions for f to illustrate how the results might change if the escape fraction increased at very high redshift; we therefore show both predictions in Figure 2. While most predictions are consistent with the current limits, galform models with high escape fractions are marginally rejected both at faint and bright levels. Earlier phenomenological models (e.g. the model of Thommes & Meisenheimer, 2005, not shown in Figure 2) are also clearly rejected by our results.
These results also show, observationally, that bright erg s-1 Ly emitters are very rare. Although the area coverage is absolutely important, a depth+area combination is likely to be the best approach for gathering the first sample of these very high-redshift galaxies. In fact, that is the strategy of the narrow-band component of the UltraVISTA survey (c.f. Nilsson et al., 2007), using the VISTA telescope, which will map 0.9 deg2 of the COSMOS field to a planned 5 flux limit of erg s-1 cm-2; this corresponds to luminosity limit of erg s-1 and a surveyed volume of 5.41 Mpc3 (see Figure 2) at . This combination lies below all current predictions for the Ly LF and the survey is expected to detect 2-20 Ly emitters at . On the other hand, the ZEN3 survey (c.f. Willis et al., 2008, Hibon et al. 2009, submitted to A&A) will also try to get a compromise between area and depth by taking advantage of the Canada-France-Hawaii Telescope (CFHT) and their near-infrared large area camera (WIRCam); that survey will not go as wide or as deep, and whilst it will provide significantly better constraints, it is not clear (as can be seen in Figure 2) whether or not it will be successful in detecting any Ly emitter.
3.3 High redshift Ly searches and cool galactic stars
It has become widely realised in recent years that broad-band searches for galaxies using the Lyman-break technique may suffer from significant contamination by cool Galactic L, T, and possibly Y-dwarf stars (e.g. McLure et al., 2006). These low-mass brown dwarfs display extremely red colours reaching as high as (e.g. Burningham et al., 2008), coupled with relatively flat colours. Such colours can mimic very closely those expected of a star forming galaxy with a strong Lyman-break.
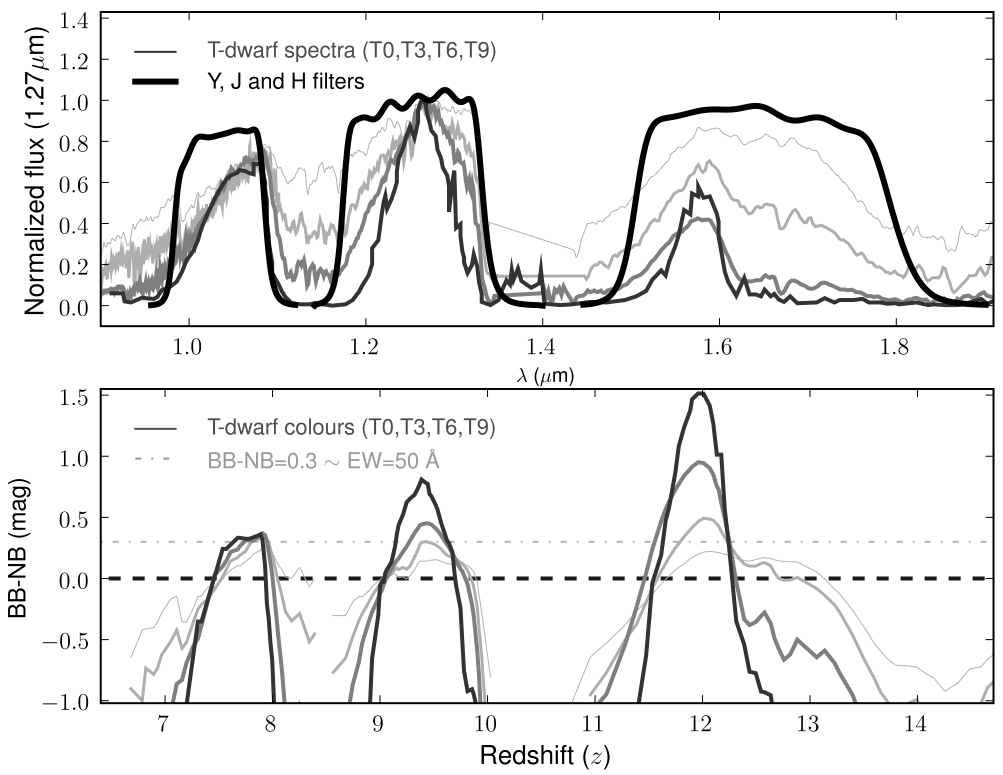
It may be thought that narrow-band Ly searches are immune to this contamination, since the initial emission-line galaxy selection relies on an excess flux observed in a narrow-band filter relative (usually) to a broad-band filter; only after that is the Lyman-break technique used to pick out the high-redshift Ly candidates from amongst the emission-line objects. However, the near-infrared continuum spectra of low mass brown dwarfs show considerable structure due to broad molecular absorption features (especially methane and ammonia; e.g. Leggett et al., 2007), as shown in the top panel of Figure 3. The lower panel of Figure 3 shows very clearly that T-dwarfs can easily produce a positive broad-band minus narrow-band (BB-NB) colour if the narrow-band filter is located within one of the spectral peaks (note that this is much less of an issue for surveys which difference two closely-located narrow-band filters). Ly narrow-band surveys in the redshift ranges , and may therefore be prone to contamination by cool Galactic stars – this includes the and atmospheric windows for narrow-band searches of Ly emitters. Narrow-band surveys at redshifts , or between – which includes both HiZELS () and the narrow-band component of the UltraVISTA Survey (; e.g. Nilsson et al 2007) – will be free of such contamination. Indeed, such surveys could potentially select very cool T-dwarf stars via a narrow-band deficit due to the strong methane absorption feature at these wavelengths.
With this result in mind, a T-dwarf search was conducted among narrow-band deficit sources in S09. These deficit sources were selected using equivalent criteria as for emitters (with a change in sign). None of the sources has z(AB), as expected for T-dwarfs (e.g. Leggett et al. 2007, Burningham et al. 2008), and even a selection imposing z(AB) results in a sample of only 9 galaxies which are all very well SED-fitted as galaxies with . These sources also present slightly higher and fluxes when compared to the best SED fit, but this can be explained by the H and [Oiii] contributing to the band and H to the band, which also explains the NBJ deficit. No T-dwarf candidate was found in our survey.
4 Summary
-
•
Deep narrow-band imaging in the band (m) has been used to search for bright Ly emitters at over an area of 1.4 deg2. No Ly emitter was found brighter than erg s-1.
-
•
The Ly luminosity function constraints at have been improved for 10 erg s-1 emitters. The results rule out significant positive evolution of the Ly LF beyond ; they are in line with recent semi-analytic & phenomenological model predictions, rejecting some extreme models.
-
•
It has been shown that for narrow-band searches, T-dwarfs can mimic Ly emitters at , and ; they will not contaminate the future UltraVISTA narrow-band survey (and can even be identified via a narrow-band deficit), but they may contaminate narrow-band Ly searches within the and atmospheric windows.
Acknowledgments
The authors thank the reviewer, Jon Willis, for relevant suggestions. DS would like to thank the Fundação para a Ciência e Tecnologia (FCT) for the doctoral fellowship SFRH/BD/36628/2007. PNB acknowledges the Royal Society. JEG & IRS thank the U.K. Science and Technology Facility Council (STFC) and KC acknowledges for a STFC Fellowship. The authors thank Cedric Lacey for providing the galform model data and Eduard Thommes for sending updated phenomonological model results. The authors would also like to thank Andy Adamson, Chris Davies, Luca Rizzi and Tim, Thor and Jack for the support on the UKIRT telescope and acknowledge UKIRT service time.
References
- Baugh et al. (2005) Baugh C. M., Lacey C. G., Frenk C. S., Granato G. L., Silva L., Bressan A., Benson A. J., Cole S., 2005, MNRAS, 356, 1191
- Bouwens et al. (2008) Bouwens R. J., Illingworth G. D., Franx M., Ford H., 2008, ApJ, 686, 230
- Burningham et al. (2008) Burningham et al. 2008, MNRAS, 391, 320
- Cuby et al. (2007) Cuby J.-G., Hibon P., Lidman C., Le Fèvre O., Gilmozzi R., Moorwood A., van der Werf P., 2007, AAP, 461, 911
- Dunkley et al. (2009) Dunkley et al. 2009, ApJS, 180, 306
- Geach et al. (2008) Geach J. E., Smail I., Best P. N., Kurk J., Casali M., Ivison R. J., Coppin K., 2008, MNRAS, 388, 1473
- Gronwall et al. (2007) Gronwall et al. 2007, ApJ, 667, 79
- Haiman & Cen (2005) Haiman Z., Cen R., 2005, ApJ, 623, 627
- Hu et al. (1998) Hu E. M., Cowie L. L., McMahon R. G., 1998, ApJL, 502, L99+
- Iye et al. (2006) Iye et al. 2006, Nature, 443, 186
- Kashikawa et al. (2006) Kashikawa et al. 2006, ApJ, 648, 7
- Koekemoer et al. (2007) Koekemoer et al. 2007, APJS, 172, 196
- Komatsu et al. (2009) Komatsu et al. 2009, ApJS, 180, 330
- Lawrence et al. (2007) Lawrence et al. 2007, MNRAS, 379, 1599
- Le Delliou et al. (2006) Le Delliou M., Lacey C. G., Baugh C. M., Morris S. L., 2006, MNRAS, 365, 712
- Leggett et al. (2007) Leggett S. K., Marley M. S., Freedman R., Saumon D., Liu M. C., Geballe T. R., Golimowski D. A., Stephens D. C., 2007, ApJ, 667, 537
- Malhotra & Rhoads (2004) Malhotra S., Rhoads J. E., 2004, ApJL, 617, L5
- McLure et al. (2006) McLure R. J., Jarvis M. J., Targett T. A., Dunlop J. S., Best P. N., 2006, MNRAS, 368, 1395
- McLure et al. (2006) McLure et al. 2006, MNRAS, 372, 357
- Nilsson et al. (2007) Nilsson K. K., Orsi A., Lacey C. G., Baugh C. M., Thommes E., 2007, A&A, 474, 385
- Orsi et al. (2008) Orsi A., Lacey C. G., Baugh C. M., Infante L., 2008, MNRAS, 391, 1589
- Ota et al. (2008) Ota et al. 2008, ApJ, 677, 12
- Ouchi et al. (2008) Ouchi et al. 2008, ApJS, 176, 301
- Richard et al. (2008) Richard J., Stark D. P., Ellis R. S., George M. R., Egami E., Kneib J.-P., Smith G. P., 2008, ApJ, 685, 705
- Scoville et al. (2007) Scoville et al. 2007, APJS, 172, 1
- Shimasaku et al. (2006) Shimasaku et al. 2006, PASJ, 58, 313
- Sobral et al. (2009) Sobral et al. 2009, ArXiv:0901.4114
- Stark et al. (2007) Stark D. P., Ellis R. S., Richard J., Kneib J.-P., Smith G. P., Santos M. R., 2007, ApJ, 663, 10
- Steidel et al. (1996) Steidel C. C., Giavalisco M., Pettini M., Dickinson M., Adelberger K. L., 1996, ApJL, 462, L17+
- Tanvir et al. (2009) Tanvir et al. 2009, ArXiv e-prints
- Thommes & Meisenheimer (2005) Thommes E., Meisenheimer K., 2005, A&A, 430, 877
- Willis & Courbin (2005) Willis J. P., Courbin F., 2005, MNRAS, 357, 1348
- Willis et al. (2008) Willis J. P., Courbin F., Kneib J.-P., Minniti D., 2008, MNRAS, 384, 1039