11email: nbekhti@astro.uni-bonn.de, 11email: fkenn@astro.uni-bonn.de 11email: bwinkel@astro.uni-bonn.de22institutetext: Institut für Physik und Astronomie, Haus 28, Karl-Liebknecht-Str. 24/25, 14476 Golm (Potsdam), Germany
22email: prichter@astro.physik.uni-potsdam.de 33institutetext: Australia Telescope National Facility, PO Box 76, Epping NSW 1710, Australia
33email: tobias.westmeier@csiro.au
High-resolution 21-cm observations of low-column density gas clumps in the Milky Way halo
Abstract
Aims. We study the properties of low-column density gas clumps in the halo of the Milky Way based on high-resolution 21-cm observations.
Methods. Using interferometric data from the Westerbork Synthesis Radio Telescope (WSRT) and the Very Large Array (VLA) we study H i emission at low-, intermediate- and high radial velocities along four lines of sight towards the quasars QSO J00032323, QSO B1331170, QSO B04501310, and J081331254503. Along these sightlines we previously have detected weak Ca ii and Na i absorbers in the optical spectra of these quasars.
Results. The analysis of the high-resolution H i data reveals the presence of several compact and cold clumps of neutral gas at velocities similar to the optical absorption. The clumps have narrow H i line widths in the range of km s-1, yielding upper limits for the kinetic temperature of the gas of K. The neutral gas has low H i column densities in the range of cm-2. All clumps have angular sizes of only a few arcminutes.
Conclusions. Our high-resolution 21-cm observations indicate that many of the Ca ii and Na i absorbers seen in our optical quasar spectra are associated with low-column density H i clumps at small angular scales. This suggests that next to the massive, high-column density neutral gas clouds in the halo (the common 21-cm low-, intermediate-, and high-velocity clouds, LVCs, IVCs, and HVCs) there exists a population of low-mass, neutral gas structures in the halo that remain mostly unseen in the existing 21-cm all-sky surveys of IVCs and HVCs. One of our absorbers may be associated with the Magellanic Stream, two intermediate-velocity clouds are probably part of the Intermediate-Velocity Spur and the Low-latitude IV arch, respectively. The remaining systems could be located either in the lower halo or in the disk of the Milky Way. The estimated thermal gas pressures of the detected H i clumps are consistent with what is expected from theoretical models of gas in the inner and outer Milky Way halo.
Key Words.:
Galaxy: halo – ISM: structure – quasars: absorption lines – Galaxies: halo1 Introduction
The disk of the Milky Way is surrounded by a gaseous halo that has an unknown extent. High-resolution absorption and emission line measurements have demonstrated that this halo contains a mixture of cool, warm and hot gas (e.g., Savage & Massa 1987; Majewski 2004; Fraternali et al. 2007, and references therein). Multi-wavelength observations of this gaseous material provide an insight into the different processes of the exchange of gaseous matter and energy between the galaxy and the intergalactic medium. There is a permanent mass circulation between the Milky Way disk and the halo via the Galactic fountain process (Shapiro & Field 1976; Bregman 1980; Shapiro & Benjamin 1991) where supernova explosions expel material out of the disk into the halo, where it cools and then falls back onto the Galactic plane. This gas enriches the circumgalactic environment with heavy elements. Also interactions with satellite galaxies inject interstellar material into the halo of the Milky Way (e.g., Mathewson et al. 1974). Finally, low-metallicity gas most likely is being accreted from the intergalactic medium (IGM; e.g., Wakker et al. 1999; Richter et al. 2001). These processes suggest that the gaseous material in the Milky Way halo is tightly connected to the on-going formation and evolution processes of our galaxy.
A large fraction of the neutral gas in the halo is in the form of clouds with radial velocities inconsistent with a simple model of Galactic rotation (e.g., Lockman 2002; Lockman et al. 2002), the so-called intermediate- and high-velocity clouds (IVCs, HVCs, Muller et al. 1963). IVCs are most likely located in the lower Galactic halo at kpc, whereas HVCs are thought to be located in the outer halo of galaxies at kpc (e.g., Sembach et al. 1991; van Woerden et al. 1999; Wakker 2001; Thom et al. 2006; Wakker et al. 2007, 2008).
Many IVCs and HVCs most likely have different origins, as expected from the various gas circulation processes in the halo outlined above. The bulk of IVCs are located close to the disk and appear to fall towards the Galactic plane, which could be explained by the Galactic Fountain model (Shapiro & Field 1976; Bregman 1980; Shapiro & Benjamin 1991). Some of the HVCs most likely emerge during interaction processes between the Milky Way and satellite galaxies due to merging and accretion. One prominent example is the Magellanic Stream, which appears to be a tidal feature from the Magellanic Clouds as they interact with the Milky Way (e.g., Mathewson et al. 1974). HVCs also have been brought into relation with primordial building blocks of galaxies in a hierarchical formation scenario (e.g., Oort 1966; Blitz et al. 1999).
A powerful method to analyse the characteristics of IVC and HVC gas at low redshifts is the analysis of high-resolution ultraviolet (UV) and optical absorption spectra together with H i 21-cm emission data (Richter 2006; Ben Bekhti et al. 2008). The combination of these data provides important information about the spatial distribution and the physical properties of the clouds.
This paper is based on our previous work (Ben Bekhti et al. 2008), in which we have analysed VLT/UVES (Ultraviolet and Visual Echelle Spectrograph) data of low-column density structures in the Milky Way halo. We have detected Ca ii (and in some cases also Na i ) absorption features at low, intermediate and high radial velocities along 35 sight lines (out of a sample of 103) towards high-redshift quasars (QSOs). For several of these sight lines counterparts in 21-cm H i emission were found using the 100-m radio telescope in Effelsberg.
In this work we concentrate on the follow-up study of H i 21-cm small- scale structures in directions that were previously observed with UVES and the Effelsberg telescope. Richter et al. (2005) observed one sight line (PKS 1448232) with particularly prominent high-velocity Ca ii and Na i absorption lines with UVES, Effelsberg, and the VLA. The VLA H i map resolves the HVC into several compact, cold clumps. Here, we present new high-resolution H i data of four other absorbing systems out of the sample of 35 sight lines. Using these observations it is possible to estimate important physical and chemical properties, e.g., lower distance and pressure limits, as well as Ca ii and Na i abundances.
Our paper is organised as follows. In Section 2 we describe the data acquisition and reduction. A presentation of the four sight lines observed with VLA and WSRT is given in Section 3. In Section 4, results regarding the properties of the observed small-scale structures are discussed. We conclude our study in Section 5.
2 Data acquisition and reduction
A detailed description of our UVES data and the initial H i 21-cm observations with the 100-m telescope at Effelsberg is provided in Ben Bekhti et al. (2008).
For four sight lines (QSO J00032323, QSO B1331170, QSO B04501310 and J081331254503) additional high-resolution data were obtained with the Very Large Array (VLA) and the Westerbork Synthesis Radio Telescope (WSRT). These data were used to search for small-scale structure within the diffuse gas clouds. Detailed information about the observations with both telescopes is provided in Table 1, showing the instrument used, the date of observation, the chosen configuration, the coordinates of the sources, field of view (), the spatial () and instrumental spectral resolution (), the bandwidth (), and the resulting noise level () in the final datacubes.
| Instrument | Date | Configuration | |||||||
|---|---|---|---|---|---|---|---|---|---|
| [m:y] | [] | [] | [] | [] | [km s-1] | [MHz] | |||
| WSRT | Feb. 2007 | 348.5 | 75.8 | 0.5 | 0.5 | 2.5 | 9.9 | ||
| Feb. 2007 | 196.9 | 28.6 | 0.5 | 0.5 | 2.5 | 8.5 | |||
| VLA | Feb. 2007 | DnC | 49.4 | -78.6 | 0.5 | 1.3 | 1.56 | 10.6 | |
| Feb. 2007 | DnC | 211.8 | -32.1 | 0.5 | 1.3 | 1.56 | 13.3 |
2.1 Westerbork Synthesis Radio Telscope (WSRT)
The fourteen 25-m antennas of the WSRT were used in the configuration, providing a good compromise between sensitivity and resolution. For our observations a correlator bandwidth of 2.5 MHz was chosen. The spectral channel width is with a total of 1024 channels. The observing time for both clouds was 12 h and additionally 1 h for the (primary) pre- and post-calibrators.
The WSRT data were analysed using the MIRIAD software package. The first step was to flag bad data points in the source and calibrator datasets, in order to exclude these during the following reduction tasks. The primary calibrators were used for the absolute flux, phase, gain, and bandpass calibration. Due to phase changes during the 12 h observation an additional relative phase calibration was necessary. For this purpose self-calibration was performed. Finally, dirty image data cubes were calculated via Fast Fourier Transformation (FFT) using a robust parameter of . The cubes were gridded such that they have a velocity width of per spectral channel. The CLEAN algorithm (Högbom 1974) was applied to reconstruct the image. The resulting data cubes and moment-0 maps were primary- beam-corrected.
2.2 Very Large Array (VLA)
The VLA observations were carried out using the twenty-nine 25-m radio antennas in the DnC configuration. This hybrid configuration consists of the south-eastern and south-western arms in the smallest (D) configuration and the northern arm in the larger C configuration. It is especially well suited for extended sources with a declination south of . For each of the two polarisations the correlator provides a bandwidth of 1.56 MHz with 256 spectral channels resulting in a channel separation of 1.3 km s-1.
The observing time for the sightline in the direction of QSO J00032323 was 6 h and 12 h for QSO B1331170 with additional 1 h allocated for the primary and secondary calibrators. The primary calibrators 0137331 and 0542498 were observed for about 30 min each at the beginning and the end of the observation periods. The secondary calibrators 0025260 and 0447220 were observed once every hour for about 5 minutes.
The VLA data of QSO B04501310B and QSO J00032333 were contaminated by many interferences and antenna failures. As both sources were observed on multiple occasions, the individual parts had to be handled separately and were merged only after self-calibration. The data reduction was performed with MIRIAD. First, a calibration based on the observed primary and secondary calibrators was done. A median filter was applied to the visibilities per baseline to remove outliers, and three malfunctioning antennas as well as obvious interferences were completely flagged. Along with continuum subtraction, an iterative self-calibration was carried out to account for phase changes during the observations. After merging the respective visibility sets, data cubes were calculated via FFT using a robust parameter of for QSO J00032333 and of for QSO B04501310B. In order to improve sensitivity, the beam was artificially increased to a size of by convolution with a Gaussian. The resulting data cubes have a velocity width of per spectral channel. Again, primary beam corrections were applied.
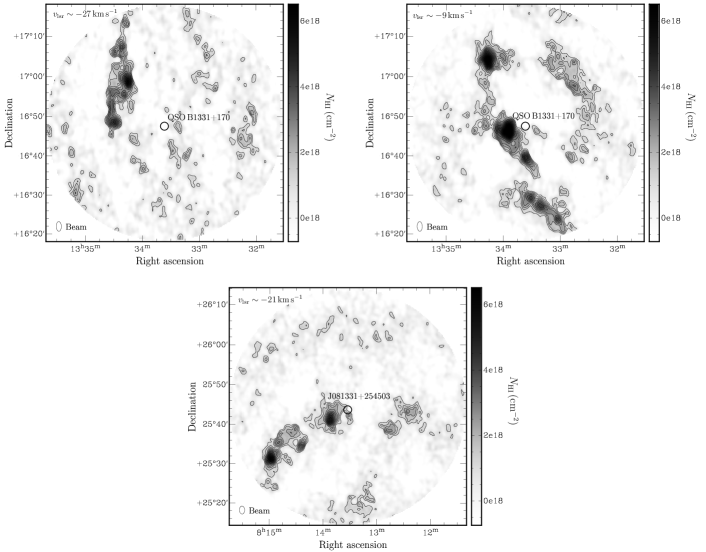
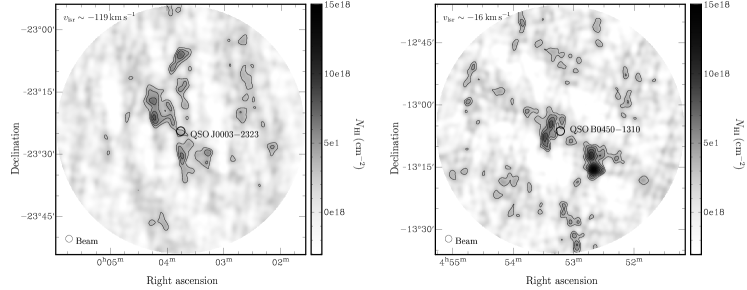
In Fig. 1 we show the H i (integrated) column densities of the QSO sightlines QSO B1331+170 and J081331+254503 associated to our absorbers. Figure 2 contains the maps for QSO J00032323 and QSO B04501310. The velocity ranges over which was integrated are given in the figure captions. Note, that the spectral widths of the sources are small, hence, we decided to not show position–velocity plots (or individual spectral maps). We have clipped the maps for radii larger than 0.5 degrees (which is the HPBW of the primary beam of the WSRT and VLA). To improve visualisation the maps shown in Fig. 1 and 2 were not corrected for the primary beam. Hence, they do not show true flux values. The clumps which have been analysed are presented in a subsequent section with primary beam correction applied. In case of the VLA observations, residual image artifacts (stripes) are visible in the maps. We carefully inspected the data cubes in adjacent (empty) velocity planes. There, non of these stripes are present. It might be, that the H i sources partially absorb the QSO continuum leading to baseline fitting problems. However, the clumps are detected with much higher significance than could be caused by the artificial emission. Nevertheless, the total column density of the clumps in direction of QSO J00032323 and QSO B04501310 may be overestimated by a few percent.
The datacubes were also inspected for emission at other radial velocities than that of the absorbers. In case of J081331+254503 we found few very weak ( cm-2) small clumps at km s-1. It was not further analysed, because here we are interested in the correlation between emission and absorption only. The other sight lines do not reveal additional sources.
In the next section we will present the results of the physical analysis of the clumps significantly detected.
3 The selected sight lines
Inspired by the results of Richter et al. (2005) and Ben Bekhti et al. (2008) we re-observed four sightlines (out of a sample of 35) that exhibit prominent Ca ii and/or Na i halo absorption features with high-resolution radio interferometers. The aim of this study is to search for small-scale structures embedded in the neutral hydrogen gas that were possibly not resolved with the single-dish Effelsberg telescope.
| Quasar | HVC/IVC | |||||||||
| [] | [] | [km s-1] | [ in cm-2] | [km s-1] | [ in cm-2] | [km s-1] | [ in cm-2] | [km s-1] | complex | |
| QSO J0003-2323 | 49.4 | 78.6 | 98 | 11.9 | 6 | - | - | - | - | MS |
| 112 | 11.8 | 6 | - | - | 19.6 | 19.3 | MS | |||
| 126 | 11.9 | 6 | - | - | - | - | MS | |||
| QSO B1331+170 | 348.5 | 75.8 | 9 | 12.4 | 11 | 11.3 | 6 | 18.9 | 2.7 | - |
| 27 | 12.0 | 5 | 11.3 | 3 | - | - | IV Spur | |||
| QSO B0450-1310B | 211.8 | 32.1 | 5 | - | - | 11.5 | 5 | 19.8 | 2.3 | - |
| 20 | - | - | 12.0 | 2 | 19.3 | 6.8 | - | |||
| J081331+254503 | 196.9 | 28.6 | 23 | - | - | 11.1 | 5 | 19.8 | 37.0 | (LLIV Arch) |
In this section, the results of the high-resolution radio observations of the four Ca ii and Na ii halo absorbers are presented. We also summarise briefly the results of the analysis of the Ca ii and Na i (UVES) and low- resolution H i (Effelsberg) data. Voigt profiles were fitted to the absorption lines, Gaussians were used to parametrise the emission lines. Table 2 lists the position, LSR velocities, Ca ii, Na i, and H i column densities, Doppler parameters , and the possibly associated IVC or HVC complexes. All of the UVES and Effelsberg spectra shown here are plotted in the local standard of rest (LSR) velocity frame. Most of the gas in emission and absorption near zero velocities belongs to the local Galactic disk. As described in Ben Bekhti et al. (2008), the decision whether the gas is connected to the Galactic disk or halo is made based on a Milky Way model developed by Kalberla (2003); Kalberla et al. (2007). The model predicts for each direction the expected velocities for interstellar gas participating in Galactic disk rotation. Hence, the deviation velocity (Wakker 1991) can be calculated and is used to classify the sources as IVCs or HVCs. The and detection limits for the Ca ii and Ca ii lines, respectively, correspond to a detection limit of . The parameters of all detected absorption and emission components for 35 sight lines are listed in Ben Bekhti et al. (2008).
| Quasar | Clump | Amplitude | |||||||||
| [h:m:s] | [d:m:s] | [km s-1] | [km s-1] | [km s-1] | [mJy/Beam] | [cm-2] | [K] | [K] | [] | ||
| QSO J00032323 | A | 00:03:46 | 23:05:55 | 1.8 | 5.2 | 200 | 3.1 | ||||
| B | 00:04:16 | 23:17:13 | 1.9 | 2.2 | 210 | 3.1 | |||||
| C | 00:04:14 | 23:21:13 | 1.9 | 2.0 | 220 | 3.4 | |||||
| D | 00:03:45 | 23:30:37 | 3.4 | 1.0 | 690 | 2.5 | |||||
| E | 00:03:17 | 23:29:43 | 1.4 | 2.0 | 110 | 2.2 | |||||
| QSO B1331170 | A | 13:34:29 | 16:48:59 | 2.5 | 1.0 | 370 | 2.9 | ||||
| (component 1) | B | 13:34:15 | 16:59:22 | 1.9 | 1.9 | 220 | 2.0 | ||||
| C | 13:34:30 | 17:06:42 | 3.4 | 0.9 | 700 | 1.7 | |||||
| D | 13:34:22 | 17:07:46 | 3.0 | 1.3 | 520 | 2.2 | |||||
| E | 13:34:29 | 17:14:17 | 1.5 | 1.0 | 140 | 1.7 | |||||
| F | 13:34:18 | 17:14:03 | 1.1 | 2.6 | 70 | 1.8 | |||||
| QSO B1331170 | G | 13:33:03 | 16:24:12 | 3.7 | 2.1 | 840 | 2.3 | ||||
| (component 2) | H | 13:33:20 | 16:27:30 | 2.4 | 2.1 | 350 | 2.2 | ||||
| I | 13:33:54 | 16:46:55 | 2.2 | 1.7 | 300 | 3.4 | |||||
| J | 13:34:17 | 17:04:54 | 2.5 | 2.4 | 360 | 3.9 | |||||
| QSO B04501310B | A | 04:52:40 | 13:15:40 | 4.6 | 2.2 | 1250 | 2.7 | ||||
| B | 04:52:43 | 13:12:16 | 4.2 | 1.2 | 1050 | 1.7 | |||||
| C | 04:52:18 | 13:12:58 | 4.0 | 1.2 | 960 | 1.8 | |||||
| D | 04:53:29 | 13:07:40 | 7.9 | 0.6 | 3700 | 1.5 | |||||
| E | 04:53:23 | 13:04:40 | 4.7 | 0.6 | 1300 | 1.4 | |||||
| J081331254503 | A | 08:14:59 | 25:31:15 | 3.6 | 2.5 | 800 | 2.7 | ||||
| B | 08:14:51 | 25:35:35 | 2.9 | 1.0 | 490 | 1.9 | |||||
| C | 08:14:25 | 25:34:50 | 1.5 | 1.6 | 130 | 1.6 | |||||
| D | 08:13:52 | 25:41:19 | 2.4 | 1.0 | 350 | 2.4 | |||||
| E | 08:12:44 | 25:38:52 | 2.2 | 0.6 | 280 | 2.4 | |||||
| F | 08:12:25 | 25:43:38 | 5.0 | 0.4 | 1500 | 3.0 |
Using the reduced high-resolution data cubes and the resulting column density maps, various physical parameters were derived. All structures above a threshold of (in the integrated column density maps) were considered in our analysis. From the moment-0 maps the peak column densities were inferred as well as the angular sizes of individual clumps (using the Gaussian radial fit method of the Karma task kvis). The latter, however, can only be considered rough estimates, as the clumps are neither necessarily spherical nor must have Gaussian column density profiles. The spectra containing the highest total flux were extracted, and Gaussian velocity profiles were fitted. This returned peak fluxes (which can be converted to peak brightness temperatures, ), velocity widths (leading to an upper temperature limit), and LSR velocities of each clump. Note, that velocity profile widths are not only given in FWHM but are also converted to -values to allow for better comparison with the absorption lines. The derived physical properties of the clumps are summarised in Table 3, containing the clump IDs, the coordinates, the velocities in the LSR frame, the FWHM derived from a Gauss fit and associated -values, the peak amplitudes, the peak H i column densities (with a typical error of about cm-2), the peak brightness temperatures, the upper temperature limits, and the mean radial sizes, (FWHM).
3.1 QSO J00032323
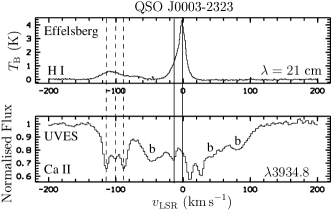
The upper panel of Figure 3 shows the multi-component Ca ii halo absorbers in the direction of QSO J00032323 as observed with UVES. Ca ii absorption at high velocities is detected with high significance () level, but no corresponding Na i is seen. The Ca ii absorption spreads between km s-1 having km s-1. A corresponding broad ( km s-1) 21-cm emission line is found in the Effelsberg data at km s-1 with an H i column density of about (see upper panel of Fig. 1). This absorbing system is kinematically compact, i.e., multiple components with comparable -values are spread over less than km s-1 (Ding et al. 2005). The position as well as the velocities of this Ca ii absorber indicate a possible association with the Magellanic Stream (Ben Bekhti et al. 2008).
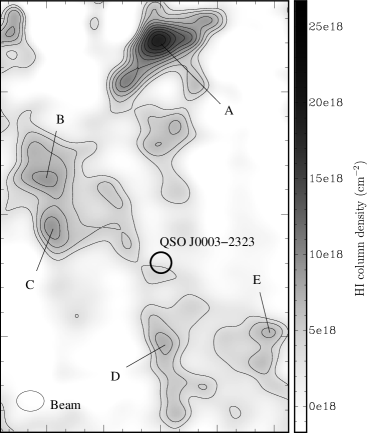
The lower panel of Figure 3 shows the high-resolution H i column density map of the high-velocity gas in the direction of QSO J00032323 integrated over km s-1, as observed with the VLA. The observations reveal the presence of several H i clumps. Clumps with ( cm-2) significance level are labelled with letters A to E.
The small-scale clumps have H i peak column densities of cm-2, except for clump A, which has cm-2, corresponding to peak brightness temperatures of K (clump A: 5 K). All clumps have angular diameters of (FWHM) and are mostly relatively isolated or only weakly connected to each other. However, this could be an instrumental effect as the interferometric data lack small spatial frequencies. Note also, that the clumps might not be resolved by the VLA beam, as the spatial features visible in the map match approximately the size of the beam (). This means that there could be even more substructure within the cores.
The line widths are very small with km s-1, typically, implying that the absorbing gas is cool with an upper temperature limit of K. Only clump D reveals slightly larger velocity widths, leading to an upper limit of K. An important point is that in the H i single dish and interferometric data only one emission line was detected, while the absorption measurements reveal a multi-component structure. There also exists a slight velocity offset between the Ca ii absorption components and the velocities of the H i clumps seen in emission (see Tables 2 & 3). This indicates that absorption and emission measurements trace somewhat different regions of the same overall structure. Fig. 1 (lower panel) shows that the quasar sightline do not pass any of the clumps directly, but rather traces the outer boundary of clump C, which is barely detected in 21-cm emission. The detection of multiple, relatively strong Ca ii absorption components towards QSO J00032323 thus indicates that there are additional, low-column density neutral gas structures along this sightlines that cannot be detected and/or resolved even with deep 21-cm synthesis observations. The complex spatial structure and kinematics of the outer layers of HVCs has been previously observed (Brüns 1998; Brüns et al. 2001; Ben Bekhti et al. 2006) and was also found in numerical simulations (Quilis & Moore 2001), pointing towards interactions of the clouds with the ambient medium, i.e., ram- pressure causing head-tail structures.
3.2 QSO B1331170
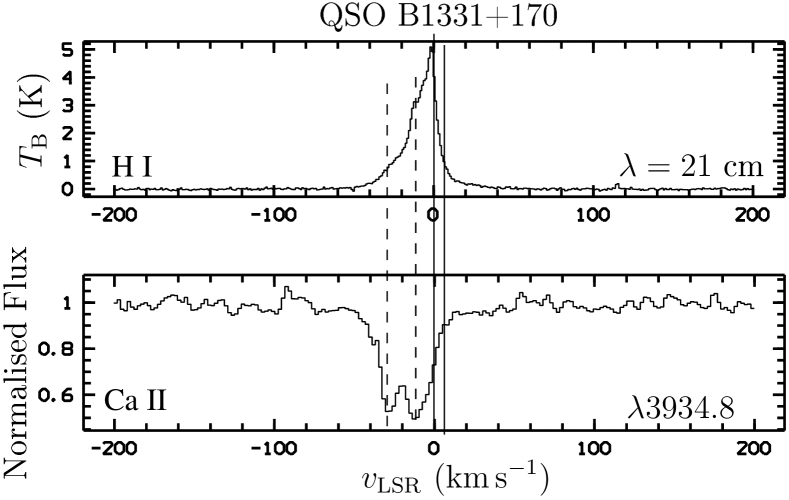
The intermediate-velocity Ca ii absorber towards QSO B1331170 is shown in the upper left panel of Figure 4. This two-component system is detected in Ca ii (at significance), as well as in Na i. The lines spread between km s-1. The position as well as the velocity of the line at km s-1 indicate a possible association with the intermediate-velocity complex IV Spur.
There is a corresponding H i line at km s-1 detected with the 100-m telescope at Effelsberg and possibly there is also a feature at km s-1, however, not detected clearly. The peak column density of the observed line is cm-2.
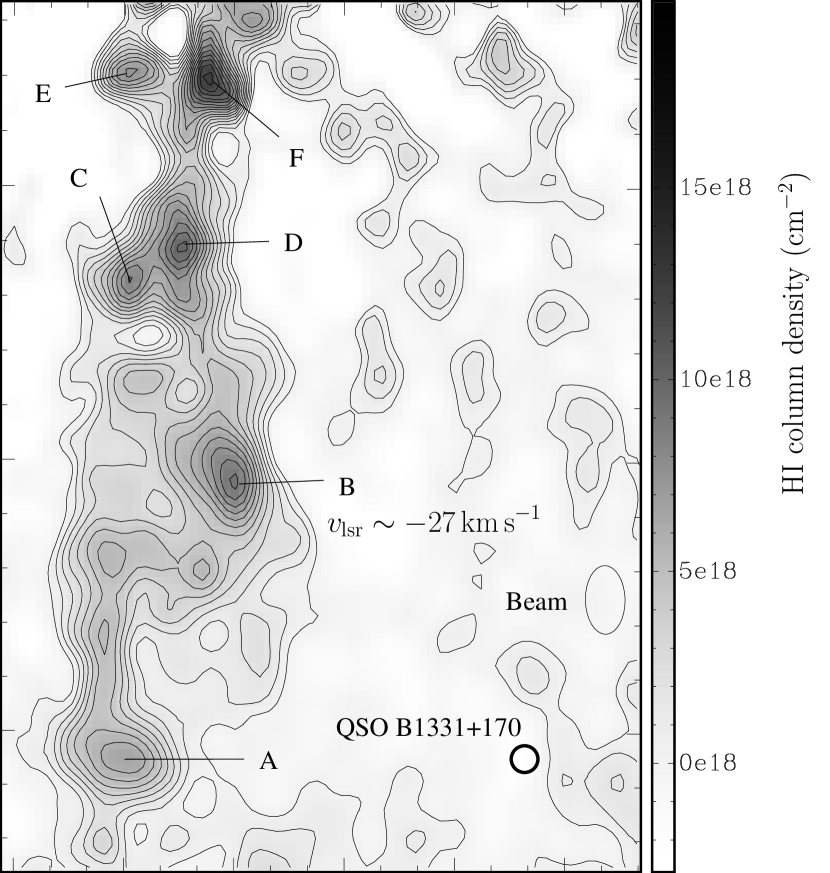
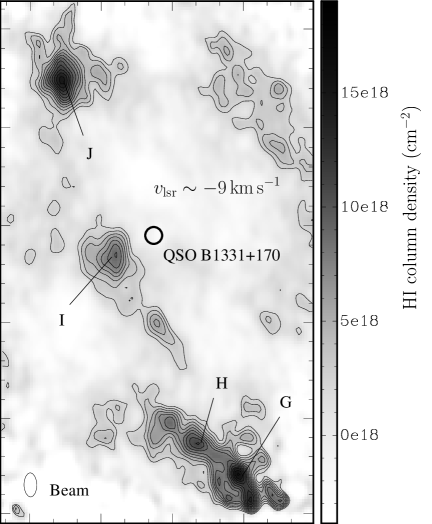
The high-resolution WSRT 21-cm column density map (integrated over km s-1 and km s-1, respectively) reveals the presence of two components at km s-1 (component 1) and km s-1 (component 2) nicely matching the absorption signatures in velocity. In the first case, six clumps are identified, labelled with letters A to F. The H i peak column densities range from about cm-2 to cm-2 and have peak brightness temperatures on the order of K. Compared to the other three sight lines and component 2, this structure is spatially more compact. Furthermore, the individual clumps are less isolated. For component 1 the spatial separation between the position of the quasar and the high-resolution emission is about . The angular diameter of the clumps is about . The line widths of the six clumps are in the range of km s-1 which implies that the absorbing gas has a temperature of K. Clump F has an extraordinarily small line width of only 1.8 km s-1 ( K). Component 2 exhibits four clumps (G to J) having larger column densities of cm-2 and peak brightness temperatures ( K).
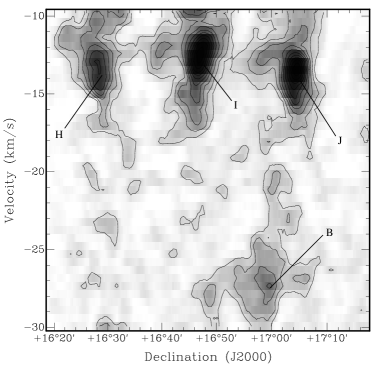
To check whether there is a physical connection between both components we computed an integrated position–velocity map; see Fig. 5. There is a faint emission feature connecting clump B and clump J, however the feature is close to the noise level (). Possibly, both components are due to an outflow, with component 2 being very close (in velocity) to the Milky Way emission. Component 1 might just represent a feature which has been expelled more recently (hence having a larger velocity).
3.3 QSO B04501310
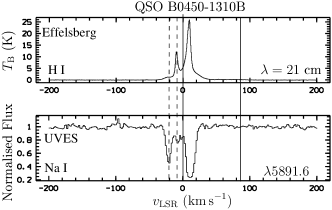
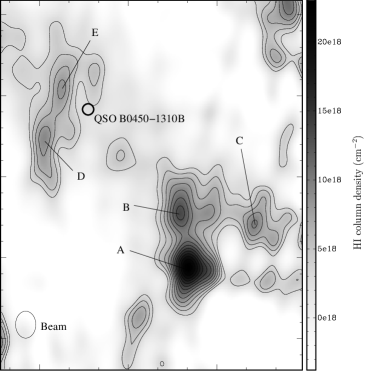
Figure 6 shows the two-component absorber at low and intermediate velocities towards QSO B04501310. Two Na i lines () were clearly detected at a and level, respectively. Unfortunately, no Ca ii data currently are available for this line of sight. The two absorption lines have central velocities of and km s-1. There is no obvious association with any known IVC complex.
For both components H i counterparts in the spectrum obtained with the 100-m telescope at Effelsberg were found, having small -values of and km s-1. Such narrow line widths were also measured for the Na i absorption lines ( km s-1). The column densities of both H i systems are relatively small with and . The Na i absorption line at reveals a larger column density and smaller width than the line at . Interestingly, this is the opposite of what is observed for the H i emission.
The H i high-resolution column density map (integrated over km s-1) obtained with the VLA displays two main structures consisting of few clumps each. Clumps with a significance level of ( cm-2) were labelled with letters A to E. The peak brightness temperatures are in the range of K, corresponding to H i column densities between cm-2 and cm-2. The angular diameters are very small with . The line widths of the clumps vary from about km s-1 up to km s-1 which correspond to upper temperature limits of K and K, which is much higher than derived for the other sight lines. The small-scale features lie at velocities of , which is close to the higher-column density absorption line, while the diffuse gas observed with the 100-m telescope is mainly found at different velocities. This shows again, that absorption and emission measurements sample somewhat different regions and gas phases within the overall cloud complex. Possibly, the gas interacts with an ambient medium, producing colder cores containing Na i in the interface region, while the diffuse gas is dragged away by ram pressure.
3.4 J081331254503
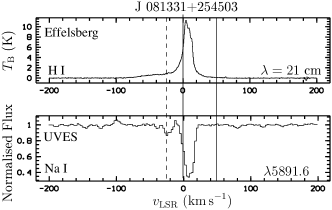
The only single-component absorber in our absorber sample lies in the direction of the quasar J081331254503 (see Figure 7). Na i absorption is detected at km s-1 at a level. There is no Ca ii spectrum available for this sight line. The corresponding Effelsberg H i emission line has a -value of about km s-1 and a column density of cm-2. There is no association with any known IVC complex.
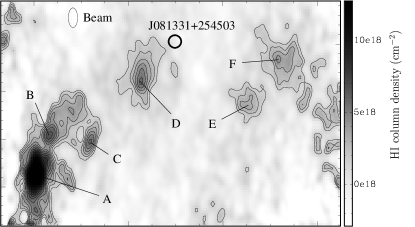
Figure 7 shows the WSRT 21-cm map of the intermediate-velocity gas in the direction of the quasar integrated over km s-1. The high-resolution observations reveal the presence of six H i clumps labelled with the letters A to F. These small-scale clumps () have typical peak H i column densities in the range of cm-2 and peak brightness temperatures of K. The line widths of km s-1 lead to an upper temperature limit of K. The mean radial velocity is km s-1 matching that of the absorption.
It might be possible that the clumps are part of the low-latitude IV arch (LLIV arch). However, they have slightly smaller radial velocities than reported for the LLIV arch (Wakker 2001) so that the association is unsure.
4 Discussion
As suggested by previous results (Richter et al. 2005), the follow-up observations with the WSRT and the VLA of four quasar sight lines that exhibit low-, intermediate- and high-velocity Ca ii (Na i) absorption in optical spectra reveal the presence of several compact H i clumps that are associated with the absorbers. Note, that in the case of the low-velocity sources (QSO B1331+170 component 2 and eventually QSO B04501310, both having ) it is unclear whether the sources are belonging to the Milky Way disc (at somewhat anomalous velocities due to turbulent motions) or tracing the interface region between the halo and the disc. All our clouds have H i column densities below which is lower than the median value reported by Heiles & Troland (2003) of (CNM) for disk clouds in the solar neighbourhood and also lower than the column densities of clouds at high forbidden velocities in the inner galaxy as found by Stil et al. (2006). On the other hand, Ford et al. (2008) find H i clouds in the lower halo dominated by galactic rotation with which is similar to our results. Hence, without knowing the distance to the sources we can not rule out one of the two possibilities.
In the following, we discuss the physical properties of these clumps.
4.1 Distance-dependent physical parameters
The coordinates as well as the radial velocities of QSO B1331170 (component 1) and QSO J00032323 suggest that the low-column density gas is part of the IVC complex IV Spur and the Magellanic Stream (MS), respectively. The clumps have an angular diameter of . Assuming that they are spherical and located at the same distance of about kpc as for IV Spur (Wakker 2001) and about kpc as for the MS (Yoshizawa & Noguchi 2003), the clumps have diameters of about pc (QSO B1331170) and pc (QSO J00032323), respectively. From this, we are able to estimate also other distance-dependent physical parameters such as mass and pressure of the gas. The total H i mass as a function of distance is given by
| (1) |
with being the mass of the hydrogen atom, the angular size of a resolution element (pixel) of the column density map ( for QSO B1331170 and for QSO J00032323) and the detected column density for each pixel in the map. The mean density of each clump can be determined using the measured peak column density, assuming a spherical symmetry of the clumps and a constant particle density :
| (2) |
Using the upper limit for the kinetic temperature, the derived particle density, and assuming an ideal gas, one gets an expression for the upper pressure limit
| (3) |
Inserting Equation (2) into Equation (3) provides the upper gas pressure limit (under the assumptions made before)
| (4) |
as a function of the (unknown) distance of the cloud, or as a function of height, , above the plane (considering the Galactic latitude, ). However, one major uncertainty here is the determination of angular sizes of the clumps, which could have a great impact if the clumps are not resolved.
| Quasar | clump | ||||
| [pc] | [] | [cm-3] | [cm-3 K] | ||
| QSO J00032323 | A | 45 | 470 | 0.14 | 27 |
| B | 45 | 280 | 0.06 | 14 | |
| C | 49 | 160 | 0.06 | 14 | |
| D | 36 | 150 | 0.06 | 45 | |
| E | 32 | 160 | 0.07 | 8 | |
| QSO B1331170 | A | 0.8 | 0.05 | 2.5 | 900 |
| B | 0.6 | 0.07 | 5.0 | 1100 | |
| C | 0.5 | 0.02 | 5.5 | 3800 | |
| D | 0.6 | 0.06 | 5.0 | 2600 | |
| E | 0.5 | 0.02 | 4.8 | 700 | |
| F | 0.5 | 0.05 | 7.9 | 600 |
Table 4 shows the distance-dependent parameters for the clumps observed in the directions of QSO B1331170 (1 kpc) and QSO J00032323 (50 kpc), for which a distance was assumed based on their association with known IVC or HVC complexes. The columns contain the the spatial diameters, the masses, the particle densities, and the upper pressure limits of the clumps.
The small line widths of the clumps, especially the ones towards QSO J00032323 (Section 3.1 and Table 3), indicate that the absorbing gas is cold with upper temperature limits of K for the clumps with the most narrow line widths of about km s-1 and K for the structures with the broadest values of km s-1. The temperatures could be even lower because effects like turbulent motions within the gas likely contribute to the observed line width. The temperatures and projected sizes of the clumps detected in the direction of QSO B1331170 and QSO J00032323 show that the clumps are compact and cold rather than diffuse and extended.
Due to the fact that the smallest spatial structures observed are of similar size as the synthesised WSRT and VLA beams it is possible that the observed clumps actually are not resolved and contain structures on even smaller scales. This raises the question whether IVCs and HVCs and their small-scale structures could have fractal properties, as discussed in Vogelaar & Wakker (1994). However, the answer to this question requires many more observations at different spatial resolutions.
We can now compare the determined upper pressure limits for the high-velocity absorbing system in the direction of QSO J00032323 and QSO B1331170 with the models of Wolfire et al. (1995). These authors calculated the thermal equilibrium gas temperature for HVCs in the Galactic halo as a function of height above the Galactic plane and find that stable two-phase gas exists only within a narrow pressure range. Note that both sources lie near the Galactic poles, hence the distance roughly equals the Galactic height. Various values for metallicities and dust-to-gas ratios were used to take different IVC and HVC origins into account. Under the assumption that the observed HVC in the direction of QSO J00032323 is associated with the Magellanic Stream, we compare the derived upper pressure limit of with the pressure range of cm-3 K for the HVC gas stripped from the MS, calculated using a metallicity of and a dust-to-gas ratio of (Wolfire et al. 1995). To remind the reader, refers to the mass of the small grain population, where implies that about 4% of the cosmic carbon is found in grains smaller than .
The observed values of clump A and D are relatively low but consistent with the models. The other structures reveal pressures not compatible with the simulations. However, as discussed before, the physical size of the clumps might be overestimated (if unresolved). In that case, the derived upper pressure limit would be underestimated.
For QSO B1331170 the simulated pressure range of cm-3 K (assuming a Galactic fountain origin, a metallicity of about 1.0 solar and a dust-to-gas ratio of ) or cm-3 K (metallicity of about 1.0 and a dust-to-gas ratio of ) is consistent with our observations.
For the two other sightlines toward QSO B04501310 and J081331254503, the lack of distance information for the halo clouds in these directions unfortunately impedes a similar pressure analysis.
4.2 On the metal abundances of the clumps
To better understand the nature and the origin of these low-column density, small-scale clumps in the halo and their relation to large IVC and HVC complexes it would be very helpful to constrain the chemical composition of these objects. Our optical observations provide column density information for the two species Ca ii and Na i, while the 21-cm observations give (H i).
However, there are a number of systematic effects that inhibit a reliable estimate for the absolute calcium and sodium abundances in the clouds. In diffuse neutral gas, Ca ii and Na i are not the dominant ionization stages of these elements because of their low ionization potentials compared to hydrogen and both elements usually are depleted into dust grains. Therefore, the measured Ca ii and Na i column densities in the halo absorbers are not expected to be representative for the total calcium and sodium abundances in the gas. Another severe systematic problem for determining the absolute abundances of these elements comes from the comparison of the absorption-line data with the H i 21-cm emission measurements. The beam sizes of the WSRT and the VLA still are very large compared to the pencil beam of the absorption measurements. Therefore, the H i column density values are just averages over a larger area on the sky, and the values at the quasar positions are not accurately known. In all our cases the quasar sightlines are located outside or at the edge of the H i clumps. There, one might just observe the Gaussian decline of the point spread function in a region where there might not even be any detectable signal at all. Also, the radial velocities and the component structure of the absorption lines are different than those seen in 21-cm emission. This points towards small-scale structure in the gas that is not detected and/or resolved in the beam-smeared H i data.
Despite all these substantial uncertainties, ionic gas phase abundances, , for Ca ii and Na i (relative to H i) have been published for a large number of Milky Way disk and halo absorbers (e.g., Wakker 2001; Wakker & Mathis 2000), implying that for each ion scales with H i in a different manner and with different scatter. As an example, we compare the ionic gas phase abundance of Na in the halo absorber towards QSO B04501310B with these previous observations. We choose the QSO B04501310B sightlines as it passes relatively close to one of the H i clumps seen in the high- resolution 21-cm data (Fig. 3). For the halo absorber towards QSO B04501310B a column density of cm-2 was measured by the VLA ( cm-2). The associated Na i abundance is , which is about seven times larger than Na i abundances previously measured in diffuse halo clouds (, ; Wakker 2001; Wakker & Mathis 2000). However, Wakker (2001) points out that the Ca ii (Na i) abundance in IVC and HVC gas varies by a factor of 2–5 (10) within and by a factor 5–10 (100) between clouds. Since all our clouds generally are of low column density, this substantial scatter makes it impossible to draw any meaningful conclusions about the Ca and Na abundances and overall metallicities of the absorbers based solely on our Ca ii and Na i measurements.
A much more reliable method to study the metal content of weak halo absorbers is the analysis of UV and FUV spectra, as obtained with FUSE and HST/STIS. Richter et al. (2008) recently have studied the metallicities in seven low-column density high-velocity absorbers by comparing the column densities of O i with that of H i. The ratio O i/H i is a very robust measure for the metallicity of the gas, as it does not depend on ionization effects and dust depletion. In this study, has been derived from FUV absorption data by fitting the higher Lyman series lines in absorption against the quasars, but not from beam-smeared 21-cm emission observations. The UV measurements indicate that similar as for the large IVC and HVC complexes, low-column density halo clouds span an abundance range between 0.1 and 1.0 solar, suggesting multiple (galactic and extragalactic) origins for the absorbers. Also relative abundance ratios (e.g., Fe/Si) have been used to constrain the enrichment history of these clouds (see Richter et al. 2008). Interestingly, the simultaneous detection of Ca ii and other low ions such as O i, Si ii, and Fe ii in two high-velocity systems towards PHL 1811 implies that the high-velocity Ca ii absorbers considered in this study and the weak UV absorption systems studied by Richter et al. (2008) trace the same population of low-column density halo clouds.
5 Conclusions
In this paper we have presented high-resolution H i observations with the WSRT and the VLA for four lines of sight through the Galactic halo were we previously detected weak low-, intermediate-, and high-velocity gas in Ca ii and Na i absorption. Along these four sightlines, we detected one high-velocity cloud (probably belonging to the Magellanic Stream) seen in Ca ii and Na i absorption and 21-cm emission. The other four detected features show low-velocity gas (). One of these systems is likely associated with the IV spur, another one is eventually part of the LLIV arch, both being IVC complexes. For the two remaining clouds we can not finally decide whether they are part of the Milky Way disk or are located in the (lower) Galactic halo. The major results of our study are:
-
1.
Along all four sightlines our high-resolution H i observations reveal the presence of cold, compact (sub-pc scale, except those associated with the Magellanic Stream) neutral gas clumps associated with Ca ii and Na i absorbers. The intermediate- and high-velocity systems are located in the Milky Way halo, whereas the low-velocity features are either located in the lower halo or in the Milky Way disk.
-
2.
The detected clumps have low peak column densities of cm-2. This, together with their small angular sizes ( arcmin, typically), suggest that these small-scale H i structures are unseen and/or unresolved in current H i 21-cm all-sky surveys.
-
3.
The H i line widths of the clumpy structures are relatively narrow ( km s-1), leading to upper limits for the kinetic temperature in the range K.
-
4.
In all four directions, the quasar sightlines used for the absorption spectra pass the outer envelopes of the clumps or the inter-clump medium, but do not pass the clump-cores. The presence of narrow Ca ii and Na i absorption along these sightlines demonstrates that additional small-scale structure exists at column densities below the detection limit of the high- resolution H i 21-cm observations.
-
5.
The sky positions as well as the radial velocities of the halo absorber towards QSO J00032323 and QSO B1331170 indicate a possible association with the Magellanic Stream and IV Spur, respectively. Using available distance information for these halo clouds we are able constrain distance-dependent physical parameters such as gas mass and thermal pressure. The derived parameters match the values predicted by the models of Wolfire et al. (1995).
Our study indicates that there exists a substantial degree of small-scale structure in the neutral galactic halo gas that can only be traced with high- resolution H i 21-cm observations and with quasar absorption-line spectroscopy. The combination of the various data sets shows, how important measurements at different wavelengths and resolutions are to get a more realistic view of the distribution and physical properties of neutral gas structures in the Milky Way halo.
Using radio synthesis telescopes, we will continue the search for small-scale structures that are not resolved with the Effelsberg telescope. Moreover, we will proceed with our effort to systematically study absorption features in the Galactic halo along quasar sightlines using optical instruments and future space-based UV spectrographs. Such combined high-resolution emission and absorption observations will be of crucial importance to better understand the spatial distribution of gaseous structure in the inner and outer halo of the Milky Way and their relation to intervening quasar absorption-line systems at low and high redshift.
Acknowledgements.
P.R. and N.B.B. acknowledge financial support by the German Deutsche Forschungsgemeinschaft, DFG, through Emmy-Noether grant Ri 1124/3-1.References
- Ben Bekhti et al. (2006) Ben Bekhti, N., Brüns, C., Kerp, J., & Westmeier, T. 2006, A&A, 457, 917
- Ben Bekhti et al. (2008) Ben Bekhti, N., Richter, P., Westmeier, T., & Murphy, M. T. 2008, accepted in A&A, 806
- Blitz et al. (1999) Blitz, L., Spergel, D. N., Teuben, P. J., & Hartmann, D. 1999, in Astronomical Society of the Pacific Conference Series, Vol. 166, Stromlo Workshop on High-Velocity Clouds, ed. B. K. Gibson & M. E. Putman, 125–+
- Brüns (1998) Brüns, C. 1998, in Astronomische Gesellschaft Meeting Abstracts, 5
- Brüns et al. (2001) Brüns, C., Kerp, J., & Pagels, A. 2001, A&A, 370, L26
- Bregman (1980) Bregman, J. N. 1980, ApJ, 236, 577
- Ding et al. (2005) Ding, J., Charlton, J. C., & Churchill, C. W. 2005, ApJ, 621, 615
- Ford et al. (2008) Ford, H. A., McClure-Griffiths, N. M., Lockman, F. J., et al. 2008, ApJ, 688, 290
- Fraternali et al. (2007) Fraternali, F., Binney, J., Oosterloo, T., & Sancisi, R. 2007, New Astronomy Review, 51, 95
- Högbom (1974) Högbom, J. A. 1974, A&AS, 15, 417
- Heiles & Troland (2003) Heiles, C. & Troland, T. H. 2003, ApJ, 586, 1067
- Kalberla (2003) Kalberla, P. M. W. 2003, ApJ, 588, 805
- Kalberla et al. (2007) Kalberla, P. M. W., Dedes, L., Kerp, J., & Haud, U. 2007, A&A, 469, 511
- Lockman (2002) Lockman, F. J. 2002, ApJ, 580, L47
- Lockman et al. (2002) Lockman, F. J., Murphy, E. M., Petty-Powell, S., & Urick, V. J. 2002, ApJS, 140, 331
- Majewski (2004) Majewski, S. 2004, in Astronomical Society of the Pacific Conference Series, Vol. 327, Satellites and Tidal Streams, ed. F. Prada, D. Martinez Delgado, & T. J. Mahoney, 63–+
- Mathewson et al. (1974) Mathewson, D. S., Cleary, M. N., & Murray, J. D. 1974, ApJ, 190, 291
- Muller et al. (1963) Muller, C. A., Oort, J. H., & Raimond, E. 1963, C. R. Acad. Sc. Paris, 257, 1661
- Oort (1966) Oort, J. H. 1966, Bull. Astron. Inst. Netherlands, 18, 421
- Quilis & Moore (2001) Quilis, V. & Moore, B. 2001, ApJ, 555, L95
- Richter (2006) Richter, P. 2006, in Reviews in Modern Astronomy, Vol. 19, Reviews in Modern Astronomy, ed. S. Roeser, 31–+
- Richter et al. (2008) Richter, P., Charlton, J. C., Fangano, A. P. M., Ben Bekhti, N., & Masiero, M. 2008, AJ, in press
- Richter et al. (2005) Richter, P., Westmeier, T., & Brüns, C. 2005, A&A, 442, L49
- Savage & Massa (1987) Savage, B. D. & Massa, D. 1987, ApJ, 314, 380
- Sembach et al. (1991) Sembach, K. R., Savage, B. D., & Massa, D. 1991, ApJ, 372, 81
- Shapiro & Benjamin (1991) Shapiro, P. R. & Benjamin, R. A. 1991, PASP, 103, 923
- Shapiro & Field (1976) Shapiro, P. R. & Field, G. B. 1976, ApJ, 205, 762
- Stil et al. (2006) Stil, J. M., Lockman, F. J., Taylor, A. R., et al. 2006, ApJ, 637, 366
- Thom et al. (2006) Thom, C., Putman, M. E., Gibson, B. K., et al. 2006, ApJ, 638, L97
- van Woerden et al. (1999) van Woerden, H., Schwarz, U. J., Peletier, R. F., Wakker, B. P., & Kalberla, P. M. W. 1999, Nature, 400, 138
- Vogelaar & Wakker (1994) Vogelaar, M. G. R. & Wakker, B. P. 1994, A&A, 291, 557
- Wakker (1991) Wakker, B. P. 1991, A&A, 250, 499
- Wakker (2001) Wakker, B. P. 2001, ApJS, 136, 463
- Wakker & Mathis (2000) Wakker, B. P. & Mathis, J. S. 2000, ApJ, 544, L107
- Wakker et al. (2007) Wakker, B. P., York, D. G., Howk, J. C., et al. 2007, ApJ, 670, L113
- Wakker et al. (2008) Wakker, B. P., York, D. G., Wilhelm, R., et al. 2008, ApJ, 672, 298
- Wolfire et al. (1995) Wolfire, M. G., McKee, C. F., Hollenbach, D., & Tielens, A. G. G. M. 1995, ApJ, 453, 673
- Yoshizawa & Noguchi (2003) Yoshizawa, A. M. & Noguchi, M. 2003, MNRAS, 339, 1135