A Test of Star Formation Laws in Disk Galaxies
Abstract
We use observations of the radial profiles of the mass surface density of total, , and molecular, , gas, rotation velocity and star formation rate surface density, , of the molecular dominated regions of 12 disk galaxies from Leroy et al. to test several star formation laws: a “Kennicutt-Schmidt power law”, ; a “Constant molecular law”, ; the “Turbulence-regulated laws” of Krumholz & McKee (KM) and Krumholz, McKee & Tumlinson (KMT), a “Gas- law”, ; and a shear-driven “GMC collisions law”, , where . We find the constant molecular law, KMT turbulence law and GMC collision law are the most accurate, with an rms error of a factor of 1.5 if the normalization constants are allowed to vary between galaxies. Of these three laws, the GMC collision law does not require a change in physics to account for the full range of star formation activity seen from normal galaxies to circumnuclear starbursts. A single global GMC collision law with , i.e. a gas consumption time of 20 orbital times for , yields an rms error of a factor of 1.8.
1 Introduction
Understanding the rate at which stars form from gas is of fundamental importance for a theory of galaxy evolution. At the moment it is uncertain what physical process or processes drive star formation rates (SFRs). Locally, we know star formation occurs mostly in highly clustered, parsec-scale regions within giant molecular clouds (GMCs) (Lada & Lada 2003; Gutermuth et al. 2009). This clustered mode appears to also be important in a wide range of galactic environments, including dwarf irregular galaxies (Dowell, Buckalew, & Tan 2008), normal disk galaxies (Larsen 2009), and starburst galaxies (Fall et al. 2005; McCrady & Graham 2007). The total efficiency, , of conversion of gas into stars in these clusters is relatively high, with . However, on the scale of GMCs star formation occurs at a relatively slow, inefficient rate, such that only a few percent of the GMC mass is converted to stars per free-fall time (Zuckerman & Evans 1974; Krumholz & Tan 2007). Although GMCs appear to be gravitationally bound and approximately virialized (Solomon et al. 1987; Bolatto et al. 2008), at any given time, most of the mass and volume of GMCs is not forming stars, perhaps because it is magnetically subcritical (e.g. Heyer et al. 2008).
Starting with the pioneering work of Schmidt (1959, 1963), empirical correlations have been found between the disk plane surface density of SFR, , and the surface density of gas — either the total, , or just that in the molecular phase, . Based on about 100 disk averages of nearby galaxies and circumnuclear starbursts, Kennicutt (1998, hereafter K1998) found
| (1) |
with , , and . Most of the dynamic range determining this relation covers the molecular dominated conditions of the disks in the centers of normal galaxies and in starbursts. Kennicutt et al. (2007) found a similar relation applied on kpc scales in M51a. Theoretical and numerical models that relate the SFR to the growth rate of large scale gravitational instabilities in a disk predict (e.g. Larson 1988; Elmegreen 1994, 2002; Wang & Silk 1994; Li, Mac Low, & Klessen 2006), as long as the gas scale height does not vary much from galaxy to galaxy. However, the growth rate of large scale instabilities that lead to the formation of GMCs cannot be the rate limiting step for star formation in disks that already have most of their gas mass in the molecular phase in the form of gravitationally bound GMCs. Rather, one should consider the processes that create the actively star-forming, presumably magnetically supercritical, parsec-scale clumps of gas within GMCs, which then become star clusters.
Based on a study of 12 nearby disk galaxies at 800 pc resolution, Leroy et al. (2008) (see also Bigiel et al. 2008) concluded that
| (2) |
with and . The values of covered a range from . Such a law has also been proposed as a component of the “pressure-regulated” model of Blitz & Rosolowsky (2006) in which pressure sets the molecular gas fraction and then molecular gas forms stars with constant efficiency. A law similar to eq. (2) has been implemented by Shetty & Ostriker (2008) and, for volume densities, by Kravtsov (2003). Leroy et al. suggest these results indicate that GMCs in these galaxies have approximately uniform properties, e.g. density, and thus are forming stars at a constant rate per free-fall time, as is expected if they are supersonically turbulent (Krumholz & McKee 2005, hereafter KM2005). Such a law was implemented in the simulations of Dobbs & Pringle (2009), which are able to reproduce the results of Bigiel et al. (2008) and Leroy et al. (2008). However, to explain the K1998 data for higher systems would require a change in the cloud properties to allow them to form stars at a faster rate.
KM2005 extended their model of turbulence-regulated star formation to predict galactic star formation rates by assuming GMCs are virialized and that their surfaces are in pressure equilibrium with the large scale interstellar medium (ISM) pressure of a Toomre (1964) disk, predicting
| (3) |
with , the mass fraction of gas in GMCs, the ratio of the mean pressure in a GMC to the surface pressure here normalized to a fiducial value of 6 but estimated to vary as , , and being , the orbital angular frequency, in units of . We will assume based on resolved studies of GMC populations and molecular gas content in the Milky Way and nearby galaxies (Solomon et al. 1987; Blitz et al. 2007).
Krumholz, McKee & Tumlinson (2009a, hereafter KMT2009) presented a two component star formation law
| (6) |
with . GMCs are assumed to be in pressure equilibrium with the ISM only in the high regime. In the low regime, GMCs are assumed to have constant internal pressures set by H II region feedback (Matzner 2002).
K1998 showed that, in addition to being fit by eq. (1), his galaxy and circumnuclear starburst data could be just as well described by
| (7) |
where and is evaluated at the outer radius that is used to perform the disk averages. Equation (7) implies that a fixed fraction, about 10%, of the gas is turned into stars every outer orbital timescale of the star-forming disk and motivates theoretical models that relate star formation activity to the dynamics of galactic disks. Such models are appealing as their predicted star formation activity per unit gas mass, i.e. the gas consumption time, is self-similar, depending only on the local orbital time. Examples of these models include those in which star formation is triggered by passage of gas through spiral density waves (e.g. Wyse & Silk 1989). However, there is no evidence that galactic SFRs depend on density wave amplitude (e.g. Kennicutt 1989). Rather, where present, density waves appear to simply help organize gas and star formation within a galaxy.
Noting that in the main star-forming parts of galactic disks a large fraction of total gas is associated with gravitationally bound GMCs and that most stars form in clustered regions in these clouds, Tan (2000, hereafter T2000) proposed a model of star formation triggered by GMC collisions in a shearing disk, which reproduces eq. (7) in the limit of a flat rotation curve since the collision time is found to be a short and approximately constant fraction, , of the orbital time, . The collision times of GMCs in the numerical simulations of Tasker & Tan (2009) confirm these results. The T2000 model assumes a Toomre parameter of order unity in the star-forming part of the disk, a significant fraction (e.g. ) of total gas in gravitationally bound clouds, and a velocity dispersion of these clouds set by gravitational scattering (Gammie et al. 1991). Then, the predicted SFR is
| (8) |
where and is the circular velocity at a particular galactocentric radius . Note for a flat rotation curve. There is a prediction of reduced SFRs compared to eq. (7) in regions with reduced shear, i.e. typically the inner parts of disk galaxies.
Leroy et al. (2008) (see also Wong & Blitz 2002; Bigiel et al. 2008) examined the applicability of some of the above star formation laws for the galaxies in their sample. In this Letter we revisit this issue, concentrating on the radial profiles of the molecular dominated regions of the 12 disk galaxies studied by Leroy et al.
2 Methodology
| Galaxy | d | aaUnits: | aaUnits: | aaUnits: | aaUnits: | ||||||||||
|---|---|---|---|---|---|---|---|---|---|---|---|---|---|---|---|
| NGC: | (Mpc) | (kpc) | () | () | () | () | () | () | () | () | () | () | () | ||
| 628 | 7.3 | 3.7 | 11 | 11.0 | 6.71 | 6.41 | 11.8 | 0.750 | 32.1 | 3.75 | 10.0 | 4.05 | 22.9 | 5.37 | 11.8 |
| 2841 | 14.1 | 7.9 | 7 | 14.0 | 8.72 | 5.50 | 7.53 | 1.07 | 16.2 | 2.22 | 5.83 | 6.00 | 8.39 | 6.01 | 8.28 |
| 3184 | 11.1 | 5.1 | 10 | 7.43 | 4.40 | 4.63 | 9.87 | 1.60 | 15.5 | 2.80 | 12.1 | 6.43 | 9.68 | 11.7 | 11.7 |
| 3198 | 13.8 | 1.7 | 3 | 27.0 | 10.1 | 14.9 | 8.58 | 4.82 | 17.6 | 7.69 | 18.6 | 20.2 | 19.6 | 48.3 | 26.5 |
| 3351 | 10.1 | 4.7 | 10 | 23.4 | 27.1 | 10.6 | 14.4 | 1.57 | 7.14 | 5.12 | 24.8 | 8.85 | 8.67 | 10.9 | 13.3 |
| 3521 | 10.7 | 6.5 | 13 | 5.19 | 4.56 | 4.22 | 1.97 | 1.25 | 20.6 | 3.14 | 5.19 | 4.64 | 13.0 | 6.26 | 2.11 |
| 3627 | 9.3 | 7.4 | 17 | 8.32 | 34.2 | 5.77 | 25.3 | 2.08 | 35.4 | 3.77 | 24.9 | 7.90 | 36.8 | 9.90 | 25.7 |
| 4736 | 4.7 | 1.7 | 8 | 14.8 | 21.8 | 13.8 | 20.5 | 1.02 | 40.9 | 10.8 | 10.2 | 4.82 | 33.8 | 5.34 | 27.2 |
| 5055 | 10.1 | 8.6 | 18 | 4.88 | 16.3 | 3.92 | 10.5 | 1.51 | 34.9 | 2.76 | 8.88 | 5.22 | 29.9 | 5.82 | 21.1 |
| 5194 | 8.0 | 6.0 | 16 | 5.79 | 28.7 | 5.84 | 25.8 | 1.71 | 36.7 | 4.50 | 20.9 | 5.64 | 33.1 | 6.76 | 26.1 |
| 6946 | 5.9 | 5.9 | 21 | 6.88 | 29.1 | 6.45 | 19.5 | 2.59 | 29.0 | 4.73 | 17.5 | 8.31 | 29.4 | 11.5 | 18.2 |
| 7331 | 14.7 | 6.8 | 10 | 7.47 | 5.61 | 4.93 | 2.74 | 1.26 | 26.7 | 3.31 | 5.09 | 5.39 | 17.2 | 6.98 | 5.14 |
| =12 | 144 | 22.1 | 16.8 | 29.7 | 16.1 | 26.3 | 18.8 | ||||||||
| =1 | 144 | 8.17 | 29.4 | 5.95 | 22.2 | 1.57 | 32.8 | 3.92 | 21.8 | 6.24 | 28.4 | 8.05 | 24.9 |
We consider the data on , , , and for the 12 large disk galaxies (see Table 1) analyzed by Leroy et al. (2008), and we refer the reader to this paper for the details of how these quantities were estimated. Note that and depend on the estimated rotation curves of the galaxies. The Leroy et al. (2008) analysis uses analytic fits to the observed rotation curves, since the derivatives of the actual observed curves can be very noisy.
We only consider regions where the molecular gas dominates over atomic, i.e. , since it is here that we expect a significant fraction of the total gas to be associated with gravitationally bound clouds — an assumption of the T2000 and KM2005 theories — and since we also wish to avoid regions affected by star formation thresholds (Martin & Kennicutt 2001). This requirement defines an outer radius, , for each galaxy. Note that NGC 2841 has no detected gas in its central region out to about 3.5 kpc, so we only consider annuli from this radius out to for this galaxy. The requirement that also leads us to exclude analysis of the 11 H I dominated, low-mass galaxies in the Leroy et al. (2008) sample, which have only upper limits on .
We use these data to compare the predicted from: a “Kennicutt-Schmidt power law” with (eq. 1); a “Constant molecular law” (eq. 2); a “KM2005 turbulence-regulated law” (eq. 3); a “KMT2009 turbulence-regulated law” (eq. 6) a “Gas- law” (eq. 7); and a “GMC collision law” (eq. 8), with the observed values, , averaged in annuli of typical width pc. For each galaxy and each star formation law we derive the best fit values of , , , and , respectively, weighting all annuli equally, and we measure the rms factor by which the theoretical model errs in estimating the SFR as , where , and . We also derive values of for the entire galaxy sample for the case where each galaxy is allowed one free parameter () and for the case where there is a single star formation law with one free parameter. As discussed by KM2005, these are not traditional goodness-of-fit statistics, but the factor does give a measure of how well the theoretical model reproduces the observed system. Note that the models vary in the number of observables they depend on and so measurement errors will introduce varying degrees of dispersion.
3 Results & Discussion
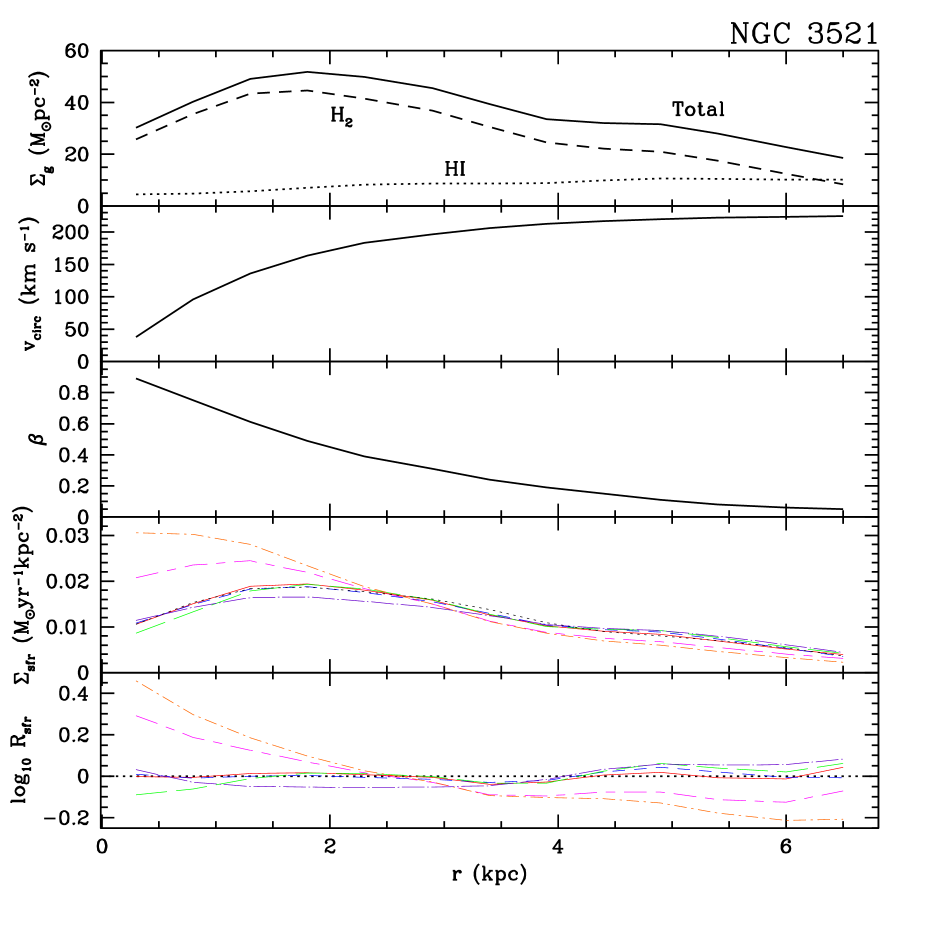
Figure 1 shows an example of our method applied to galaxy NGC 3521, displaying the observed profiles of molecular, atomic and total gas content, , , observed and predicted and . In this galaxy the star formation laws based on conversion of molecular gas at fixed rate and based on GMC collisions provide the best fit to the observations.
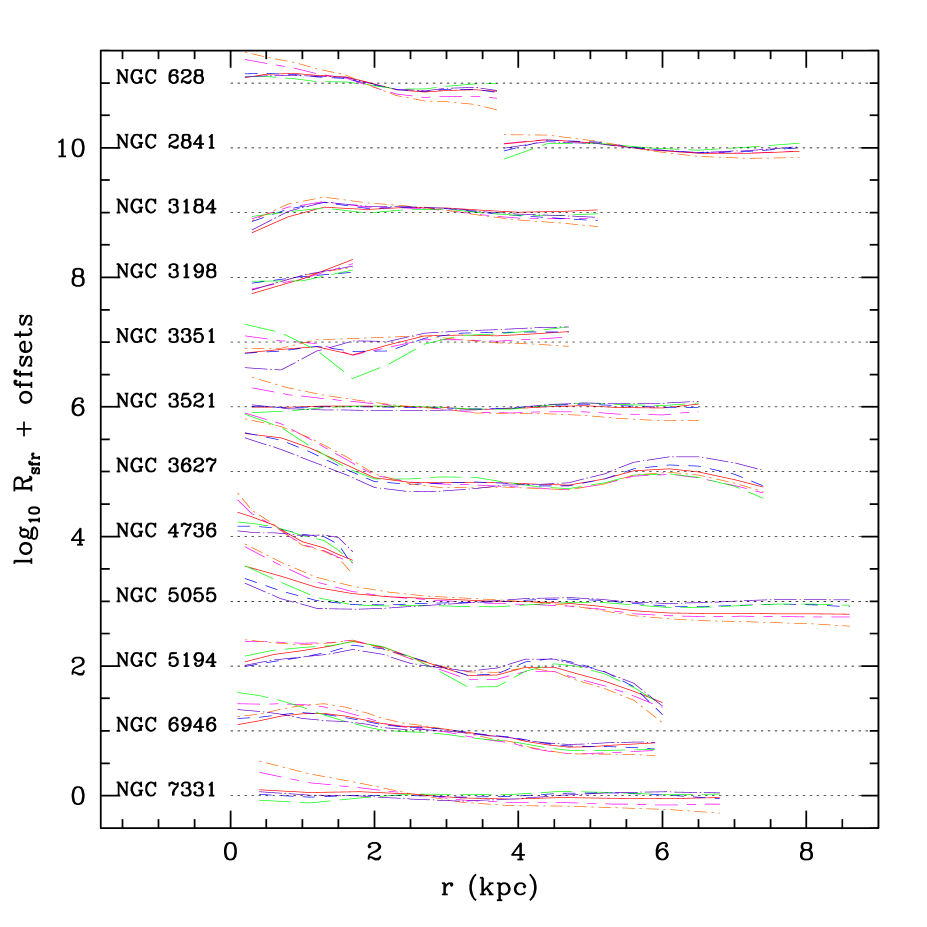
Figure 2 shows for the entire sample of disk galaxies and Table 1 lists the best fit parameters of these models and their dispersions in log . In order of decreasing accuracy the models are KMT2009 turbulence-regulated, constant molecular, GMC collisions, Kennicutt-Schmidt power law, gas- law and KM2005 turbulence-regulated, although we caution that given the systematic uncertainties and the different number of observables associated with each law some of these distinctions are probably not significant. Nevertheless, with the freedom to adjust one parameter for each galaxy, which can account for certain systematics such as distance uncertainties, global metallicity variations, foreground extinctions, etc., the KMT2009 turbulence-regulated, constant molecular and GMC collision models can reproduce the observed star formation rates with rms errors of factors of 1.5 (factors of about 1.7 for a single parameter star formation law), while the other models do somewhat worse, e.g. factors of about 2.0 for the KM2005 turbulence-regulated model. We note that the constant molecular law would require modification to explain the observed super-linear dependence of on , i.e. the Kennicutt-Schmidt relation, that extends to circumnuclear starbursts (K1998). Also this law and the turbulence-regulated laws have had the advantage of using the observed fraction of molecular gas as an input. If the KMT2009 law uses the molecular fractions predicted from the observed metallicities (Krumholz, McKee, & Tumlinson 2009b), the value of rises to 0.17 and 0.25 for , respectively (with ).
In addition to the rms dispersion, we note that there are systematic trends with : many of the models tend to over predict SFRs in the galactic centers and under predict in outer regions. This indicates that a Kennicutt-Schmidt power law with will do worse than one with . In the context of the GMC collision law, the galactic centers are where is relatively large, i.e. of reduced shear, for which the T2000 model (eq. 8) is not expected to be particularly accurate. Future numerical simulations, extending the analysis of Tasker & Tan (2009), can more accurately measure the dependence of the GMC collision rate as a function of to help develop a more refined model. Note also that in the limit of pure solid body rotation the GMC collision law needs to be modified to include a mode of star formation not set by shear-driven collisions, i.e. perhaps regulated by magnetic fields or turbulence.
Any test of SFR laws against observational data is necessarily limited in scope by being able to test only those laws that utilize the particular properties that have been observed. The physics underlying the law that does best in this test is not necessarily that which controls galactic SFRs. Nevertheless, comparison between the laws that can be tested does provide evidence for the relative merit of the physical mechanisms they invoke.
We conclude that a model of star formation controlled by shear-driven GMC collisions, , provides an accurate description of the radial profiles of in the molecular dominated regions of 12 nearby disk galaxies, performing favorably in comparison with a range of other models and better than the Kennicutt-Schmidt power law, the gas- law and the KM2005 turbulence-regulated model. Additionally, it is a relatively simple and physically well-motivated model for explaining SFRs in both disk galaxies and the more extreme circumnuclear starbursts studied by K1998. Future high angular resolution studies with ALMA to measure galactic radial profiles of velocity dispersion, and thus , will improve our ability to test the above star formation laws. Such observations will also be able test laws, such as those involving regulation by turbulence, that make predictions for the explicit dependence of SFR with velocity dispersion.
References
- Bigiel et al. (2008) Bigiel, F., Leroy, A., Walter, F., Brinks, E., De Blok, W. J. G., Madore, B., & Thornley, M. D. 2008, AJ, 136, 2846
- Blitz et al. (2007) Blitz, L., Fukui, Y., Kawamura, A., Leroy, A., Mizuno, N., & Rosolowsky, E. 2007, in Protostars & Planets V, eds. B. Reipurth, D. Jewitt, & K. Keil, (U. Arizona: Tucson), p.81
- (3) Blitz, L. & Rosolowsky E. 2006, ApJ, 650, 933
- (4) Bolatto, A., D., Leroy, A. K., Rosolowsky, E., Walter, F., Blitz, L. 2008, ApJ, 686, 948
- (5) Dobbs, C. L. & Pringle, J. E. 2009, MNRAS, 396, 1579
- (6) Dowell, J. D., Buckalew, B. A., & Tan, J. C. 2008, AJ, 135, 823
- (7) Elmegreen, B. G. 1994, ApJ, 425, L73
- (8) Elmegreen, B. G. 2002, ApJ, 577, 206
- (9) Fall, S., Chandar, R., & Whitmore, B. 2005, ApJ, 631, L133
- (10) Gammie, C. F., Ostriker, J. P., & Jog, C. J. 1991, ApJ, 378, 565
- (11) Gutermuth, R. A., Megeath, S. T., Myers, P. C., Allen, L. E., Pipher, J. L., Fazio, G. G. 2009, ApJS, 184, 18
- (12) Heyer, M., Gong, H., Ostriker, E., & Brunt, C. 2008, ApJ, 680, 420
- (13) Kennicutt, R. C., Jr. 1989, ApJ, 344, 685
- Kennicutt (1998) Kennicutt, R. C., Jr. 1998, ApJ, 498, 541 (K1998)
- (15) Kennicutt, R. C., Jr., Calzetti, D., Walter, F., Helou, G., Hollenbach, D. J. et al. 2007, ApJ, 671, 333
- (16) Kravtsov, A. V. 2003, ApJ, 590, L1
- (17) Krumholz, M. R., & McKee, C. F. 2005, ApJ, 630, 250 (KM2005)
- (18) Krumholz, M. R., McKee, C. F., & Tumlinson, J. 2009a, ApJ, 699, 850 (KMT2009)
- (19) Krumholz, M. R., McKee, C. F., & Tumlinson, J. 2009b, ApJ, 693, 216
- Krumholz & Tan (2007) Krumholz, M. R., & Tan, J. C. 2007, ApJ, 654, 304
- (21) Lada, C. J., & Lada, E. A. 2003, ARA&A, 41, 57
- (22) Larsen, S. S. 2009, A&A, 494, 539
- (23) Larson, R.B. 1988, in Galactic and Extragalactic Star Formation, ed. R.E. Pudritz & M. Fich, Dordrecht: Kluwer, 435
- (24) Leroy, A. K., Walter, F., Brinks, E., Bigiel, F., de Blok, W. J. G., Madore, B., & Thornley, M. D. 2008, AJ, 136, 2782
- Li et al. (2006) Li, Y., Mac Low, M.-M., & Klessen, R. S. 2006, ApJ, 639, 879
- (26) Martin, C. L., & Kennicutt, R. C. 2001, ApJ, 555, 301
- (27) Matzner, C. D. 2002, ApJ, 566, 302
- (28) McCrady, N., & Graham, J. R. 2007, ApJ, 663, 844
- (29) Schmidt, M. 1959, ApJ, 129, 243
- (30) Schmidt, M. 1963, ApJ, 137, 758
- (31) Shetty, R., & Ostriker, E. C. 2008, 684, 978
- (32) Solomon, P. M., Rivolo, A. R., Barrett, J., Yahil, A. 1987, ApJ, 319, 730
- Tan (2000) Tan, J. C. 2000, ApJ, 536, 173 (T2000)
- Tasker & Tan (2009) Tasker, E. J., & Tan, J. C. 2009, ApJ, 700, 358
- Toomre (1964) Toomre, A. 1964, ApJ, 139, 1217
- (36) Wang, B., & Silk, J. 1994, ApJ, 427, 759
- (37) Wong, T., & Blitz, L. 2002, ApJ, 569, 157
- (38) Wyse, R. F. G., & Silk, J. 1989, ApJ, 339, 700
- (39) Zuckerman, B., & Evans, N. J., II. 1974, ApJ, 192, L149