Present address: ]GSI Darmstadt, Helmholtz-Zentrum für Schwerionenforschung, D-64291, Darmstadt, Germany Present address: ]Physics Department, Technische Universität München, D-85748 Garching, Germany
Spectroscopy of 13B via the 13C(,3He) reaction at 115 AMeV.
Abstract
Gamow-Teller and dipole transitions to final states in 13B were studied via the 13C(,3He) reaction at AMeV. Besides the strong Gamow-Teller transition to the 13B ground state, a weaker Gamow-Teller transition to a state at 3.6 MeV was found. This state was assigned a spin-parity of by comparison with shell-model calculations using the WBP and WBT interactions which were modified to allow for mixing between and configurations. This assignment agrees with a recent result from a lifetime measurement of excited states in 13B. The shell-model calculations also explained the relatively large spectroscopic strength measured for a low-lying state at 4.83 MeV in 13B. The cross sections for dipole transitions up to B) MeV excited via the 13C(,3He) reaction were also compared with the shell-model calculations. The theoretical cross sections exceeded the data by a factor of about 1.8, which might indicate that the dipole excitations are “quenched”. Uncertainties in the reaction calculations complicate that interpretation.
pacs:
21.60.Cs, 25.40.Kv, 25.55.Kr, 27.20.+nI Introduction
The study of neutron-rich nuclei near mass number A=12 has received considerable attention because of experimental evidence for the presence of states with non-zero configurations at low excitation energies. Good examples are the ground state of 11Be, which has spin-parity Wilkinson et al. (1959) and the low-lying (2.7 MeV) state in 12Be Iwasaki et al. (2000). Such effects have been attributed to changes in the neutron shell structure. A variety of mechanisms has been proposed, such as the deformation of these neutron-rich nuclei Shimoura et al. (2007); Hamamoto and Shimoura (2007) or effects related to the monopole component of the tensor force Suzuki et al. (2003).
Ota et al. Ota et al. (2008) identified a low-lying state at 4.83 MeV in 13B in a 12Be() experiment performed in inverse kinematics at 50 AMeV. The relatively large spectroscopic strength of found for this state (with a systematic error of 60%) could not be reconciled with shell-model calculations in the model space, which took into account excitations up to 3 with an interaction designed to include the tensor effects Suzuki et al. (2003). It was suggested that the low-lying state is highly deformed and shifted to low excitation energies. Recently, Iwasaki et al. Iwasaki et al. (2009) found evidence for a long-lived state at 3.53 MeV in 13B, with a suggested of . The associated low transition strength indicates that the state has a dominant configuration and that the shell closure in 13B is weak.
In this work, excited states in 13B were investigated through the 13C(,3He) charge-exchange reaction at 115 AMeV. The (,3He) reaction selects isovector transitions () in the direction (i.e. -like) and, like other charge-exchange probes, provides an excellent tool to study the spin-isospin response of nuclei Harakeh and van der Woude (2001); Osterfeld (1992). In the present analysis, we focused on Gamow-Teller (GT) (, ) and dipole transitions (, ). The goal was to gain further insight into the properties of states in 13B that are excited via the 13C(,3He) reaction. The results were compared with shell-model calculations, which were also used to better understand the findings of Refs. Ota et al. (2008); Iwasaki et al. (2009)
At 115 AMeV, the (,3He) reaction at forward scattering angles is predominantly of a single-step, direct nature. Under such circumstances, the cross section for GT transitions at zero linear momentum transfer () is proportional to GT strength (B(GT)) Taddeucci et al. (1987):
| (1) |
where is the unit cross section. The unit cross section can be calibrated by using a transition for which the B(GT) is known from the log value obtained through -decay experiments. For the transition from the ground state of 13C () to the ground state of 13B () a B(GT) of 0.711(2) can be derived from the measured -decay half-life (log=4.034(6) Ajzenberg-Selove (1991)). The proportionality of Eq. 1 is not perfect, largely due to coherent L=2 contributions to the L=0 GT transitions, which are mediated via the non-central tensor interaction. Such effects have been studied experimentally and theoretically for a number of cases Zegers et al. (2006); Cole et al. (2006); Fujita et al. (2007); Zegers et al. (2007, 2008).
Whereas the proportionality between the differential cross section at and the transition strength has been well established for GT transitions, this is not the case for transitions involving larger units of angular momentum transfer, such as dipole transitions. In a theoretical study by Dmitriev et al. Dmitriev et al. (2001) for the 12C(,) reaction, it was shown that an approximate proportionality with transition strength exists if the cross section at the peak region of the dipole differential cross section is used (i.e. at finite momentum transfer). Also based on theoretical studies, Yako et al. Yako et al. (2006) assumed a proportionality between the peak differential cross section (at finite angle) for the 90Zr(,) and 90Zr(,) reactions and dipole strength. However, both studies rely on the similarity between transition densities for different excitations and a broader study involving several nuclei over a wide mass-range and experimental checks have not been performed. Therefore, in the present analysis of dipole excitations via the 13C(,3He) reaction, no proportionality was assumed a-priori. Instead, experimental cross sections were compared directly with theoretical ones.
II Experiment and data extraction.
A primary beam of 16O was accelerated to 150 MeV/nucleon in the coupled K500 and K1200 cyclotrons CCF at the National Superconducting Cyclotron Laboratory. The beam impinged upon a 3526 mg/cm2 Be production target and produced a 115 AMeV secondary triton beam Hitt et al. (2006). A 195 mg/cm2 Al wedge was placed at the intermediate image of the A1900 fragment separator Morrissey et al. (2003) to rid the beam of its 6He contamination, which produced minor backgrounds in previous (He) experiments through the (6He3He+3n) breakup reaction. In addition, a slit at the intermediate image was used to limit the momentum acceptance to . The tritons were guided through the analysis beam line to a target placed at the object of the S800 spectrometer Bazin et al. (2003). To monitor the triton yield during the experiment for the purpose of absolute cross section measurements, the triton rates at the object of the S800 were measured by using a plastic scintillator and calibrated against the readout of a non-intercepting primary beam probe, located at the exit of the K1200 cyclotron. The continuous readout of the non-intercepting probe during regular data taking then provided a direct measure for the triton rate. The calibration procedure was carried out several times during the experiment (typically after beam tuning) to monitor small changes (less than 10%) in the calibration factor. The transmission of tritons from the focal plane of the A1900 to the object of the S800 was around 85%, an improvement over previous experiments Cole et al. (2006); Howard et al. (2008); Hitt et al. (2009) stemming from a realignment of the analysis beam-line between the A1900 and the S800. The improvement gave a yield at the target of 107 s-1.
An 18 mg/cm2, 99.3% isotopically enriched 13CH2 target Noji (2008) was placed at the object of the S800 spectrometer. The analysis beam-line to the S800 spectrometer was operated in dispersion-matched mode in order to improve the energy resolution. 3He particles were identified in the focal plane of the S800 Yurkon et al. (1999) by using the signals from two plastic scintillators and the time difference between the cyclotron RF signal and the event trigger (an event in the first scintillator). The dispersive and non-dispersive positions and angles of the 3He particles in the focal plane were determined by using two cathode readout drift detectors (CRDCs). Dispersive and non-dispersive angles, the non-dispersive position, and the momentum of the 3He at the target were reconstructed by using a fifth-order COSY Infinity transfer matrix Berz et al. (1993) based on measured maps of the magnetic field. The dispersion-matched beam spot size at the target was approximately 5 cm in the dispersive direction and 1 cm in the non-dispersive direction, but the large size of the target (7.5 cm by 2.5 cm) eliminated scattering from the frame. A missing mass calculation was performed on an event-by-event basis to reconstruct the excitation energy of 13B. The scattering angle was reconstructed from the non-dispersive and dispersive angles up to 5.75∘ in the center of mass; the angular resolution was 0.6∘ (FWHM). The acceptance of the spectrometer depends not only on horizontal and vertical components of the scattering angle, but also on the hit-position in the non-dispersive direction at the target. Therefore, a Monte Carlo simulation was performed to estimate the acceptance of the spectrometer as a function of scattering angle and was used in the calculation of opening angles required for calculating differential cross sections. The resolution in the reconstructed excitation energy of 13B was 480 keV (FWHM) and was dominated by the difference in energy loss for tritons and 3He particles in the target.
III Experimental results
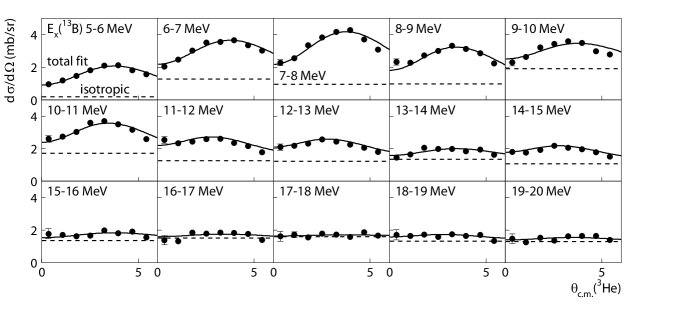
In Fig. 1(a) the measured 13C(,3He) excitation energy spectrum is shown. Besides the dominant transition to the 13B ground state, several other distinct peaks were observed at excitation energies below 6 MeV. Above that energy, the spectrum is more complex. Several broader structures are observed that lie on top of a structureless continuum. The continuum is mostly due to quasifree processes with three-body final states (see e.g. Matsuoka et al. (1980); Aarts et al. (1981)).
To gain insight into the various contributions to the excitation energy spectrum, angular distribution were studied and compared with theory. For that purpose, differential cross sections were calculated in the distorted-wave Born approximation (DWBA), by using the code FOLD Cook and Carr (1988). In this code, the effective nucleon-nucleon interaction by Love and Franey Love and Franey (1981); Franey and Love (1985) is double-folded over the transition densities of the projectile-ejectile (-3He) and target-residual (13C-13B) systems. A short-range approximation as described in Ref. Love and Franey (1981) was used for the exchange terms in the potential. For 3He and 3H, densities used in the folding were obtained from Variational Monte-Carlo results Pieper and Wiringa (2001). One-body transition densities (OBTDs) for the transitions from 13C to 13B were calculated with the code OXBASH Brown et al. employing the WBP interaction Warburton and Brown (1992) in the model space. The Hamiltonians were modified as discussed in more detail in Section IV. Radial wave functions were calculated by using a Woods-Saxon potential. Binding energies of the particles were determined in OXBASH Brown et al. by employing the Skyrme SK20 interaction Brown (1998). The optical potential parameters used in the DWBA calculation were extracted from 3He elastic scattering on 13C Fujimura et al. (2004). The depths of the triton potentials were calculated by scaling the depths of the 3He potentials by 0.85, while leaving radii and diffusenesses constant van der Werf et al. (1989).
III.1 Gamow-Teller transitions
The 13C(,g.s.)13B(,g.s.) transition is associated with total angular momentum transfers and , i.e. there are two distinct sets of OBTDs. The transition has two components: the Gamow-Teller component with , and a quadrupole component with , . The transition also has two components: one associated with spin transfer (, ) and one without (, ). To extract the cross section associated with the Gamow-Teller component of the transition from the data, the , contribution has to be isolated, and this can be done by investigating the experimental angular distribution. Whereas the , cross section peaks at , the angular distribution of the components are relatively flat at forward scattering angles, with a maximum at . In Fig. 1(b) the measured differential cross section of the 13C(,g.s.)B(,g.s.) transition is shown and decomposed into the and components by using angular distributions generated in DWBA. Since the three contributions to the component have very similar angular distributions over the solid angle covered in the experiment, their relative strengths were kept fixed and their sum treated as a single contribution to the differential cross section. The normalizations of the and combined contributions were adjusted independently to best fit the experimental data. The extracted cross section for the component at was mb/sr, where the error is deduced from the uncertainties in the fit (0.2 mb/sr) and an estimated 10% systematic uncertainty in the determination of absolute cross sections due to beam-intensity fluctuations and variations of the target-thickness over the large area covered by the impinging triton beam.

Since the application of Eq. 1 requires the use of the differential cross section at (which corresponds to Q-value and ), the extracted cross section of the component at , but finite , (for the 13C(,3He)13B(g.s) reaction, ) was extrapolated to by multiplying with the ratio . The differential cross sections in the numerator and the denominator were calculated in DWBA. Since the B(GT) for 13C( g.s.)B( g.s.) is known, the unit cross section can be extracted from the cross section at and its value was mb/sr. Within error bars, this value is consistent with the one found for the 13C(3He,) reaction at 140 MeV/nucleon () Zegers et al. (2008). The unit cross section was also estimated in the theory, by dividing the DWBA cross section at by the theoretical B(GT). The value found was mb/sr, which is a factor of higher than the experimental value. The discrepancy is likely due to the approximate treatment of exchange contributions in the theory Udagawa et al. (1987); Kim et al. (2000) and was also observed for the (3He,) reaction on variety of target nuclei Zegers et al. (2007). Systematic uncertainties related to the optical potential parameters are another possible source for the discrepancy.
Fig. 1(c) displays the differential cross section of the peak observed at (13B) MeV. Although the angular distribution peaks at forward angles, it is clear by comparison to the ground-state transition in Fig. 1(b) that this peak contains stronger component(s) not associated with . Nakayama et al. reported Nakayama et al. (1990) a strong (% of the ground state transition) transition with to unresolved states at (13B) MeV via the 13C(7Li,7Be) reaction at 21 MeV/nucleon. In Ref. Guimaraes et al. (2000), evidence was found for and states at 3.48 and 3.68 MeV, respectively, by using one-neutron knockout from 14B. From these previous results, it is clear that the contribution of dipole transitions should be considered in the analysis of the peak at 3.6 MeV. In earlier experiments aimed at investigating levels in 13B Middleton and Pullen (1964); Wyborny (1972); Ajzenberg-Selove et al. (1978), four states were found in the energy window between 3.4 and 3.8 MeV, two of which were associated with , and two with . In addition, similar to the ground state transition, the transfer associated with the GT transition also has a component.
Taking into account the possible contributions from the various transfers, the GT contribution to the peak at 3.6 MeV was extracted by fitting pairwise combinations of , and angular distribution calculated in DWBA to the data. The peak observed at 5.2 MeV served as a test for how well the DWBA calculations could describe dipole transitions. As shown in Fig. 1(d), the shape of the theoretical angular distribution matches very well the experimental data (the theoretical curve was scaled). For the peak at 3.6 MeV, a fit with a combination of and angular distributions provided the best result, which is shown in Fig. 1(c). A fit with all three angular-momentum transfer components was performed as well, but the component was small and the reduced did not improve compared to the fit where the component was not included. The contribution to the differential cross sections changed by 5% between the three-component fit and the fit with and components only. This percentage was used as an estimate for the systematic error in the extraction procedure. The extracted cross section at was mb/sr, where the first uncertainty is due to the statistical error and the second due to the systematic error. This cross section was extrapolated to and the B(GT) determined by using the unit cross section derived from the ground state transition. Its value was , where the error includes the statistical and systematic uncertainties in the fit of the angular distribution. Following the procedure for estimating the systematic error in the extracted B(GT) due to interference between and and amplitudes presented for the analysis of the 13C(3He,) reaction in Ref. Zegers et al. (2008), we found that such uncertainties were small (2% of the extracted B(GT) values) compared to the statistical and systematical (fitting) uncertainties and thus could be ignored. No further unambiguous signatures of GT transitions to states at excitation energies above 4 MeV were found in the analysis of the 13B excitation energy spectrum. A summary of the results for the GT transitions to the ground state and the excited state at 3.6 MeV is provided in Table 1.
| (13B) | B(GT) | |||
|---|---|---|---|---|
| MeV | mb/sr | mb/sr | mb/sr | |
| 0 | 111Deduced from the measured log value in -decay Ajzenberg-Selove (1991). | |||
| 3.6 | 222Deduced from the unit cross section determined from the ground-state transition. | - |
III.2 Dipole transitions
The extraction of the contributions from dipole transitions to the spectrum shown in Fig. 1(a) was complicated by the presence of the quasifree continuum and, possibly, isolated transitions associated with angular momentum transfer (). The magnitude of the latter contributions were estimated by generating shell-model states up to 20 MeV excitation energy for transitions to final states with and and calculating their differential cross sections in DWBA. Above MeV, the contribution to the total cross section from transitions with amounted to maximally 5% and the response was thus strongly dominated by the dipole transitions. This is due to the fact that the Gamow-Teller strength is mostly confined to low excitation energies as discussed above and transitions with are suppressed at these beam energies and forward scattering angles.
The quasifree continuum has a relatively flat angular distribution at forward scattering angles and, due to its nature, should not exhibit large local fluctuations as a function of excitation energy. In the case of the (,3He) reaction and ignoring minor contributions from multistep reactions (e.g. breakup-pickup), it is largely due to charge-exchange reactions on a bound proton and the ejection of the exchanged neutron, leaving the residual “spectator” nucleus in its ground or an excited single proton-hole state Jänecke et al. (1993). The Fermi motion of the bound proton leads to a broadening of the energy of the outgoing 3He particle. The threshold for three-body breakup is the neutron separation energy ((13B)=4.878 MeV) which thus defines the onset of the continuum. There are few detailed studies of the shape of the continuum and sometimes a phenomenological description has been used Jänecke et al. (1993), originally employed in charge-exchange reactions Erell et al. (1986). More detailed studies require coincidence measurements between the ejectile and the knocked-out particle (see e.g. Matsuoka et al. (1980); Aarts et al. (1981); Borghols (1988); Zegers (1999)).
Since the contributions from non-dipole transitions were expected to be small, the excitation energy spectrum above 5 MeV was decomposed into two components: one stemming from collective dipole transitions, which are associated with angular distributions that exhibit a strong minimum at and peak at finite scattering angle, and one due to the continuum. The continuum was assumed to have a flat angular distribution, since it is a superposition of components associated with a wide range of angular momentum transfers (including ). Minor contributions from transitions to specific states associated with have rather flat angular distributions as well and they were effectively absorbed in the continuum component. Since the continuum is smooth, the decomposition was performed for 1-MeV wide bins in excitation energy, as shown in Fig. 2. For each energy bin, the experimental differential cross sections are shown. The results of the fit with the flat and dipole contributions are superimposed (solid lines), as well as the contribution from the flat component only (dashed lines). Different sets of OBTDs for dipole transitions predicted in the shell-model were employed to calculate the angular distributions used in the fit. As the angular distributions did not vary much when switching from one set of OBTDs to another, the extracted dipole contributions to the experimental spectrum were not sensitive to the choice of the set of OBTDs used and the associated systematic errors were significantly smaller than those due to other effects (see below) and thus ignored. Clear dipole contributions could be distinguished up to about 16 MeV. Beyond that energy, the angular distributions were nearly flat, indicating that the non-collective excitations associated with a range of angular momentum transfers dominated the response. In what follows, we use the term “continuum” to denote this sum of non-collective excitations.
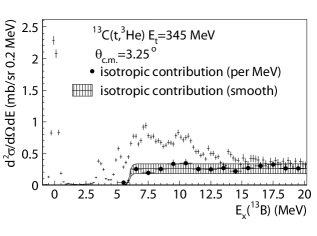
In Fig. 3, the excitation energy spectrum at center-of-mass scattering angles between 3∘ and 3.5∘ is shown. Superimposed are the isotropic contributions representing the continuum (per 1 MeV bin) extracted from the decomposition. Within the uncertainties, the continuum contribution is indeed rather smooth as a function of excitation energy. For the remainder of the analysis, the continuum was, therefore, assumed to be constant above 6 MeV, with the magnitude set to the average of the continuum contributions in each of the 1 MeV bins above that energy. Taking into account the assumptions made in the decomposition and the fact that small dipole contributions to the continuum might have been missed in the analysis, the uncertainty in this magnitude was chosen to equal the maximum spread in continuum contributions in each of the 1 MeV bins. Between 4.8 MeV (the onset of the continuum) and 6 MeV, a smooth function raising the continuum contribution from 0 to the average level was used. From Fig. 3 it is clear that even though the uncertainties in the continuum contribution are large (about half the magnitude of the continuum itself), the extraction of cross sections associated with dipole transitions can be performed with relatively high accuracy at this scattering angle since they contribute so dominantly to the spectrum.
IV Comparison with theory
IV.1 Theoretical framework
We calculate the energies and transition strengths with the WBP and WBT Hamiltonians Warburton and Brown (1992). These Hamiltonians were derived from fits to experimental energy levels under the condition that the wave functions are described by pure configurations. With this assumption, the lowest lying states of 13C and 13B are obtained from the negative parity configurations . The 1 excitations relate to excited positive parity states of the form and , where the latter configuration dominates due to the relative small shell gap between and shells. The 2 excitations would describe higher-lying negative parity states dominated by the configurations. The energies of these states obtained with WBP and WBT are shown in Fig. 2 of Ref. Guimaraes et al. (2000). Continuing this sequence we would have 3 positive parity states dominated by with the lowest state being a 1/2+ at 5.65 (5.73) MeV with WBP(WBT). This state is close in energy to a state at 4.83 MeV observed strongly in the 4He(12Be,13B) transfer reaction Ota et al. (2008). In this picture, this 3 1/2+ state is the band-head of a collective band with other states at energies of (with WBP) 6.48 MeV for 5/2+ and 9.04 MeV for 9/2+. These states have a similar structure to the configurations (relative to a closed -shell for 16O) of 19F coupled to the configurations of 10Be.
As discussed in Ref. Navin et al. (2000), the lowest 0 and 2 states obtained with WBT in 12Be are degenerate in energy. The experimental data for neutron knockout Navin et al. (2000) suggest that the ground state of 12Be has 32% 0 and 68% 2 (the results labeled WBT2 in Ref. Navin et al. (2000)). The spectroscopic factor calculated with WBT for the pure 2 (0+) to 3 1/2+ transfer is 0.33, giving a value of 0.22 when the WBT2 wave functions are used, in good agreement with the experimental value of 0.20(2) Ota et al. (2008). This good agreement is in contrast with the discrepancy found between theory and experiment as presented in Ref. Ota et al. (2008) for reasons discussed next.
As emphasized in Ref. Warburton and Brown (1992), the WBP and WBT interactions are designed to be used for pure configurations. But one can generate matrix elements which connect the and configurations from the potential parameters obtained with WBP. When this is used to mix the configurations, the relative spacing of the parts of the spectrum can be greatly distorted. The reason, as discussed in Ref. Warburton et al. (1992), is due to the mixing of the many high-lying configurations with the low-lying states via the SU3 tensor part of the interaction that pushes down the energies of the states. Thus to be consistent one must also include admixtures in order to push down the states, etc. One would need to go to perhaps 8-10 for a consistent calculation. But at the same time one should change the basic interaction since it is designed for the simple pure configurations. Thus, it is not correct to carry out mixed and calculations for 13B as was done in Ref. Ota et al. (2008).
An approximate way to correct for this distortion is discussed in Warburton et al. (1992). One calculates the energy of the lowest state with and with configurations. The energy shift between these two results, E, can then be applied to lower all of the configurations to implicitly take into account the effect that the configurations have in lowering the energy of the configurations. The energy shift obtained in this way for our case is about MeV. With this approximation the lowest states in 13B with WBP dominated by each are the 3/2- (76% 0) ground state, 1/2+ (78%1) at 2.90 MeV, 3/2- (94% 2) at 3.68 MeV and 1/2+ (61%3) at 5.73 MeV. The results obtained for the wave functions and transition strengths are similar for the WBT Hamiltonian. The 3/2- state predicted at 3.68 MeV likely corresponds to the state observed at 3.53 MeV in Ref. Iwasaki et al. (2009).
With this mixed (02) wave function for 12Be the spectroscopic factors for the 12Be to 13B transfer for the first five 1/2+ states at 2.90, 5.73, 7.11, 8.00 and 9.55 MeV are 0.034, 0.183, 0.030, 0.020 and 0.014, respectively. Based on these results, we associate the second 1/2+ state with the “proton intruder” level observed at 4.83 MeV with a strength of 0.20(2) in Ref. Ota et al. (2008).
The B(GT) values for transitions from 13C to low-lying negative parity states in 13B are dominated by transitions to the 3/2- (76% 0) ground state with B(GT) = 0.904 and to the 3.68 MeV 3/2- (94% 2) state with B(GT) = 0.025. The B(GT) for the excited 3/2- state is directly related to the amount of mixing. For example, if the 13C ground state is constrained to be pure 0, then the results are B(GT) (0.073) to the first (second) 3/2- states in 13B. Thus, there is destructive interference between the components of the transition to the second 3/2- state. Matrix elements of the type are zero, and the result for the first two 3/2- states can be understood schematically in terms of a three component model:
and
In addition, the (2) (2) matrix elements are sensitive to the wave function (and interaction) as shown for the case of 16O 16F Gamow-Teller strength in Snover et al. (1983).
| experiment111See Table 1. | theory | |||||||
| CKII- | WBP | |||||||
| B) | B(GT) | B) (MeV) | B(GT) | B(GT) | B) | B(GT) | B(GT) | |
| MeV | MeV | quenched222A reduction factor of 0.677 is applied (for details see text). | MeV | quenched222A reduction factor of 0.677 is applied (for details see text). | ||||
| 0 | 0.711(2) | 0 | 1.02 | 0.691 | 0 | 0.904 | 0.612 | |
| 3.6 | 0.065(5) | - | - | - | 3.86 | 0.025 | 0.017 | |
| 4.59 | 0.00538 | 0.00386 | 3.675 | 0.00270 | 0.00183 | |||
IV.2 Comparison between theoretical and experimental results for Gamow-Teller transitions
To compare the theoretical results for the Gamow-Teller strengths with the experimental values in Table 1 one has to take into account that theoretical calculations for Gamow-Teller strengths in general overestimate the data due to degrees of freedom not included in the models. This reduction factor can be quantified by squaring the “quenching” factor for the free-nucleon operator. For nuclei in the shell, Chou et al. (1993), which gives 0.823 for and a reduction of the Gamow-Teller strength by a factor is expected. It is incorrect to apply this reduction factor to the calculated strengths in the model in which mixed (02) wave functions are employed, since part of the quenching is thought to originate from such configuration mixing Hyuga et al. (1980); Arima (1999); Brown and Wildenthal (1988). Therefore, applying the full reduction factor would constitute partial double-counting of quenching effects and the true Gamow-Teller reduction factor should lie in between 0.677 and 1.
In Table 2, the theoretical predictions for the Gamow-Teller strengths are compared with those extracted from the experiment (see Table 1). This comparison is visualized in Fig. 4. Besides the calculations that employ the WBP interaction with mixed (02) configurations as discussed above, theoretical results with the CKII interaction Cohen and Kurath (1967) in -shell model space ( only) are also included in the table. In the latter calculation, the experimental B(GT) for the ground-state transition is well described if the reduction factor of 0.677 is applied, but the next transition is to a state at 4.59 MeV and its strength is more than a factor of 16 smaller than the experimentally found value. Such a low value is below the sensitivity of the current experiment. It is, therefore, unlikely that the state at 3.6 MeV is associated with a state. We further note that two states not included in Table 2 were predicted in the calculation at higher excitation energies. Their combined B(GT) (with quenching) was small, only 0.002.
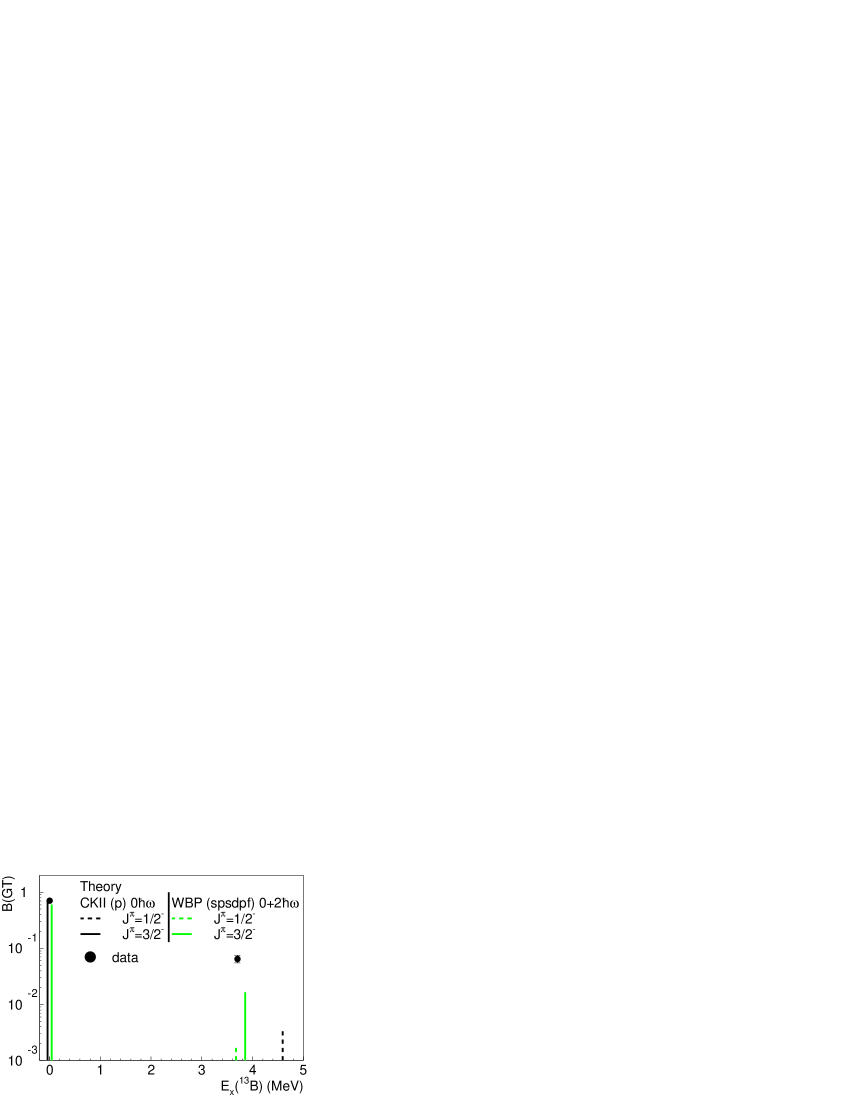
In contrast to the calculation in the space, the calculation with the mixed configuration space predicts a B(GT) slightly lower (0.612) than the data (0.711(2)) for the ground-state transition after the reduction factor of 0.677 is applied. As mentioned above, this is expected because of the partial double-counting of quenching effects. The relatively strong state predicted at 3.86 MeV with the WBP interaction with mixed (02) configurations matches the location of state found experimentally at 3.6 MeV quite well, but the theoretical strength is about a factor of 3 too low, likely due to the sensitivity of the theoretical value to the exact level of mixing between and configurations discussed above. The assignment of to the state at 3.6 MeV corresponds to the tentative assignment reported in Ref. Iwasaki et al. (2009). The calculated decay properties of this state with the WBP (WBT) interaction are 7.0 (3.8) ps for the mean lifetime with B(M1) W.u. ( W.u.) and B(E2)=0.051 W.u. (0.046 W.u.), compared to the experimental values reported in Ref. Iwasaki et al. (2009) of 1.3(3) ps, B(M1) W.u. and B(E2) W.u. Thus both the B(GT) to the excited state obtained in the present experiment and the lifetime suggest that the mixing between and configurations is about a factor of 2-3 larger than obtained with the WBP and WBT interactions.
Similar to the calculation, a low-lying state is also predicted in the (02) model, albeit at a slightly lower excitation energy of 3.675 MeV. Again, the strength of this state is too low to be seen in the present experiment. Moreover, if the energy were indeed so close to that of the second state, the two would not be separable with the energy resolution achieved in the experiment. Finally, we found that in the mixed (02) calculation, many and states were predicted at excitation energies above 5 MeV as a consequence of the configuration mixing. Up to 18 MeV (which was the cut-off for the calculations), a summed B(GT) of 0.134 (0.091 after applying the reduction factor of 0.677) was distributed over nearly 100 states. None of these states was of sufficient strength to be observed and/or resolved in the current data set.
IV.3 Comparison between theoretical and experimental results for dipole transitions
In this section, we focus on the comparison between the experimental and theoretical predictions of dipole transitions. For reasons discussed in Section I, this study was performed by comparing cross sections rather than strength. In Fig. 5(a), the extracted collective dipole cross sections at as a function of excitation energy are shown. This figure was obtained by subtracting the estimated contributions from the quasifree continuum (see Fig. 3) from the full spectrum at that angle. The error bars show the statistical uncertainties, combined with the estimated uncertainties in contributions of the continuum. In Fig. 5(b), the theoretical cross sections at are shown for comparison. The curve contains contributions from transitions to , and states, which are shown separately out in Fig. 5(c). These theoretical cross sections were calculated in DWBA as discussed in Section III, by using input from the shell-model calculations that employ the WBP interaction with mixed configurations. For the width of the states, the experimental energy resolution was assumed (480 keV); this ignores the effects of decay on the width of the states above the 4.787 MeV threshold for decay by neutron emission. Up to about 11 MeV, the dipole cross section is mostly due to transitions to and states. Above that energy, transitions to states are predicted to be the strongest.

Up to about 11 MeV, the structures seen in the experimental (Fig. 5(a)) and theoretical (Fig. 5(b)) spectra are qualitatively similar. Peaks in the experimental dipole distribution are observed at 3.6 MeV (this is the dipole component of the fit shown in Fig. 1(c)), 5.2 MeV (Fig. 1(d)), 7 MeV and 10 MeV. These could possibly correspond with the maxima seen, mostly due to transitions to (combinations of) and states, in the theoretical distribution at about 4.2 MeV, 6.5 MeV, 7.5 MeV and 11 MeV, respectively. Above 11 MeV, the qualitative correspondence between data and theory is not very good: the experimental dipole distribution drops off quickly with increasing excitation energy, but significant contributions from transitions to states are predicted by theory.
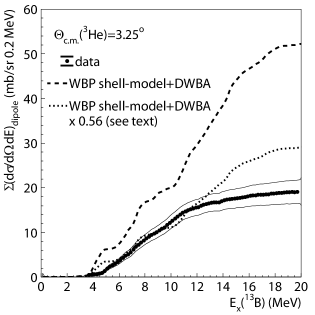
In Fig. 6, cumulative cross sections as a function of excitation energy are plotted for both the theoretical and the experimental dipole spectra at . The theoretical cross sections (dashed line) overshoot the data by a large factor. Two possible reasons were identified: the DWBA calculations for dipole transitions systematically overestimate the experimental cross sections and/or the dipole strengths are quenched, similar to the case for Gamow-Teller transitions. As described in section III, the theoretical unit cross section for Gamow-Teller transitions was found to be 20% larger than the experimental value. Under the assumption that the causes for that discrepancy affect dipole transitions as much as Gamow-Teller transitions, this percentage can be used as an estimate for the systematic error for theoretical dipole cross sections as well. We found that the effects of exchange contributions to the cross sections (estimated by comparing DWBA calculations with and without exchange) were hardly different (a few percent) for Gamow-Teller and dipole transitions, suggesting that systematic effects would be similar as well. However, some ambiguity remained due to the use of the approximate treatment of exchange in the DWBA code. Possible differences in distortions (described by the optical model parameters) between Gamow-Teller and dipole transitions were tested by comparing cross section calculations in Plane-Wave Born Approximation (PWBA) with DWBA results. Peak Gamow-Teller and dipole cross section were reduced by a very similar factor in DWBA, compared to PWBA, suggesting that systematic errors in the optical potential would also be similar.
As an estimate for the possible effects of quenching of dipole strengths, we used the value of the reduction factor for Gamow-Teller transitions . Combined with the 20% decrease due to systematic errors in the DWBA calculation discussed above, we multiplied the theoretical cross sections for dipole transitions by . The correspondingly scaled cumulative cross section is also shown in Fig. 6. A good correspondence between the magnitudes of the experimental and scaled theoretical results is found up to about 11 MeV. Above that value, the experimental curve levels off, whereas the theoretical curve continues to rise and only levels off above MeV. If the scaling factor of 0.56 for the theory is reasonably accurate, one can speculate that the discrepancy above 11 MeV is due to transitions to states, which, according to the theory, are strongly populated in that energy range. A possible reason could be that at these high excitation energies, couplings to configurations more complex than included in the present shell-model calculations, start playing a role and push part of the dipole strength even up to higher energy.
Although the comparison between experimental and theoretical dipole cross sections suggests that dipole strengths are reduced due to quenching by a factor similar to that found for Gamow-Teller transitions, remaining uncertainties in the DWBA and shell-model calculations make it hard to draw a definite conclusion.
V Conclusion
We measured the 13C(,3He) reaction at =115 AMeV and extracted the Gamow-Teller strength distribution. Besides the strong transition to the 13B ground state (B(GT)=0.711(2), known from -decay) a second Gamow-Teller transition to a state at 3.6 MeV was found, with B(GT)=0.065(5). This state very likely corresponds to the state that was recently found at 3.53 MeV in Ref. Iwasaki et al. (2009) and tentatively assigned to . By comparing our results with shell-model calculations that employed the WBP interaction adjusted to allow for mixed configurations, we confirmed that spin-parity assignment. The B(GT) predicted by the theory is somewhat lower than the data, indicating that the mixing between and configurations predicted in the shell model with the WBP and WBT interactions is not quite sufficient. The same conclusion is drawn by comparing the experimental results for the lifetime, B(M1) and B(E2) from Ref. Iwasaki et al. (2009) with the theory.
In order to perform shell-model calculations with the mixed () configurations, the energy of the configurations was lowered to approximate the effect of and higher configurations. As a consequence, the relatively large spectroscopic factor for proton transfer from 12Be to a 1/2+ state at 4.83 MeV in 13B Ota et al. (2008) could be explained as well.
Above an excitation energy of 4 MeV, the spectrum measured via the 13C(,3He) reaction is dominated by dipole transitions to states with . The experimental cross sections up to 20 MeV to these states were compared with theoretical calculations. The theoretical cross sections were larger than the experimental values, but under the assumption that systematic errors in the DWBA calculation and quenching of strength are similar for dipole and Gamow-Teller transitions, a reasonable correspondence was found up to an excitation-energy of 11 MeV. Above 11 MeV, shell-model calculations predict that the dipole response is dominated by transitions to states, but we found little evidence for strong dipole transitions at these higher excitation energies.
Acknowledgements.
We thank the cyclotron and A1900 staff at NSCL for their support during the experiment. This work was supported by the US NSF (PHY-0822648 (JINA), PHY-0606007, and PHY-0758099).References
- Wilkinson et al. (1959) D. Wilkinson et al., Phys. Rev. 113, 563 (1959).
- Iwasaki et al. (2000) H. Iwasaki et al., Phys. Lett. B481, 8 (2000).
- Shimoura et al. (2007) S. Shimoura et al., Phys. Lett. B654, 87 (2007).
- Hamamoto and Shimoura (2007) I. Hamamoto and S. Shimoura, J. Phys. G 34, 2714 (2007).
- Suzuki et al. (2003) T. Suzuki, R. Fujimoto, and T. Otsuka, Phys. Rev. C 67, 044302 (2003).
- Ota et al. (2008) S. Ota et al., Phys. Lett. B666, 311 (2008).
- Iwasaki et al. (2009) H. Iwasaki et al., Phys. Rev. Lett. 102, 202502 (2009).
- Harakeh and van der Woude (2001) M. N. Harakeh and A. van der Woude, Giant Resonances: Fundamental High-Frequency Modes of Nuclear Excitations (Oxford University Press, New York, 2001).
- Osterfeld (1992) F. Osterfeld, Rev. Mod. Phys. 64, 491 (1992).
- Taddeucci et al. (1987) T. D. Taddeucci et al., Nucl. Phys. A469, 125 (1987).
- Ajzenberg-Selove (1991) F. Ajzenberg-Selove, Nucl. Phys. A523, 1 (1991).
- Zegers et al. (2006) R. G. T. Zegers et al., Phys. Rev. C 74, 024309 (2006).
- Cole et al. (2006) A. L. Cole et al., Phys. Rev. C 74, 034333 (2006).
- Fujita et al. (2007) Y. Fujita et al., Phys. Rev. C 75, 057305 (2007).
- Zegers et al. (2007) R. G. T. Zegers et al., Phys. Rev. Lett. 99, 202501 (2007).
- Zegers et al. (2008) R. G. T. Zegers et al., Phys. Rev. C 77, 024307 (2008).
- Dmitriev et al. (2001) V. F. Dmitriev, V. Zelevinsky, and S. M. Austin, Phys. Rev. C 65, 015803 (2001).
- Yako et al. (2006) K. Yako, H. Sagawa, and H. Sakai, Phys. Rev. C 74, 051303(R) (2006).
- (19) The K500K1200, a coupled cyclotron facility at the NSCL, NSCL Report MSUCL-939.
- Hitt et al. (2006) G. W. Hitt et al., Nucl. Instrum. Methods Phys. Res. A 566, 264 (2006).
- Morrissey et al. (2003) D. Morrissey et al., Nucl. Instrum. Meth. Phys. Res. B 204, 90 (2003).
- Bazin et al. (2003) D. Bazin, J. A. Caggiano, B. M. Sherrill, J. Yurkon, and A. Zeller, Nucl. Instr. Meth. Phys. Res. B 204, 629 (2003).
- Howard et al. (2008) M. Howard et al., Phys. Rev. C 78, 047302 (2008).
- Hitt et al. (2009) G. Hitt et al., Phys. Rev. C (2009), in press.
- Noji (2008) S. Noji, in Future Prospects for Spectroscopy and Direct Reactions (2008), pp. 8,9, http://meetings.nscl.msu.edu/fp2008/presentations/noji.pdf.
- Yurkon et al. (1999) J. Yurkon, D. Bazin, W. Benenson, D. J. Morrissey, B. M. Sherrill, D. Swan, and R. Swanson, Nucl. Instr. Meth. Phys. Res. A 422, 291 (1999).
- Berz et al. (1993) M. Berz, K. Joh, J. A. Nolen, B. M. Sherrill, and A. F. Zeller, Phys. Rev. C 47, 537 (1993).
- Matsuoka et al. (1980) N. Matsuoka et al., Nucl. Phys. A337, 269 (1980).
- Aarts et al. (1981) E. H. L. Aarts et al., Phys. Lett. B102, 307 (1981).
- Cook and Carr (1988) J. Cook and J. Carr (1988), computer program fold, Florida State University (unpublished), based on F. Petrovich and D. Stanley, Nucl. Phys. A275, 487 (1977), modified as described in J. Cook et al., Phys. Rev. C 30, 1538 (1984) and R. G. T. Zegers, S. Fracasso and G. Colò (2006), unpublished.
- Love and Franey (1981) W. G. Love and M. A. Franey, Phys. Rev. C 24, 1073 (1981).
- Franey and Love (1985) M. A. Franey and W. G. Love, Phys. Rev. C 31, 488 (1985).
- Pieper and Wiringa (2001) S. C. Pieper and R. B. Wiringa, Annu. Rev. Nucl. Part. Sci. 51, 53 (2001), and R.B. Wiringa, private communication.
- (34) B. A. Brown et al., NSCL report MSUCL-1289.
- Warburton and Brown (1992) E. K. Warburton and B. A. Brown, Phys. Rev. C 46, 923 (1992).
- Brown (1998) B. A. Brown, Phys. Rev. C 58, 220 (1998).
- Fujimura et al. (2004) H. Fujimura et al., Phys. Rev. C 69, 064327 (2004), and private communication.
- van der Werf et al. (1989) S. Y. van der Werf, S. Brandenburg, P. Grasdijk, W. A. Sterrenburg, M. N. Harakeh, M. B. Greenfield, B. A. Brown, and M. Fujiwara, Nucl. Phys. A496, 305 (1989).
- Udagawa et al. (1987) T. Udagawa, A. Schulte, and F. Osterfeld, Nucl. Phys. A474, 131 (1987).
- Kim et al. (2000) B. T. Kim, D. P. Knobles, S. A. Stotts, and T. Udagawa, Phys. Rev. C 61, 044611 (2000).
- Nakayama et al. (1990) S. Nakayama et al., Nucl. Phys. A507, 515 (1990).
- Guimaraes et al. (2000) V. Guimaraes et al., Phys. Rev. C 61, 064609 (2000).
- Middleton and Pullen (1964) R. Middleton and D. J. Pullen, Nucl. Phys. 51, 50 (1964).
- Wyborny (1972) H. W. Wyborny, Nucl. Phys. A185, 669 (1972).
- Ajzenberg-Selove et al. (1978) F. Ajzenberg-Selove, E. R. Flynn, and O. Hansen, Phys. Rev. C 17, 1283 (1978).
- Jänecke et al. (1993) J. Jänecke et al., Phys. Rev. C 48, 2828 (1993).
- Erell et al. (1986) A. Erell et al., Phys. Rev. C 34, 1822 (1986).
- Borghols (1988) W. T. A. Borghols, Ph.d. thesis, Rijksuniversiteit Groningen (1988).
- Zegers (1999) R. G. T. Zegers, Ph.d. thesis, Rijksuniversiteit Groningen (1999).
- Navin et al. (2000) A. Navin et al., Phys. Rev. Lett. 85, 266 (2000).
- Warburton et al. (1992) E. K. Warburton, B. A. Brown, and D. J. Millener, Phys. Lett. B293, 7 (1992).
- Snover et al. (1983) K. A. Snover, E. G. Adelberger, P. G. Ikossi, and B. A. Brown, Phys. Rev. C 27, 1837 (1983).
- Chou et al. (1993) W.-T. Chou, E. K. Warburton, and B. A. Brown, Phys. Rev. C 47, 163 (1993).
- Hyuga et al. (1980) H. Hyuga, A. Arima, and K. Shimizu, Nucl. Phys. A336, 363 (1980).
- Arima (1999) A. Arima, Nucl. Phys. A649, 260c (1999).
- Brown and Wildenthal (1988) B. A. Brown and B. H. Wildenthal, Annu. Rev. Nucl. Part. Sci. 38, 29 (1988).
- Cohen and Kurath (1967) S. Cohen and D. Kurath, Nucl. Phys. A101, 1 (1967).