Raman spectra of bilayer graphene to probe the electrostatic environment
Abstract
The Raman shift, broadening, and relative Raman intensities of bilayer graphene are computed as functions of the electron concentration. We include dynamic effects for the phonon frequencies and we consider the gap induced in the band structure of bilayer graphene by an external electric field. We show that from the analysis of the Raman spectra of gated bilayer graphene it is possible to quantitatively identify the amount of charges coming from the atmosphere and from the substrate. These findings suggest that Raman spectroscopy of bilayer graphene can be used to characterize the electrostatic environment of few-layers graphene.
pacs:
78.20.Bh,63.20.kd,78.30.Na,63.22.Np,81.05.UwI introduction
Graphene-based systems have recently attracted much attention from both the experimental and the theoretical point of view. Graphene is in fact characterized by a high carrier-mobility, Novoselov et al. (2004, 2005); Zhang et al. (2005) which make those systems very exciting in view of future applications in nanoelectronics. In standard experimental setups, few-layers graphene (FLG) interacts with the environment through doping charges coming from the top () and from the bottom () of the system. These charges determine the external electric field and the total electron concentration (). and can thus be varied independently changing the charges from the two sides. and can be intentionally induced by applying gate voltage differences between the system and the substrate, or via atoms/molecules deposition on top of the system. On the other hand, important unintentional doping charges are typically present. For instance, in FLG obtained by exfoliation on Novoselov et al. (2004, 2005); Zhang et al. (2005); Oostinga et al. (2008); Zhang et al. (2009); Castro et al. (2007); Ferrari et al. (2006); Pisana et al. (2007); Casiraghi et al. (2007); Stampfer et al. (2007); Das et al. (2009); Yan et al. (2007); Das et al. (2008); Yan et al. (2008); Malard et al. (2008); Kuzmenko et al. (2009a); Tang et al. (2009); Kuzmenko et al. (2009b); Zhang et al. (2008) or epitaxially grown on SiC, Ohta et al. (2006) a charge transfer occurs between the substrate and the system, giving rise to a finite . In analogy, an additional can be accidentally induced by the uncontrolled adsorption of molecules from the atmosphere.
Among FLG, the bilayer graphene is particularly interesting because it becomes a tunable band-gap semiconductor under the application of an electric field perpendicular to the system. Ohta et al. (2006); Oostinga et al. (2008); Zhang et al. (2009); Castro et al. (2007); McCann (2006); Min et al. (2007); Aoki and Amawashi (2007); Gava et al. (2009) In this context, the determination of the electric field is crucial in order to control the band-gap. Moreover, in graphene charge impurities originating from the top or from the substrate are the main source of scattering which reduces conduction performances. Chen et al. (2008) Therefore, the determination of the charge transfer from the substrate or from the atmosphere is highly desirable for possible applications. Although experimental techniques allow to estimate the total electron concentration on the system, an accurate determination of the respective values of top and bottom charges has never been achieved so far, and can be particularly challenging, for instance, when doping is intentionally induced by deposition of molecules or polymeric electrolyte. In this work we use a tight binding (TB) model fitted on ab initio calculations to compute the Raman shift, broadening, and relative Raman intensity of the modes in bilayer graphene, as a function of the electron concentration, for different values of top charges. In particular, the screening properties of the system in presence of an external electric field are described using ab initio density functional theory calculations (DFT), including the correction, while a TB model is used to reproduce the DFT calculated, corrected, band structure in the full Brillouin zone. We show that from the measured Raman spectra of bilayer graphene it is possible to determine the external charge distribution and thus the external electric field and the actual carriers concentration. This result is especially relevant since it shows that Raman spectroscopy, which is already widely used to investigate graphene-based systems, can be used to characterize the electrostatic environment of the sample. Moreover, since the charges coming from the atmosphere and the substrate are not expected to depend on the number of layers, Raman measurements on bilayer graphene can also be used to determine the origin and the amount of the unintentional doping of monolayer and few-layers graphene in the same environment.
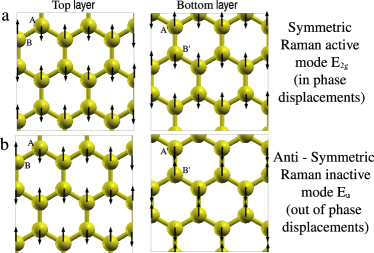
The Raman spectra of monolayer graphene are characterized by a doubly-degenerate peak ( mode) at around 1580 . Ferrari et al. (2006); Pisana et al. (2007); Casiraghi et al. (2007); Stampfer et al. (2007); Das et al. (2009); Yan et al. (2007); Das et al. (2008) This mode shows a strong electron-phonon coupling, which induces a phonon renormalization when is varied. Therefore, Raman can be used to measure the total electron concentration. In bilayer graphene, in the absence of an external electric field the peak splits, as in graphite, in a doubly-degenerate Raman active mode () and a doubly-degenerate, Raman inactive, infra-red active mode (). The mode is characterized by a symmetric in-phase displacement of the atoms in the two layers (Fig.1-a), whereas is characterized by an antisymmetric out-of-phase displacement of those atoms (Fig.1-b). Most Raman measurements on bilayer graphene show a single peak whose position is used, as in monolayer graphene, to measure the electron concentration on the system. Yan et al. (2008); Das et al. (2009) Interestingly, the splitting of the peak has been observed in the Raman spectra of bilayer graphene, Malard et al. (2008) and it has been recently attributed to symmetry breaking due to the application of an external electric field.Ando and Koshino (2009) Moreover, other experimental works recently reported on the infra-red spectra of gated bilayer graphene. Zhang et al. (2009); Kuzmenko et al. (2009a); Tang et al. (2009); Kuzmenko et al. (2009b); Zhang et al. (2008) These findings suggest that a deep understanding of the behavior of a splitted mode in gated bilayer graphene could lead to quantify not only the total electron concentration but also the separate values of and .
II Computational details
In order to calculate the electron-phonon coupling (EPC) component of the phonon frequencies, broadenings, and relative Raman intensities as functions of and , we consider the phonon self-energy, Allen (1972); Allen and Silberglitt (1974) projected onto the subspace of the two and the two modes:
| (1) |
where the sum is on the electron wave vector and the electronic bands . =1,4 are the phonon indexes, is the number of vectors, and is the occupation of the electron state with energy . is the EPC and is the Hamiltonian derivative with respect to the atomic displacement corresponding to the phonon. equals 0.009 eV and M is the atomic mass.
From the phonon self-energy one can calculate only frequency variations due to changes in the electron concentration and in the band structure. In order to obtain the absolute frequencies we use the following 4 matrix:
| (2) | |||||
where =1581.5 is the experimentally measured frequency of the Raman active peak in bilayer graphene, in absence of doping and electric field. Yan et al. (2008) is the contribution to the broadening of the modes in graphene and graphite from the anharmonic phonon-phonon interaction, whose value is estimated to be 1.8 . Bonini et al. (2007) is the phonon self-energy of the doubly degenerate mode calculated for and , and it is given by , where corresponds to the two modes and are the corresponding eigenvectors. In presence of doping charge the lattice parameter changes and the corresponding variation of the modes frequencies can be obtained for zero electric field by ab initio calculations:Lazzeri and Mauri (2006) cm-1, where is the relative variation of the lattice parameter, as in Eq.(2) of Ref.Lazzeri and Mauri (2006) In this work we do not include in the phonon calculations the effects due to direct interaction of the system with adsorbates and with the substrate donating doping charge. However, as shown for intercalated graphite,Boeri et al. (2007); Calandra and Mauri (2005) we assume that this is not relevant also for the in-plane vibrational modes of bilayer graphene.
The eigenvalues of are of the form , where is the frequency of phonon and is the full width half maximum (FWHM), given by the EPC and the anharmonic phonon-phonon interaction. In the general case of finite and the four eigenmodes of , , are still two by two degenerate, but they are a superposition of the and eigenmodes of the unbiased bilayer graphene. Their relative Raman intensities are calculated as:
| (3) |
where =1.
We have shown that the screening properties of bilayer graphene under the application of an external electric field are characterized by inter- and intra-layer polarizations.Gava et al. (2009) Most of the calculations of the band gap as a function of and are based on TB models,McCann (2006); Castro et al. (2007) which usually consider only the inter-layer palarization, resulting in an overestimation of the band gap. In the present work the band structure of the electrons [ and in Eq.(1)] is obtained using the scheme presented in Ref.Gava et al. (2009) The band gap is computed by ab initio DFT calculations, including the corrections, and both inter- and intra-layer polarizations are fully taken into account. The full band structure of gated bilayer graphene is then computed using a TB model, which is able to reproduce all the important features of the DFT calculated, corrected bands, including the electron-hole asymmetry.
In order to compute one needs to calculate the derivative of the tight binding Hamiltonian with respect to the atomic positions. However, only the variation of the first nearest-neighbors in-plane hopping parameters turns out to be relevant, and this only term is thus included in . The value we use for this quantity is 5.8 eV , which derives from the ab initio GW-calculated EPC at for the mode in monolayer graphene. Lazzeri et al. (2008)
III Results
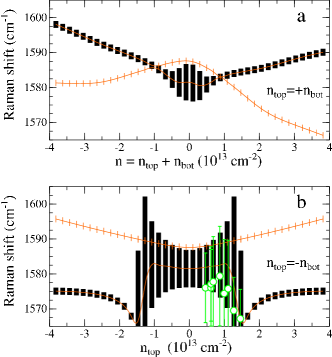
In Fig.2-a we show the calculated Raman shift as a function of , for the case =, where the external electric field and the band-gap are kept fixed to zero, as theoretically studied in Ref.Ando (2007) In this case the and modes do not mix by symmetry. Analogously to monolayer graphene, the Raman active modes show a singularity when the Fermi energy is half of the phonon energy. In Fig.2-b we show the calculated Raman shifts for the case , as a function of . This is a special situation where the external electric field is varied while is kept fixed to zero, as realized in recent infra-red experiments. Zhang et al. (2009); Tang et al. (2009) In this case, the mixing between and modes is weak due to the antisymmetric allocation of charges in the two layers. The Raman active modes show a singularity in the frequency and a divergence in the FWHM when the band-gap is of the order of the phonon energy.
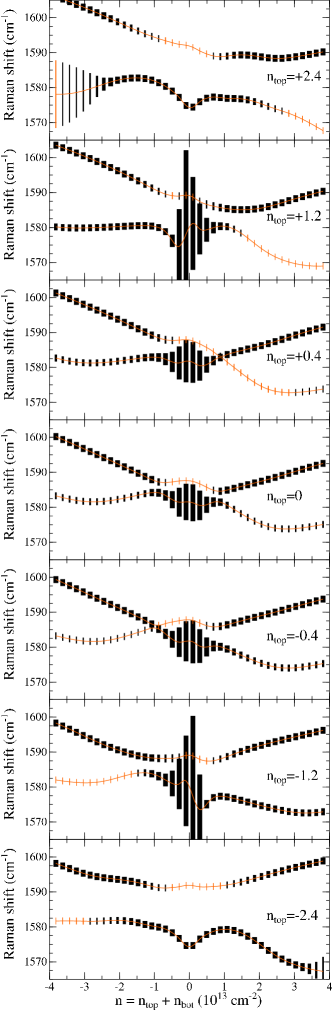
In the most general situation the electric field and are both finite. In Fig.3 we show the Raman shift of bilayer graphene as functions of , for different values of . In these cases, the and modes do mix, and at certain values of and two modes become Raman visible. Our results show an asymmetry between positive and negative values of . For instance, in the case = 2.4 the FWHM of the lowest mode at -4 is higher than the same quantity for the case = -2.4 at 4 . This is due to the electron-hole asymmetry in the band structure, which is properly described in our calculations. Moreover, the asymmetry between positive and negative is enhanced by the effect of the lattice spacing variation induced by the doping charge. Our results are qualitatively in agreement with recent calculations,Ando and Koshino (2009) based on TB model. They are however quantitatively different, because in our calculations we include the electron-hole asymmetry, the lattice spacing variation due to doping charge, and both inter- and intra-layer polarizations. The dependence on of the frequencies, FWHM, and relative Raman intensities is strongly influenced by , and on the basis of this observation we claim that the amount of uncontrolled and can be estimated from the Raman spectra of bilayer graphene when two modes are observed.

We now compare our calculations to the experimental Raman spectra of bilayer graphene where the splitting of the mode is reported. Malard et al. (2008) In this work charges are intentionally induced on the system by applying a gate voltage between the bilayer and the substrate. However, unintentional and arising from the atmosphere and the substrate can be present at zero gate voltage. By comparing the experimental and calculated Raman shifts as a function of for different , we estimate a total electron concentration at zero gate voltage = -1.8 . In Fig.4-a and -b we show the ratio between the relative Raman intensities of the highest and lowest mode, and the Raman shifts, respectively, as a function of the electron concentration , for different values of . The former one strongly depends on , while the frequency shifts have a weaker dependence. The best agreement between theory and experiments indicates an unintentional charge coming from the atmosphere =-0.25 . From our estimate of , we deduce an unintentional charge from the substrate =-= -1.55 . The agreement between experimental data and theoretical results is good. However, we notice that the slope of the theoretical curves is underestimated with respect to the experimental ones. This could be possibly due to local desorption of molecules and doping variation induced by the laser light, or to hysteresis effects in the doping dependence on gate voltage.
Finally, in the right side of Fig.2-b, we compare our theoretical results to the experimental frequencies and broadenings from recent infra-red measurements in Ref.Tang et al. (2009), where the doping charge is kept fixed to zero and the electric field is varied. The agreement is excellent with our lower frequency mode. In our calculations, the lower mode has a weak projection on . However, this mode is strongly coupled with the electrons, as testified by the large FWHM. Such coupling enhances the effective charges associated with and increases the infra-red activity. Kuzmenko et al. (2009b); Rice et al. (1977); Rice and Choi (1992) Indeed, in Fig.3 of Ref.Tang et al. (2009) the measured infra-red intensity is maximum when the band-gap equals the phonon energy (about 0.2 eV), i.e. when the FWHM and thus the coupling of the mode with the electrons are maximum, while it decreases when the FWHM decreases.
IV Conclusions
In summary, we have computed the Raman spectra of gated bilayer graphene, which is strongly influenced by the interaction with the environment. We claim that by the analysis of the splitting of the mode in Raman measurements it is possible to estimate the amount of unintentional charges coming from the atmosphere and from the substrate. Here we compare our calculations with the only experimental data available on the mode splitting in bilayer graphene, and we give an estimate of the unintentional charges coming from the environment in this experiment. In order to facilitate the comparison of new experimental results with our theoretical calculations, we provide as additional material a set of computed Raman shifts, FWHM, and relative Raman intensities as a function of , for different values of . fil
References
- Novoselov et al. (2004) K. S. Novoselov, A. K. Geim, S. V. Morozov, Jiang, Y. Zhang, S. V. Dubonov, I. V. Grigorieva, and A. Firsov, Science 306, 666 (2004).
- Novoselov et al. (2005) K. S. Novoselov, A. K. Geim, S. V. Morozov, D. Jiang, M. Katsnelson, I. Grigorieva, S. Dubonov, and A. Firsov, Nature 438, 197 (2005).
- Zhang et al. (2005) Y. Zhang, Y. Tan, H. L. Stormer, and P. Kim, Nature 438, 201 (2005).
- Oostinga et al. (2008) J. B. Oostinga, H. B. Heersche, X. Liu, A. F. Morpurgo, and L. M. K. Vandersypen, Nature Mater. 7, 151 (2008).
- Zhang et al. (2009) Y. Zhang, T. Tang, C. Girit, Z. Hao, M. C. Martin, A. Zettl, M. F. Crommie, Y. R. Shen, and F. Wang, Nature 459, 820 (2009).
- Castro et al. (2007) E. V. Castro, K. S. Novoselov, S. V. Morozov, N. M. R. Peres, J. M. B. Lopes dos Santos, J. Nilsson, F. Guinea, A. K. Geim, and A. H. Castro Neto, Phys. Rev. Lett. 99, 216802 (2007).
- Ferrari et al. (2006) A. C. Ferrari, J. C. Meyer, V. Scardaci, C. Casiraghi, M. Lazzeri, F. Mauri, S. Piscanec, D. Jiang, K. S. Novoselov, S. Roth, et al., Phys. Rev. Lett. 97, 187401 (2006).
- Pisana et al. (2007) S. Pisana, M. Lazzeri, C. Casiraghi, K. S. Novoselov, A. K. Geim, A. C. Ferrari, and F. Mauri, Nature Mater. 6, 198 (2007).
- Casiraghi et al. (2007) C. Casiraghi, S. Pisana, K. S. Novoselov, A. K. Geim, and A. C. Ferrari, Appl. Phys. Lett. 91, 233108 (2007).
- Stampfer et al. (2007) C. Stampfer, F. Molitor, D. Graf, and K. Ensslin, Appl. Phys. Lett. 91, 241907 (2007).
- Das et al. (2009) A. Das, B. Chakraborty, S. Piscanec, S. Pisana, A. K. Sood, and A. C. Ferrari, Phys. Rev. B 79, 155417 (2009).
- Yan et al. (2007) J. Yan, Y. Zhang, P. Kim, and A. Pinczuk, Phys. Rev. Lett. 98, 166802 (2007).
- Das et al. (2008) A. Das, S. Pisana, B. Chakraborty, S. Piscanec, S. K. Saha, U. V. Waghmare, K. S. Novoselov, H. R. Krishnamurthy, A. K. Geim, A. C. Ferrari, et al., Nature Nanotech. 3, 210 (2008).
- Yan et al. (2008) J. Yan, E. A. Henriksen, P. Kim, and A. Pinczuk, Phys. Rev. Lett. 101, 136804 (2008).
- Malard et al. (2008) L. M. Malard, D. C. Elias, E. S. Alves, and M. A. Pimenta, Phys. Rev. Lett. 101, 257401 (2008).
- Kuzmenko et al. (2009a) A. B. Kuzmenko, E. van Heumen, D. van der Marel, P. Lerch, P. Blake, K. S. Novoselov, and A. K. Geim, Phys. Rev. B 79, 115441 (2009a).
- Tang et al. (2009) T.-T. Tang, Y. Zhang, C.-H. Park, B. Geng, C. Girit, Z. Hao, M. C. Martin, A. Zettl, M. F. Crommie, S. G Louie, Y. R. Shen, and F. Wang, arXiv:0907.0419 (2009).
- Kuzmenko et al. (2009b) A. B. Kuzmenko, L. Benfatto, E. Cappelluti, I. Crassee, D. van der Marel, P. Blake, K. S. Novoselov, and A. K. Geim, arXiv:0906.2203 (2009b).
- Zhang et al. (2008) L. M. Zhang, Z. Q. Li, D. N. Basov, M. M. Fogler, Z. Hao, and M. C. Martin, Phys. Rev. B 78, 235408 (2008).
- Ohta et al. (2006) T. Ohta, A. Bostwick, T. Seyller, K. Horn, and E. Rotenberg, Science 313, 951 (2006).
- McCann (2006) E. McCann, Phys. Rev. B 74, 161403(R) (2006).
- Min et al. (2007) H. Min, B. Sahu, S. K. Banerjee, and A. H. MacDonald, Phys. Rev. B 75, 155115 (2007).
- Aoki and Amawashi (2007) M. Aoki and H. Amawashi, Solid State Commun. 142, 123 (2007).
- Gava et al. (2009) P. Gava, M. Lazzeri, A. M. Saitta, and F. Mauri, Phys. Rev. B 79, 165431 (2009).
- Chen et al. (2008) J.-H. Chen, C. Jang, S. Adam, M. S. Fuhrer, E. D. Williams, and M. Ishigami, Nature Phys. 4, 377 (2008).
- Allen (1972) P. B. Allen, Phys. Rev. B 6, 2577 (1972).
- Allen and Silberglitt (1974) P. B. Allen and R. Silberglitt, Phys. Rev. B 9, 4733 (1974).
- Bonini et al. (2007) N. Bonini, M. Lazzeri, N. Marzari, and F. Mauri, Phys. Rev. Lett. 99, 176802 (2007).
- Lazzeri and Mauri (2006) M. Lazzeri and F. Mauri, Phys. Rev. Lett. 97, 266407 (2006).
- Lazzeri et al. (2008) M. Lazzeri, C. Attaccalite, L. Wirtz, and F. Mauri, Phys. Rev. B 78, 081406(R) (2008).
- Ando (2007) T. Ando, J. Phys. Soc. Jpn. 76, 104711 (2007).
- Ando and Koshino (2009) T. Ando and M. Koshino, J. Phys. Soc. Jpn. 78, 034709 (2009).
- (33) In Ref.Malard et al. (2008) the authors fit the raw experimental data with Lorentzians of variable FWHM. Here we re-fit data from Ref.Malard et al. (2008) for all gate voltages with two Lorentzians of fixed FWHM equal to 7 , which is the value obtained in Ref.Malard et al. (2008) for large negative voltages, where the two peaks are well resolved. Our choice is justified by the fact that, according to our calculations, the EPC contribution to the FWHM is vanishing around = -1.8 , for all considered (Fig.3). Thus, the increase in broadening observed in Ref.Malard et al. (2008) for positive value of gate voltage is not due to an increase of the decay rate () but to the presence of two contributions of fixed width in the Raman peak, close in frequency but not exactly superimposed. The root mean square error obtained with the two fitting procedures are comparable.
- Rice et al. (1977) M. J. Rice, N. O. Lipari, and S. Strassler, Phys. Rev. Lett. 39, 1359 (1977).
- Rice and Choi (1992) M. J. Rice and H.-Y. Choi, Phys. Rev. B 45, 10173 (1992).
- Boeri et al. (2007) L. Boeri, G. B. Bachelet, M. Giantomassi, and O. K. Andersen, Phys. Rev. B 76, 064510 (2007).
- Calandra and Mauri (2005) M. Calandra and F. Mauri, Phys. Rev. Lett. 95, 237002 (2005).
- McCann (2006) E. McCann, Phys. Rev. B 74, 161403(R) (2006).
- (39) See EPAPS supplementary material at XXXX for computed Raman shifts, FWHM, and relative Raman intensities as a function of and .