A Survey of UV Bright Sources Behind the Halo of M31
Abstract
We have performed a wide-area ultraviolet (UV) imaging survey using the GALaxy Evolution eXplorer (GALEX) to search for bright, point-like UV sources behind M31’s extended halo. Our survey consisted of 46 pointings covering an effective area of deg2, in both the far-UV and near-UV channels. We combined these data with optical -band observations acquired with the WIYN Mosaic-1 imager on the Kitt Peak National Observatory 0.9m WIYN telescope. An analysis of the brightness and colors of sources matched between our photometric catalogs yielded UV-bright quasar candidates. We have obtained discovery spectra for 76 of these targets with the Kast spectrometer on the Lick 3m telescope and confirm 30 active galactic nuclei and quasars, 29 galaxies at including several early-type systems, 16 Galactic stars (hot main-sequence stars), and one featureless source previously identified as a BL Lac object. Future UV spectroscopy of the brightest targets with the Cosmic Origins Spectrograph on the Hubble Space Telescope will enable a systematic search for diffuse gas in the extended halo of M31.
keywords:
galaxies: haloes – galaxies: individual: M31 – quasars: absorption lines1 Introduction
Structure formation, in current cosmology, follows from the gravitational collapse of dark matter into virialized ‘halos’. Modern theory also predicts that diffuse baryons are pulled along during the collapse. A subset of these may travel to the center of the dark matter halo, dissipate their internal energy, and condense further to form stars. A significant fraction, however, may instead be shock-heated to the virial temperature of the dark matter halo to form a hot, diffuse baryonic halo. Modern cosmological simulations suggest that the amount of baryons that travel along these two paths is a sensitive function of the total mass, dark matter halo mass, and also the age of the universe (Kereš et al., 2005; Dekel et al., 2008). Independent of gravitational heating, feedback processes related to galaxy formation (e.g. galactic winds, AGN outflows), galaxy-galaxy interactions (e.g. mergers), and even interactions between galaxies and this diffuse medium (e.g. ram-pressure stripping) may also pollute the halo with diffuse and, possibly, metal-enriched gas. Studies of halo gas, therefore, trace the processes of structure formation and may constrain the roles of feedback in galaxy evolution.
Halo gas is observed in emission from the largest virialized structures of our universe: clusters and groups. Termed the intracluster medium (ICM) or intragroup gas, this material emits X-rays via Brehmstrahlung processes that are recorded by space-borne satellites (Forman & Jones, 1982; Mulchaey et al., 2003). The observations assess the temperature, enrichment, and density profiles of this halo gas. In turn, the halo’s gas serves as a vital diagnostic for the potential well of massive dark matter halos. The analysis indicates that the majority of baryons in clusters and massive groups are located within this medium, far surpassing the stellar mass of individual galaxies (e.g. Allen et al., 2008). Indeed, it has been suggested that diffuse halo gas may be the dominant baryonic reservoir in the present-day universe (Mulchaey et al., 1996; Fukugita et al., 1998; Prochaska & Tumlinson, 2008).
The most successful approach thus far to studying the halo gas has been through absorption-line studies, i.e. rest-frame ultraviolet spectroscopy of distant quasars whose sightlines coincidentally intersect the projected halos of foreground galaxies. These observations reveal that galactic halos have a multi-phase medium comprised of cool, photoionized material (traced by absorption; Lanzetta & Bowen, 1992; Kacprzak et al., 2007) and a warmer, more diffuse component traced by higher ionization states (e.g. , ; Chen et al., 2001; Tripp et al., 2007). Photoionization modeling of this gas constrains the density, temperature, and metallicity of the gas (e.g. Churchill et al., 2000; Chen & Prochaska, 2000). Because of the inefficiencies of UV spectroscopy, the sample sizes have been very modest and only recently have observers been pursuing studies that yield a statistical description for a large population of galaxies by focusing on transitions redshifted into optical passbands (Zibetti et al., 2007; Chen & Tinker, 2008). Even with this approach, it is extremely rare to study a single halo with more than one sightline. As such, we lack a detailed knowledge of the distribution and properties of gas (neutral or ionized) within individual galactic halos.
The Andromeda spiral galaxy (M31), a nearby massive spiral, is an excellent galaxy for such a study. Its stellar halo is known to extend out to degrees, or kpc (Guhathakurta et al., 2005; Kalirai et al., 2006; Gilbert et al., 2006). M31 is a representative late-type spiral of the present Universe. Furthermore, as our nearest (big galaxy) neighbor there is a large and expanding dataset of supplementary observations including multi-band imaging, high spatial resolution images of select fields, and a tremendous set of optical spectroscopy on individual stars (e.g. Ibata et al., 2007; Guhathakurta et al., 2006; Brown et al., 2007; Gilbert et al., 2007).. Regarding the gaseous halo, clouds of hydrogen gas have been sighted in M31 with similar properties as the Galactic HVCs (Thilker et al., 2004). These clouds or their lower column density counterparts are prime targets for spectroscopic analysis throughout the extended halo. Unfortunately, emission studies of warm/hot diffuse gas are challenged by the same foregrounds that preclude studies within the Milky Way. It is a natural extension of our experience with the Galactic halo to consider surveying M31’s halo through absorption-line studies. The challenge, however, is to identify bright UV sources behind the halo of M31 and then obtain high fidelity spectroscopy.
With this challenge as our motivation, we initiated a UV/optical survey of deg2 of M31’s galactic halo. In order to maximize our search area for QSO detections, we used the GALaxy Evolution eXplorer (GALEX) telescope (Morrissey & GALEX Science Team, 2005). Starting in Cycle 1, the GALEX team began acquiring images of the disk and inner spheroid of M31. These data are complemented by images and spectra from the Sloan Digital Sky Survey. We were granted a Cycle 2 GO project to image the extended halo of M31 with GALEX. This paper reports on these observations and additional optical imaging and spectroscopy for quasar candidate selection and confirmation.
2 GALEX Imaging
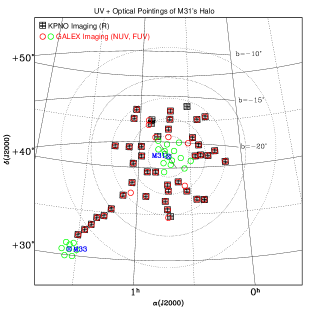
We were awarded a total of 46 pointings during Cycle 2 (PI: Prochaska; ID=033) of the GALEX mission to image a portion of M31’s outer halo. The pointings extend radially outwards from the guaranteed time observations of M31’s disk and inner spheroid. We had proposed to image the halo along radial spokes extending to 100 kpc along N, NE, E, SE, S, SW, W, and NW directions. Most of the proposed positions were shifted by several arcminutes to satisfy the GALEX bright star detector limits. Furthermore, only a subset of our requested pointings were actually acquired. These are diagrammed in Figure 1 and listed in Table 1.
| ID | Date (UT) | ||
|---|---|---|---|
| SW4 | 06 Nov 2005 | 00:32:24.00 | +37:30:00.0 |
| SW5 | 06 Nov 2005 | 00:26:57.18 | +36:35:59.9 |
| S6 | 06 Nov 2005 | 00:42:44.32 | +34:39:00.0 |
| SW3 | 06 Nov 2005 | 00:33:30.78 | +38:05:59.9 |
| S5 | 06 Nov 2005 | 00:43:08.32 | +35:31:01.1 |
| S4 | 06 Nov 2005 | 00:44:24.00 | +36:25:01.1 |
| S3 | 06 Nov 2005 | 00:42:44.32 | +37:31:01.1 |
| SE9 | 07 Nov 2005 | 01:13:47.67 | +35:24:17.9 |
| SW2 | 07 Nov 2005 | 00:37:12.00 | +38:31:47.9 |
| W4 | 08 Nov 2005 | 00:23:49.22 | +41:20:59.9 |
| SE7 | 08 Nov 2005 | 01:07:50.55 | +36:56:41.9 |
| W6 | 08 Nov 2005 | 00:15:18.00 | +41:42:54.0 |
| SE11 | 08 Nov 2005 | 01:21:07.20 | +34:20:59.9 |
| W2 | 08 Nov 2005 | 00:24:42.00 | +42:27:00.0 |
| W3 | 08 Nov 2005 | 00:27:00.00 | +41:16:08.4 |
| E3 | 08 Nov 2005 | 00:58:24.00 | +41:16:08.4 |
| SE2 | 08 Nov 2005 | 00:54:47.99 | +39:33:53.9 |
| NE2 | 09 Nov 2005 | 00:50:33.60 | +43:19:48.0 |
| N1 | 09 Nov 2005 | 00:42:44.32 | +43:22:48.0 |
| E2 | 09 Nov 2005 | 00:58:47.99 | +42:17:59.9 |
| E6 | 09 Nov 2005 | 01:14:24.00 | +42:12:00.0 |
| NE3 | 09 Nov 2005 | 00:54:47.99 | +44:39:00.0 |
| E5 | 09 Nov 2005 | 01:06:00.00 | +42:12:00.0 |
| N3 | 09 Nov 2005 | 00:41:47.99 | +45:17:59.9 |
| N2 | 09 Nov 2005 | 00:42:44.32 | +44:13:47.9 |
| SE12 | 09 Nov 2005 | 01:23:43.35 | +33:32:41.9 |
| NW6 | 10 Nov 2005 | 00:19:49.90 | +45:28:08.4 |
| SE14 | 10 Nov 2005 | 01:30:04.47 | +32:18:18.0 |
| NE6 | 10 Nov 2005 | 01:02:35.99 | +46:17:59.9 |
| SE13 | 10 Nov 2005 | 01:26:53.91 | +32:55:29.9 |
| N4 | 10 Nov 2005 | 00:41:31.20 | +46:12:00.0 |
| NW5 | 10 Nov 2005 | 00:25:00.00 | +45:12:00.0 |
| NE4 | 10 Nov 2005 | 00:54:47.99 | +45:09:00.0 |
| NE5 | 10 Nov 2005 | 01:04:00.00 | +45:17:59.9 |
| NW2 | 29 Jul 2006 | 00:30:56.23 | +42:40:33.8 |
| NW3 | 30 Jul 2006 | 00:28:12.00 | +43:15:00.0 |
| W5 | 30 Jul 2006 | 00:19:33.80 | +41:15:21.8 |
| SW6 | 30 Jul 2006 | 00:22:52.38 | +36:32:49.2 |
| W7 | 06 Aug 2006 | 00:09:36.00 | +40:30:00.0 |
| SE1 | 14 Sep 2006 | 00:50:00.00 | +39:33:53.9 |
| S2 | 14 Sep 2006 | 00:43:12.00 | +38:11:23.9 |
| SE3 | 15 Sep 2006 | 00:55:08.31 | +36:55:29.9 |
| SE6 | 15 Sep 2006 | 01:03:45.43 | +37:15:07.4 |
| E4 | 15 Sep 2006 | 01:03:08.76 | +40:26:13.4 |
| SE5 | 19 Sep 2006 | 01:03:12.00 | +38:20:59.9 |
| SE10 | 19 Sep 2006 | 01:17:22.23 | +34:35:59.9 |
Note: The ID represents the direction with respect to the center of M31. Each pointing was imaged in NUV and FUV, with an FOV of .
| ID | Name | Classb | Candc | ||||||||
|---|---|---|---|---|---|---|---|---|---|---|---|
| (J2000) | (J2000) | (AB) | (AB) | (AB) | (AB) | (AB) | (AB) | ||||
| 1 | GALEX J000639.12+402641.2 | 00:06:39.12 | +40:26:41.2 | 21.50 | 0.12 | 20.79 | 0.05 | … | … | 0.99 | N |
| 2 | GALEX J000639.68+402949.3 | 00:06:39.68 | +40:29:49.3 | 99.99 | -1.00 | 19.54 | 0.02 | … | … | 0.98 | N |
| 3 | GALEX J000640.06+403418.4 | 00:06:40.06 | +40:34:18.4 | 99.99 | -1.00 | 19.41 | 0.02 | … | … | 1.00 | N |
| 4 | GALEX J000642.73+402405.4 | 00:06:42.73 | +40:24:05.4 | 99.99 | -1.00 | 22.16 | 0.10 | … | … | 1.00 | N |
| 5 | GALEX J000643.10+402835.3 | 00:06:43.10 | +40:28:35.3 | 99.99 | -1.00 | 20.78 | 0.04 | … | … | 0.98 | N |
| 6 | GALEX J000644.53+403139.9 | 00:06:44.53 | +40:31:39.9 | 21.11 | 0.10 | 20.60 | 0.04 | … | … | 1.00 | N |
Note: a: -band magnitudes from KPNO photometry are reported for the NUV extraction that are matched to within a radius of a KPNO source. For NUV extractions where KPNO imaging exists but no source was detected, we report a value of 99.99 and an error of -1. For NUV extractions where no KPNO imaging exists, we report no values. a: Star/galaxy classifier calculated by SExtractor on the NUV photometry. Values near unity indicate a stellar-like point-spread function. b: Quasar candidates picked based on color relations between UV and R. The criteria used were , 2, and . d: NUV extractions with no FUV match have FUV values of 99.99 and an error of -1. [The complete version of this table is in the electronic edition. The printed edition contains only a sample.]
The exposure time for each observation was set to one orbit (1631 s). The incoming beam is split by a dichroic into the far-UV (Å) and near-UV (Å) channels. The unvignetted field-of-view of each pointing is a circle with radius that is imaged simultaneously by two cameras for a total field-of-view (FOV) of approximately 1.2 deg2. The raw images were processed through the reduction pipeline at the GALEX Science Operations Center111http://galexgi.gsfc.nasa.gov/docs/galex/Documents/GALEXPipelineDataGuide.pdf. The output image has been background subtracted, flux calibrated, and astrometrically corrected to an accuracy of 1′′.
We measured the brightness of all sources on each image, in both filters, using the SExtractor software package (version 2.5.0; Bertin & Arnouts, 1996). The full width at half maximum (FWHM) of point sources on each image subtends 3.2 pixels. Given the pixel scale of the detector (1.5′′ pixel-1), the angular FWHM is 4.8′′ (the FWHM for the exposures is slightly smaller at 4.2′′). The aperture size was set to the FWHM, and each source with counts more than above the mean local sky-subtracted background was considered a detection. The resulting catalog included a large number of artifacts at the circular edges of each image. We trimmed the catalogs to only include a fraction of the total radius, i.e. 0.5625 deg from the center (1325 pixels) giving a total area 0.994 deg2 for each field. This resulted in a total number of 102385 objects in the combined data. Approximately 15% of the sources were also detected at significance in the images. The sources that were undetected in the images were retained in the final catalogs but flagged to note that a precise color is not available. The sources without significant flux are unlikely to correspond to UV-bright sources background to M31. The fixed-aperture photometry for all sources detected in the band is presented in Table 2.
The reduced images from the GALEX pipeline record the data in flux units where one digital number (DN) corresponds to for the images and for the images. The conversion from flux to AB magnitudes for GALEX data is given by222http://www.galex.caltech.edu/researcher/techdoc-ch2.html
| (1) |
| (2) |
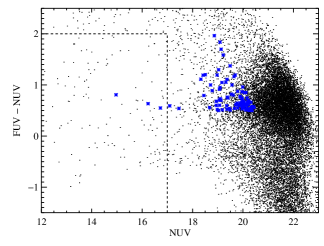
where 18.82 and 20.08 are the corresponding zero point AB magnitudes. A color magnitude diagram of all sources detected in both filters in our survey is presented in Figure 2.
| ID | Date | FWHM | ||
|---|---|---|---|---|
| (UT) | (pix) | |||
| N2 | 25 Nov 2006 | 00:42:43.82 | 44:13:51.18 | 2.1 |
| N3 | 25 Nov 2006 | 00:41:47.79 | 45:18:04.08 | 2.2 |
| N4 | 25 Nov 2006 | 00:41:30.95 | 46:12:03.05 | 2.1 |
| NW2 | 25 Nov 2006 | 00:30:56.26 | 46:40:35.03 | 2.1 |
| NW3 | 25 Nov 2006 | 00:28:12.22 | 43:15:04.82 | 2.1 |
| NW5 | 25 Nov 2006 | 00:25:00.27 | 45:12:02.60 | 2.2 |
| NW6 | 25 Nov 2006 | 00:19:50.17 | 45:28:11.29 | 2.1 |
| W2 | 25 Nov 2006 | 00:24:42.47 | 42:27:05.58 | 2.2 |
| W3 | 25 Nov 2006 | 00:27:00.63 | 41:16:16.73 | 2.5 |
| W4 | 25 Nov 2006 | 00:23:49.94 | 41:21:06.52 | 2.4 |
| W5 | 25 Nov 2006 | 00:19:34.69 | 41:15:28.28 | 2.3 |
| W5 | 25 Nov 2006 | 00:19:32.88 | 41:15:29.22 | 2.0 |
| W6 | 25 Nov 2006 | 00:15:18.02 | 41:43:00.03 | 2.1 |
| W7 | 25 Nov 2006 | 00:09:36.34 | 40:30:06.84 | 2.0 |
| SW2 | 25 Nov 2006 | 00:37:12.29 | 38:31:56.55 | 1.7 |
| SW4 | 25 Nov 2006 | 00:32:24.28 | 37:30:10.10 | 1.7 |
| SW5 | 25 Nov 2006 | 00:26:57.67 | 36:36:10.68 | 1.4 |
| SW6 | 25 Nov 2006 | 00:22:52.89 | 36:32:59.41 | 1.5 |
| SW6 | 25 Nov 2006 | 00:22:56.29 | 36:33:06.41 | 1.9 |
| SW2 | 25 Nov 2006 | 00:22:56.29 | 36:33:06.41 | 1.8 |
| S2 | 25 Nov 2006 | 00:43:17.61 | 38:11:48.18 | 2.0 |
| S3 | 25 Nov 2006 | 00:42:49.96 | 37:31:27.13 | 2.0 |
| S4 | 25 Nov 2006 | 00:44:29.66 | 36:25:28.32 | 1.8 |
| S5 | 25 Nov 2006 | 00:43:14.14 | 35:31:31.18 | 1.8 |
| SE1 | 25 Nov 2006 | 00:50:06.02 | 39:34:20.02 | 1.7 |
| SE2 | 25 Nov 2006 | 00:54:54.16 | 39:34:19.68 | 1.6 |
| SE3 | 25 Nov 2006 | 00:55:14.42 | 36:55:59.73 | 1.9 |
| E2 | 25 Nov 2006 | 00:58:54.44 | 42:18:25.27 | 1.9 |
| SE5 | 25 Nov 2006 | 01:03:18.28 | 38:21:27.97 | 1.6 |
| SE7 | 25 Nov 2006 | 01:07:56.74 | 36:57:11.77 | 2.0 |
| SE9 | 25 Nov 2006 | 01:13:53.69 | 35:24:48.86 | 1.8 |
| E6 | 25 Nov 2006 | 01:14:30.60 | 42:12:24.98 | 1.7 |
| SE11 | 25 Nov 2006 | 01:21:13.28 | 34:21:31.33 | 2.0 |
| SE12 | 25 Nov 2006 | 01:23:49.48 | 33:33:13.89 | 1.7 |
| SE13 | 25 Nov 2006 | 01:27:00.06 | 32:56:03.59 | 1.8 |
| SE14 | 25 Nov 2006 | 01:30:10.64 | 32:18:52.31 | 1.8 |
| S6 | 28 Nov 2006 | 00:41:33.84 | 34:47:32.00 | 1.7 |
| NE2 | 28 Nov 2006 | 00:49:09.75 | 43:26:47.30 | 1.5 |
| NE3 | 28 Nov 2006 | 00:53:17.98 | 44:49:43.30 | 1.8 |
| NE4 | 28 Nov 2006 | 00:52:58.79 | 45:13:39.10 | 1.4 |
| E3 | 28 Nov 2006 | 00:58:29.82 | 41:16:30.15 | 2.0 |
| E4 | 28 Nov 2006 | 01:03:14.52 | 40:26:35.91 | 1.9 |
| E5 | 28 Nov 2006 | 01:06:05.88 | 42:12:21.39 | 1.6 |
| NE6 | 28 Nov 2006 | 01:02:42.45 | 46:18:18.82 | 2.0 |
| NE5 | 28 Nov 2006 | 01:04:06.49 | 45:18:20.05 | 1.9 |
| SE10 | 28 Nov 2006 | 01:17:27.75 | 34:36:28.51 | 2.0 |
Note: The ID represents the direction with respect to the center of M31. Observations were taken with an R-band filter (6200-7500) with an FOV and an exposure time of 60s. The pointings are intended to overlap with the data we received from GALEX. The FWHM values were estimated from the images directly.
3 KPNO Imaging
To increase the efficiency of selecting quasar candidates, we chose to extend our baseline to include optical photometry in the -band (e.g. Atlee & Gould, 2007). Although our GALEX data revealed many thousands of bright and blue UV sources, these data by themselves do not provide an efficient means of selecting quasar candidates. We acquired -band images using the WIYN Mosaic-1 imager on the KPNO 0.9 meter WIYN telescope. This section describes the observations, data reduction, and analysis of these images.
3.1 Image Reduction
On the nights of 25–28 November 2006, we acquired 43 -band images covering nearly the entire area of our GALEX imaging program. We used the WIYN Mosaic-1 imager which records the data in a mosaic of eight CCDs, each one with a viewing area of ( pixel-1). Therefore, each mosaic image has a total area of , similar to each of our GALEX images. A single Mosaic-1 frame overlapping each GALEX image was obtained with an exposure time of 60 seconds. The nights were relatively clear but thin cirrus precludes precise photometric calibration from standard star fields observed during this run. The seeing ranged from 1 to 2′′, and the airmass was 1.6 for all observations.
The band images were reduced using standard IRAF tasks in the mscred module. We first calculated coefficients for each chip of the mosaic data to account for cross-talk between adjacent CCDs. We applied the bad pixel masks, and then subtracted a mean bias frame from each of the raw images. Finally, we corrected for pixel-to-pixel variations by dividing the images by a combined dome flat field. The resulting images, over the full mosaic, showed significant sky gradients caused by spatial and temporal variations in our sky flats. To remove the gradients, we used the IRAF task mscskysub to fit a surface to each CCD and subtract the mean background value. In this process, the subtraction ignored large residuals which represent actual objects on the images. The mscskysub task is typically used to smooth out the background sky after stitching together individual CCDs to create a large mosaic image. Although we executed this task on individual chips, we checked and confirmed that the photometry derived from the images with and without this processing showed very little difference () in the results, provided one performs local sky subtraction. Cosmic rays were not removed or flagged, but the images were short exposures and therefore would have a small contamination rate.
3.2 Astrometry and Photometry
We measured the positions and magnitudes of all sources separately on each of the eight CCDs of the mosaic. Because our observational design consists of a single exposure of each field, this leads to 368 total sub-images. The world coordinate system information recorded in the image headers was systematically in error. We therefore submitted each of the 368 images to Astrometry.net (Hogg et al., 2008) to yield a better estimate of the field center and overall solution. The resulting solution provided an adequate fit over most of the field of view, but some residual mismatch was still seen towards the corners of the chips. The solution was iterated using the wcstools module within IRAF by matching only a subset of the brightest, well measured stars to the USNO-B1.0 catalog. The fitting function was a quadratic polynomial after the initial offsets, scales, and rotations were calculated. Recentering of the image center was allowed, as well as sigma clipping of objects that were more than 2 from the expected location based on the previous fit. For the best frames, the rms residual of the solution was less than 0.3′′ based on several dozen guide stars. For a few of the frames, less than 10 stars were found in common between our catalog and the USNO and we could not recover a useful astrometric soluation; these frames were ignored in all subsequent analysis.
Point-spread function (PSF) photometry was performed on each processed image using DAOPHOT and ALLSTAR (Stetson, 1994). As the seeing varied from 1′′ to 2′′ during the observing run, the fitting radius was set separately for each image to be 80% of the image FWHM. This was measured using the imexam IRAF task for a number of bright, isolated, non-saturated stars (see Table 3). All sources more than 3 above the local background were considered positive detections. A PSF template was calculated using 50 bright stars on each frame, and fit to and subtracted from each source to create a residual image. A second pass of the photometry was made on this residual image to yield the final catalog.
We calibrated the magnitudes by comparing to the USNO catalog, which has an magnitude and a color. The overlap between our optical source catalog and the USNO catalog ranged from = 10 to 19. We fit for a color term and offset for each CCD individually, after applying a cut to eliminate outliers that were more than 2 from the mean. We note that the offsets varied by several tenths of a magnitude for different CCDs. We found that the typical limiting magnitude for our detection criterion is . The -band photometry of all KPNO sources that were matched to a GALEX detection are listed in Table 2.
4 QSO Candidates
4.1 Catalog Combination
Our total catalog of GALEX detections via SExtractor, after eliminating duplicates, contained 98629 objects, which were determined by detection in the NUV. Duplicate detections were chosen to be within , and the magnitudes taken from the entry with the smallest error. Objects without a corresponding FUV detection were given a magnitude value of 99.99 and an error of -1. The total KPNO catalog, after eliminating erroneous detections, totalled 144,531 objects. To find matches between the catalogs we tested for the nearest object within . The matched GALEX+KPNO catalog contained 39437 objects. Given the low source density of objects in our relatively shallow -band images, we estimate that the number of spurious matchees is fewer than 200.
4.2 Candidates
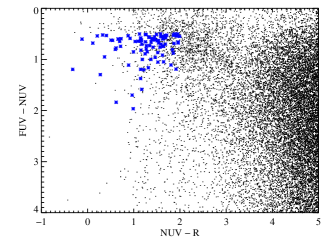
The criteria we used to define a quasar candidate list were taken from previous papers on QSO detections using a combination of GALEX and optical data (Bianchi & et al., 2007; Atlee & Gould, 2007). The general approach is to take the area in color-color space which maximizes the density of QSOs while minimizing contaminants. QSO colors that include GALEX observations have been measured using the SDSS database. The selections fall into an area defined by searching within these limiting values: , , and . The process, as done by Bianchi & et al. (2007), gives an 85% success rate in comparing QSOs identifed by color and those spectroscopically confirmed. This is consistent with our own results, as detailed in 5.
| Name | Date | Exp. | ||
|---|---|---|---|---|
| (J2000) | (J2000) | (UT) | (s) | |
| J000817+400223 | 00:08:17 | +40:02:23 | 28Sep2008 | 600 |
| J000825+400345 | 00:08:25 | +40:03:45 | 28Sep2008 | 600 |
| J001036+400314 | 00:10:36 | +40:03:14 | 25Sep2008 | 600 |
| J001117+402202 | 00:11:17 | +40:22:02 | 26Sep2008 | 800 |
| J001502+412756 | 00:15:02 | +41:27:56 | 28Sep2008 | 600 |
| J001553+412026 | 00:15:53 | +41:20:26 | 25Sep2008 | 600 |
| J001601+411820 | 00:16:01 | +41:18:20 | 29Sep2008 | 720 |
| J001632+414752 | 00:16:32 | +41:47:52 | 26Sep2008 | 800 |
| J001836+411611 | 00:18:36 | +41:16:11 | 28Sep2008 | 300 |
| J002007+450802 | 00:20:07 | +45:08:02 | 26Sep2008 | 900 |
[The complete version of this table is in the electronic edition. The printed edition contains only a sample.]
![[Uncaptioned image]](/html/0907.1688/assets/x5.png)
![[Uncaptioned image]](/html/0907.1688/assets/x7.png)
5 Discovery Spectra
We obtained spectra for a handful of our candidates during unrelated observing runs in Winter 2008 at the Keck and Lick Observatories with the LRIS (Oke et al., 1995) and Kast spectrometers respectively. Several of these spectra revealed extragalactic sources including two AGN. We then initiated a spectroscopic follow-up campaign at Lick Observatory. The first results of this survey are presented here.
Table 4 summarizes the observations of QSO candidates obtained during a five night run at Lick Observatory (September 2529, 2008). These were drawn primarily from the candidate list given in Table 2, but were supplemented by targets with slightly less stringent color criteria. For all observations we used the Kast spectrograph mounted on the Lick 3m telescope. The instrument was configured with the -wide slit and the D55 dichroic that split the light into the blue and red cameras. We employed the 452/3306 grism on the blue side giving a FWHMÅ spectral resolution for wavelengths spanning 33005400Å. On the red side, we used the 600/7500 grating tilted to provide coverage from 56008000Å with a FWHMÅ spectral resolution. We took spectral images of Ar, He, Cd, and quartz lamps for wavelength calibration and flat-fielding.
| Name | ||||||
| (J2000) | (J2000) | (kpc) | (AB) | (AB) | ||
| AGN (Broad Emission Lines) | ||||||
| J000825+400345 | 00:08:25 | +40:03:45 | 90 | 19.14 | 18.78 | 0.51 |
| J001632+414752 | 00:16:32 | +41:47:52 | 67 | 20.53 | 19.97 | 1.98 |
| J002007+450802 | 00:20:07 | +45:08:02 | 77 | 20.93 | 19.09 | 0.82 |
| J002026+451251 | 00:20:26 | +45:12:51 | 77 | 20.36 | 19.54 | 1.25 |
| J002153+452422 | 00:21:53 | +45:24:22 | 77 | 20.83 | 18.86 | 0.89 |
| J002209+452453 | 00:22:09 | +45:24:53 | 76 | 20.98 | 20.32 | 0.93 |
| J002430+452836 | 00:24:30 | +45:28:36 | 73 | 20.63 | 19.97 | 0.82 |
| J002442+405546 | 00:24:42 | +40:55:46 | 47 | 20.80 | 19.22 | 0.82 |
| J002742+451458 | 00:27:42 | +45:14:58 | 66 | 19.24 | 18.45 | 0.97 |
| J002912+433216 | 00:29:12 | +43:32:16 | 46 | 19.22 | 18.96 | 0.45 |
| J003132+372752 | 00:31:32 | +37:27:52 | 60 | 19.83 | 19.10 | 1.32 |
| J003407+373520 | 00:34:07 | +37:35:20 | 55 | 20.37 | 19.32 | 1.33 |
| J004123+375856 | 00:41:23 | +37:58:56 | 45 | 19.14 | 18.73 | 0.38 |
| J004133+352619 | 00:41:33 | +35:26:19 | 80 | 19.77 | 19.06 | 0.89 |
| J004207+364255 | 00:42:07 | +36:42:55 | 62 | 20.81 | 19.65 | 1.50 |
| J004426+345909 | 00:44:26 | +34:59:09 | 86 | 19.39 | 19.10 | 0.44 |
| J005042+432337 | 00:50:42 | +43:23:37 | 35 | 19.71 | 18.71 | 0.66 |
| J005117+432160 | 00:51:17 | +43:21:60 | 36 | 20.48 | 19.37 | 1.40 |
| J005305+391453 | 00:53:05 | +39:14:53 | 39 | 20.89 | 19.69 | 1.00 |
| J005617+393437 | 00:56:17 | +39:34:37 | 42 | 19.98 | 19.06 | 1.13 |
| J010048+420457 | 01:00:48 | +42:04:57 | 47 | 19.67 | 18.78 | 0.62 |
| J010446+414838 | 01:04:46 | +41:48:38 | 57 | 19.71 | 18.51 | 0.80 |
| J010452+450843 | 01:04:52 | +45:08:43 | 76 | 20.14 | 19.38 | 1.37 |
| J010550+422457 | 01:05:50 | +42:24:57 | 61 | 19.70 | 19.18 | 0.28 |
| J010614+414758 | 01:06:14 | +41:47:58 | 60 | 20.34 | 19.72 | 0.52 |
| J010943+370450 | 01:09:43 | +37:04:50 | 91 | 19.86 | 19.63 | 0.29 |
| J010950+365843 | 01:09:50 | +36:58:43 | 92 | 20.87 | 19.49 | 0.88 |
| J012122+343640 | 01:21:22 | +34:36:40 | 137 | 20.21 | 19.17 | 1.52 |
| J012309+342049 | 01:23:09 | +34:20:49 | 143 | 19.24 | 18.91 | 0.27 |
| J012706+325248 | 01:27:06 | +32:52:48 | 165 | 19.78 | 19.35 | 0.84 |
| J012903+320817 | 01:29:03 | +32:08:17 | 176 | 20.56 | 19.56 | 1.11 |
| Galaxies (Narrow Emission Lines) | ||||||
| J000817+400223 | 00:08:17 | +40:02:23 | 91 | 19.38 | 18.94 | 0.045 |
| J001036+400314 | 00:10:36 | +40:03:14 | 85 | 19.23 | 18.68 | 0.033 |
| J001117+402202 | 00:11:17 | +40:22:02 | 82 | 20.83 | 19.96 | 0.085 |
| J001553+412026 | 00:15:53 | +41:20:26 | 69 | 19.53 | 19.03 | 0.048 |
| J001601+411820 | 00:16:01 | +41:18:20 | 68 | 19.68 | 19.31 | 0.069 |
| J002541+423336 | 00:25:41 | +42:33:36 | 47 | 20.63 | 20.11 | 0.138 |
| J004126+445652 | 00:41:26 | +44:56:52 | 50 | 20.66 | 20.03 | 0.092 |
| J004144+460148 | 00:41:44 | +46:01:48 | 65 | 20.67 | 19.79 | 0.114 |
| J004222+350017 | 00:42:22 | +35:00:17 | 85 | 20.57 | 20.01 | 0.067 |
| J004301+445242 | 00:43:01 | +44:52:42 | 49 | 20.34 | 19.79 | 0.090 |
| J004307+355523 | 00:43:07 | +35:55:23 | 73 | 20.20 | 19.66 | 0.110 |
| J004440+360333 | 00:44:40 | +36:03:33 | 71 | 19.89 | 19.37 | 0.054 |
| J004502+355727 | 00:45:02 | +35:57:27 | 73 | 19.92 | 19.46 | 0.027 |
| J005651+395237 | 00:56:51 | +39:52:37 | 41 | 20.66 | 19.98 | 0.070 |
| J005754+414153 | 00:57:54 | +41:41:53 | 39 | 20.71 | 20.04 | 0.090 |
| J005758+405834 | 00:57:58 | +40:58:34 | 39 | 20.76 | 20.26 | 0.083 |
| J005832+423847 | 00:58:32 | +42:38:47 | 44 | 20.65 | 20.04 | 0.089 |
| J005948+405227 | 00:59:48 | +40:52:27 | 44 | 20.86 | 20.36 | 0.079 |
| J010227+402643 | 01:02:27 | +40:26:43 | 52 | 20.73 | 20.19 | 0.252 |
| J010552+363321 | 01:05:52 | +36:33:21 | 89 | 20.69 | 19.95 | 0.126 |
| J011324+414531 | 01:13:24 | +41:45:31 | 79 | 20.75 | 20.15 | 0.101 |
| J011436+415018 | 01:14:36 | +41:50:18 | 82 | 20.96 | 20.38 | 0.133 |
| J011619+414737 | 01:16:19 | +41:47:37 | 86 | 20.91 | 20.16 | 0.121 |
| J012436+325122 | 01:24:36 | +32:51:22 | 161 | 19.83 | 19.13 | 0.109 |
| J012950+324441 | 01:29:50 | +32:44:41 | 172 | 18.54 | 18.04 | 0.046 |
| J013010+321151 | 01:30:10 | +32:11:51 | 178 | 20.79 | 20.26 | 0.076 |
| J013021+321336 | 01:30:21 | +32:13:36 | 178 | 20.97 | 20.12 | 0.046 |
| J013033+320958 | 01:30:33 | +32:09:58 | 179 | 20.37 | 19.75 | 0.136 |
| J013036+320859 | 01:30:36 | +32:08:59 | 179 | 19.54 | 18.94 | 0.021 |
Note: a: Impact parameter from the center of M31, taken to be 00:42:44.3, = +41:16:09 (J2000), for an assumed distance of 783 kpc.
The data were reduced with the LowRedux333http://www.ucolick.org/xavier/LowRedux/index.html package developed by J. Hennawi, S. Burles, and JXP that is bundled within the XIDL444http://www.ucolick.org/xavier/IDL/ software package. The data were flat fielded to remove pixel-to-pixel variations, wavelength calibrated, sky subtracted, and optimally extracted. The 1D spectra were corrected for instrumental flexure and then flux calibrated using a sensitivity function derived from observations of a spectrophotometric standard taken the first night. All nights were clear and likely to have been nearly photometric. The absolute flux calibration of the data is not accurate because of slit losses but we estimate the relative fluxing is accurate to within . For targets with multiple exposures, we coadded the 1D spectra after weighting by the median inverse variance.
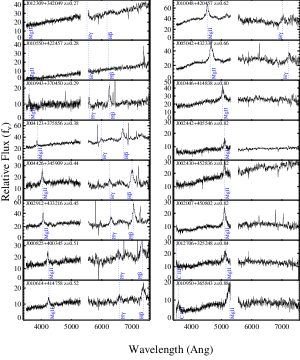
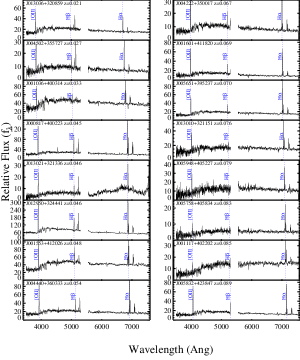
Each 1D spectrum of our quasar candidates was visually analyzed for significant absorption and emission lines to perform object classification. The principle contaminants to the quasar candidates are: (i) foreground Galactic stars that show prominent Balmer absorption lines and (ii) star-forming galaxies that exhibit narrow emission lines and occasional CaH+K and Balmer absorption lines. In nearly every spectrum, we identified multiple emission and/or absorption features which unambiguously classified the object and yielded an estimate of the target’s redshift. All of the extragalactic sources are listed in Table 5. We characterize objects with narrow emission lines as galaxies and report all others as AGN (many of these may be more properly classified as quasars). There is one source (J012309+342049) that exhibits a nearly featureless spectrum across our full wavelength coverage. The absence of Balmer absorption features rules out this target as a Galactic star. We initially classified it as an unknown extragalactic source and suspected it to be a blazar. Indeed, a search using SIMBAD revealed this source was previously known as a BL Lacertae object at (Perlman et al., 1996). One of the other AGN was also previously discovered using X-ray imaging (J002742+451457; Xie et al., 1997). Spectra of all the extragalactic sources are shown in Figures 4 and 5.
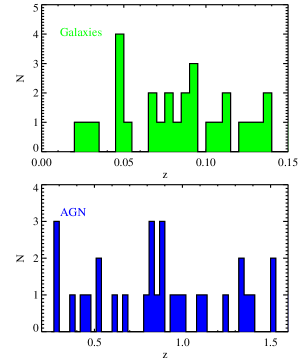
Of the targets drawn from our primary candidate list for spectroscopic study (59 total from Table 2), 85 were verified as extragalactic and half of these show broad-lines indicating strong AGN activity. The redshift distributions of the objects are given in Figure 6. The galaxies discovered by our survey are generally blue, faint star-forming systems with typical late-type spectra. A significant number of the higher redshift systems, however, have red continua and exhibit absorption lines characteristic of early-type systems. We interpret their significant UV fluxes as signatures of the so-called “UV upturn” observed in early-type galaxies (e.g. O’Connell, 1999).
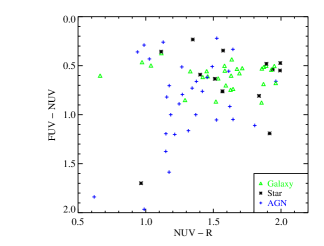
Regarding the stellar contaminants, the majority of these were especially bright ( mag) and could have been avoided by imposing a brightness limit to the candidate criteria. On the other hand, if any of these had been confirmed as AGN they would have been especially valuable as probes of M31’s halo. Figure 7 shows that the targets classified as AGN have systematically redder color and systematically bluer colors than the typical galaxies observed. By restricting the pre-selection to and , one would likely increase the efficiency of quasar selection. The cut on color, however, would also reduce the number of candidates with higher flux. We plan for a future observing run in Fall 2009 to confirm additional candidates.
6 Summary
Adopting color-color criteria based on KPNO/, GALEX/, and GALEX/ photometry, we have culled a list of quasar candidates (Table 2) from 50 deg2 out to 150 kpc. We have obtained follow-up spectroscopy for 59 of these ”tier 1” candidates and an additional 27 objects with less restrictive color-color criteria. We report the detection of 30 broad-lined targets which we classify as AGN and one featureless source which is a previously known blazar. We also report on 29 galaxies ranging from to .
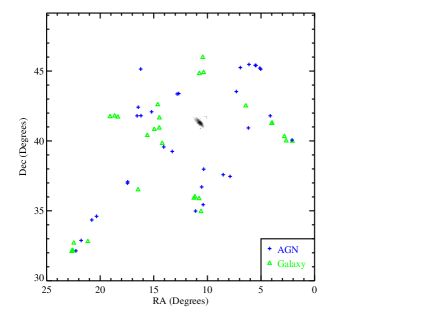
The AGN are distributed across M31’s halo with impact parameters ranging from 35 to 180 kpc (Figure 8). Roughly half of these sources are sufficiently bright for follow-up UV spectroscopy using the HST/COS spectrometer, albeit with multi-orbit exposures. Such spectra could be used to examine the spatial distribution of enriched gas via absorption-line analysis of transitions like 1260, 1393,1402, and 1548,1550, revealing the metallicity, gas kinematics, molecular content, and the nature of M31’s ionized gas. As the identified QSOs are distributed throughout M31, the sampling of this gas content directly aids in our understanding of galaxy formation processes through the deconvolution of disc/halo regions and the interpretation of accretion events such as the giant southern stream. Recent work has characterized the properties and distribution of stars across these regions of M31, but an unambiguous separation of the components requires a sampling of the gas dynamics.
Future surveys (e.g., PAndAS and PAndromeda) will soon lead to global maps of M31 and we can target future QSO surveys to interesting regions with/without substructure. The area that is covered by our GALEX pointings is small relative to the (yet) unobserved M31 halo through optical imaging.
Various surveys of M31, most notably the SDSS, have revealed many QSO detections, but focused on the disc itself. This project used those tools to extend the search to the newly discovered halo of M31. Future searches for quasars toward M31 in pointings not covered by this survey could provide an additional hundred or more targets for such analysis.
Acknowledgments
AF, JXP JSK, and PG acknowledge support NASA grant NNG06GD37G, as part of the GALEX GO program. PG and JSK acknowledge support from NSF grant AST-0607852. J. S. was supported by NASA through a Hubble Fellowship, administered by the Space Telescope Science Institute, which is operated by the Association of Universities for Research in Astronomy, Incorporated, under NASA contract NAS5-26555.
References
- Allen et al. (2008) Allen S. W., Rapetti D. A., Schmidt R. W., Ebeling H., Morris R. G., Fabian A. C., 2008, MNRAS, 383, 879
- Atlee & Gould (2007) Atlee D. W., Gould A., 2007, ApJ, 664, 53
- Bertin & Arnouts (1996) Bertin E., Arnouts S., 1996, Astronomy and Astrophysics Supplement, 117, 393
- Bianchi & et al. (2007) Bianchi L., et al. 2007, ApJS, 173, 659
- Brown et al. (2007) Brown T. M., Smith E., Ferguson H. C., Guhathakurta P., Kalirai J. S., Rich R. M., Renzini A., Sweigart A. V., Reitzel D., Gilbert K. M., Geha M., 2007, ApJ, 658, L95
- Chen et al. (2001) Chen H.-W., Lanzetta K. M., Webb J. K., 2001, ApJ, 556, 158
- Chen & Prochaska (2000) Chen H.-W., Prochaska J. X., 2000, ApJ, 543, L9
- Chen & Tinker (2008) Chen H.-W., Tinker J. L., 2008, ArXiv e-prints, 801
- Churchill et al. (2000) Churchill C. W., Mellon R. R., Charlton J. C., Jannuzi B. T., Kirhakos S., Steidel C. C., Schneider D. P., 2000, ApJS, 130, 91
- Dekel et al. (2008) Dekel A., Birnboim Y., Engel G., Freundlich J., Goerdt T., Mumcuoglu M., Neistein E., Pichon C., Teyssier R., Zinger E., 2008, ArXiv e-prints
- Forman & Jones (1982) Forman W., Jones C., 1982, ARA&A, 20, 547
- Fukugita et al. (1998) Fukugita M., Hogan C. J., Peebles P. J. E., 1998, ApJ, 503, 518
- Gilbert et al. (2007) Gilbert K. M., Fardal M., Kalirai J. S., Guhathakurta P., Geha M. C., Isler J., Majewski S. R., Ostheimer J. C., Patterson R. J., Reitzel D. B., Kirby E., Cooper M. C., 2007, ApJ, 668, 245
- Gilbert et al. (2006) Gilbert K. M., Guhathakurta P., Kalirai J. S., Rich R. M., Majewski S. R., Ostheimer J. C., Reitzel D. B., Cenarro A. J., Cooper M. C., Luine C., Patterson R. J., 2006, ApJ, 652, 1188
- Guhathakurta et al. (2005) Guhathakurta P., Ostheimer J. C., Gilbert K. M., Rich R. M., Majewski S. R., Kalirai J. S., Reitzel D. B., Patterson R. J., 2005, arXiv preprint (astro-ph/0502366)
- Guhathakurta et al. (2006) Guhathakurta P., Rich R. M., Reitzel D. B., Cooper M. C., Gilbert K. M., Majewski S. R., Ostheimer J. C., Geha M. C., Johnston K. V., Patterson R. J., 2006, AJ, 131, 2497
- Hogg et al. (2008) Hogg D. W., Blanton M., Lang D., Mierle K., Roweis S., 2008, in Argyle R. W., Bunclark P. S., Lewis J. R., eds, Astronomical Data Analysis Software and Systems XVII Vol. 394 of Astronomical Society of the Pacific Conference Series, Automated Astrometry (Invited). pp 27–+
- Ibata et al. (2007) Ibata R., Martin N. F., Irwin M., Chapman S., Ferguson A. M. N., Lewis G. F., McConnachie A. W., 2007, ApJ, 671, 1591
- Kacprzak et al. (2007) Kacprzak G. G., Churchill C. W., Steidel C. C., Ceverino D., Klypin A. A., Murphy M. T., 2007, ArXiv e-prints, 710
- Kalirai et al. (2006) Kalirai J. S., Gilbert K. M., Guhathakurta P., Majewski S. R., Ostheimer J. C., Rich R. M., Cooper M. C., Reitzel D. B., Patterson R. J., 2006, ApJ, 648, 389
- Kereš et al. (2005) Kereš D., Katz N., Weinberg D. H., Davé R., 2005, MNRAS, 363, 2
- Lanzetta & Bowen (1992) Lanzetta K. M., Bowen D. V., 1992, ApJ, 391, 48
- Morrissey & GALEX Science Team (2005) Morrissey P., GALEX Science Team 2005, in Bulletin of the American Astronomical Society Vol. 37 of Bulletin of the American Astronomical Society, A Flight Performance Update for the Galaxy Evolution Explorer (GALEX). pp 1454–+
- Mulchaey et al. (1996) Mulchaey J. S., Davis D. S., Mushotzky R. F., Burstein D., 1996, ApJ, 456, 80
- Mulchaey et al. (2003) Mulchaey J. S., Davis D. S., Mushotzky R. F., Burstein D., 2003, ApJS, 145, 39
- O’Connell (1999) O’Connell R. W., 1999, ARA&A, 37, 603
- Oke et al. (1995) Oke J. B., Cohen J. G., Carr M., Cromer J., Dingizian A., Harris F. H., Labrecque S., Lucinio R., Schaal W., Epps H., Miller J., 1995, PASP, 107, 375
- Perlman et al. (1996) Perlman E. S., Stocke J. T., Schachter J. F., Elvis M., Ellingson E., Urry C. M., Potter M., Impey C. D., Kolchinsky P., 1996, ApJS, 104, 251
- Prochaska & Tumlinson (2008) Prochaska J. X., Tumlinson J., 2008, ArXiv e-prints
- Stetson (1994) Stetson P. B., 1994, PASP, 106, 250
- Thilker et al. (2004) Thilker D. A., Braun R., Walterbos R. A. M., Corbelli E., Lockman F. J., Murphy E., Maddalena R., 2004, ApJ, 601, L39
- Tripp et al. (2007) Tripp T. M., Sembach K. R., Bowen D. V., Savage B. D., Jenkins E. B., Lehner N., Richter P., 2007, ArXiv e-prints, 706
- Xie et al. (1997) Xie G., Cha G., Bai J., Li K., Brinkmann W., 1997, Acta Astrophysica Sinica, 17, 437
- Zibetti et al. (2007) Zibetti S., Ménard B., Nestor D. B., Quider A. M., Rao S. M., Turnshek D. A., 2007, ApJ, 658, 161