Wide-Field Imaging and Polarimetry for the Biggest and Brightest in the 20 GHz Southern Sky
Abstract
We present the wide-field imaging and polarimetry at of seven of the most extended, bright ( Jy), high-frequency selected radio sources in the southern sky with declinations . Accompanying the data are brief reviews of the literature for each source. The results presented here aid in the statistical completeness of the Australia Telescope 20 GHz Survey (AT20G) Bright Source Sample (Massardi et al. 2008; Burke-Spolaor et al., in prep). The data is of crucial interest for future CMB missions as a collection of information about candidate calibrator sources. We were able to obtain data for seven of the nine sources identified by our selection criteria. We report that Pictor A is thus far the best extragalactic calibrator candidate for the Low Frequency Instrument (LFI) of the Planck ESA mission due to its high level of integrated polarized flux density ( Jy) on a scale of 10 arcminutes. Six out of the seven sources have a clearly detected compact radio core in our images, with either a null detection or less than 2 percent detection of polarised emission from the nuclei. Most sources with detected jets have magnetic field alignments running in a longitudinal configuration, however PKS 1333-33 exhibits transverse fields and an orthogonal change in field geometry from nucleus to jets.
keywords:
polarization – radio continuum: galaxies – galaxies: magnetic fields – galaxies: active – cosmology: cosmic microwave background – galaxies: individual: Centaurus A, Centaurus B, Pictor A, PKS 0131-36, PKS 1333-33, PKS 1610-60, PKS 2153-69, PKS 2356-611 Introduction
The Australia Telescope 20 GHz survey (AT20G) is a blind 20 GHz survey of the whole southern sky (Ricci et al., 2004). The project outlined in this paper complements two sub-projects of the AT20G Survey; the first is the AT20G Bright Source Sample (Massardi et al., 2008, BSS), and the second a high-sensitivity polarisation study of a subset of the BSS (Burke et al., in prep). The collective goal of these sister projects was to analyse the total intensity and polarisation statistical properties for a flux density limited sample of sources selected at 20 GHz. The BSS used sources south of , while the Burke sample focussed on sources south of . Both samples included all extragalactic AT20G objects which were brighter than 0.50 Jy, and are primarily comprised of a population of compact objects, with 85 percent showing a flat spectrum () at high radio frequency (Massardi et al., 2008).
This paper enhances the two projects by providing flux density and polarisation data for objects of angular extent beyond approximately 2.4 arcminutes, for which accurate data could not be obtained using a single interferometric synthesis field. This paper includes sources only sources south of .
Information about nearby, bright sources is of importance to observations of the Cosmic Microwave Background (CMB), in particular the current focus on detecting anisotropies in the polarised CMB signature. Thompson scattering on the Last Scattering Surface produces linear polarisation and curl-free patterns termed “E-modes,” which on small angular scales provide information about structures in the early Universe. Observations of compact CMB foreground sources are necessary to distinguish between real E-modes and signal scattered by gravitational lensing of the CMB on point source angular scales. Additionally, the diffuse plasmas in bright, extended extragalactic sources can form patterns which are termed “B-mode” polarisation (Hu, Hedman, and Zaldarriaga, 2003); B-mode signal in the radio lobes of extragalactic sources may be unsurprising and can be caused by complex magnetic fields in the sources and irregular substructures of different Faraday rotation. However, the positive detection of a similar B-mode polarisation signal in the CMB is a major goal of increasingly sensitive measurements of CMB anisotropy. A B-mode signal in the CMB is predicted to occur only by CMB models with tensor (gravitational wave) fluctuations; these are in turn tied to the rapid period of expansion that may have occured prior to the recombination epoch. The detection of B-mode CMB anisotropies will give insight into the energy scales that occurred directly prior to inflation and would suggest the presence of gravitational waves. However, the amplitude of the cosmological B-mode signals is extremely small, and will require careful attention to foreground signals that might mimic it. On small angular scales where extended and complex foreground sources (such as radio galaxies) are resolved, removing contamination due to extragalactic sources becomes particularly important. For faint, confused, and unresolved extragalactic sources in CMB data, a statistical correction may become necessary to calibrate and interpret the results of a cosmic background B-mode analysis.
Bright, highly polarised sources are also necessary for upcoming CMB instruments, in particular, the ESA Planck satellite mission’s low frequency instrument (LFI), which will observe in bands between 30 and 70 GHz (Bersanelli and Mandolesi, 2000). Among the source types that have been pursued as potential flux density and polarisation calibrators for the instrument are extragalactic sources; however, as the spectral behaviour of the bright extragalactic population at high frequency is difficult to model, sources selected at lower frequency are not certain to be suitable calibrator candidates. With our observations, along with the catalogues of Massardi et al. (2008) and Burke et al. (in prep), we provide a list and homogeneous observations of bright and strongly polarised sources that are selected at a frequency closer to CMB observing frequencies than was previously available.
In §2 we outline the criteria used in the selection of our sources and summarise the literature accompanying each source. §3 details the data collection, calibration, and wide-field imaging process used to create our results. Finally, the data (full intensity and polarisation vector images and values) are presented in §4 with a discussion about the images, high frequency polarimetry, and the implications of our results. §5 provides a brief summary of our findings.
| Source Name | WMAP | R.A. | Dec. | redshift | Size (major axis) | Observed Regions | |
|---|---|---|---|---|---|---|---|
| ID | (J2000) | arcsec | kpc | (# mosaic subfields) | |||
| PKS 0131-36 | — | 01:33:33.2 | -36:29:11.0 | 0.0298 | 365 | 206 | Observed brighter western lobe |
| and core region (7 pointings) | |||||||
| Fornax A | WMAP 138 | 03:22:41.7 | -37:12:30 | 0.0059 | 2840 | 335 | Did not observe |
| (see §2) | |||||||
| Pictor A | WMAP 150 | 05:19:26.0 | -45:45:54 | 0.0342 | 442 | 293 | 13 pointings |
| Centaurus A | — | 13:25:27.0 | -43:01:00 | 0.0018 | 5∘ | 648 | Observed only 12’ inner |
| double (14 pointings) | |||||||
| PKS 1333-33 | WMAP 185 | 13:36:39.0 | -33:57:56 | 0.0125 | 1863 | 463 | Observed inner double (5’ inner |
| jet region) (7 pointings) | |||||||
| Centaurus B | — | 13:46:49.4 | -60:24:29 | 0.0129 | 960 | 239 | 24 pointings |
| PKS 1610-60 | — | 16:15:15.8 | -60:39:14.0 | 0.0184 | 755 | 274 | 16 pointings |
| PKS 2153-69 | WMAP 190 | 21:57:05.9 | -69:41:23.7 | 0.0283 | 110 | 61 | 2 pointings |
| PKS 2356-61 | WMAP 187 | 23:58:49.0 | -60:53:07 | 0.0963 | 381 | 661 | 7 pointings |
2 Source selection and Literature Review
The AT20G team’s confirmation followup observations to their initial transit scan survey provided a list of sources detected at 20 GHz, from which Burke et al. (in prep) selected a sample of sources at declinations whose total intensity exceeded 0.50 Jy. Preliminary results of an AT20G pilot survey are available in Sadler et al. (2006); a description of the blind scan and followup observations of the AT20G survey are available in Massardi et al. (2008). The 2.4 arcminute primary beam FWHM and the 80 to 200 metre interferometer spacings used in the AT20G followup did not provide accurate flux density measurements for the most extended sources, and furthermore left cases in which sources were either: 1) Fully resolved (and therefore undetected) by the 60 metre shortest antenna spacing of the AT20G followup, or 2) Had compact components (hotspots, cores) which were detected as separate, 0.50 Jy sources in the followup. The Sydney University Molonglo Sky Survey (SUMSS) (Mauch et al., 2003) and the Parkes-MIT-NRAO (PMN) Southern (Wright et al., 1994; Condon, Griffith, and Wright, 1993) and Zenith Surveys (Wright et al., 1996) have a higher sensitivity to extended radio sources. This is due to their more complete Fourier coverage for short baselines, and due to the lower observing frequency of the two surveys which allowed higher sensitivity to diffuse, steeper spectrum radio components (SUMSS at 0.843, PMN at 5 GHz).
To recover highly resolved 20 GHz sources, we cross-referenced multiple-component AT20G sources against SUMSS images. This indicated AT20G sources which appeared to be compact components of one larger, extended object. We then ran a search for sources which are highly extended and thus may have been completely resolved out by the AT20G obervations. We expect any extended source with Jy to have a 5 GHz flux of Jy if it has a spectral index of less than -0.5, as would be expected by a conservative estimate for the spectral index of diffuse emission. We thus compiled a list of the sources in the PMN catalogue which are flagged as extended and have an integrated 5 GHz intensity greater than 900 mJy. By including these objects and those selected at 20 GHz, this sample has a nominal flux limit for extended sources with Jy. However, due to the spatial resolution limit of PMN and our decision to include only sources flagged as extended in PMN, the sample is not complete for sources of scales between 2.4 and 4.2 arcminutes. The number of missing sources in this range is estimated to be between 4 and 10 based on source count extrapolations.
Sources which were associated with the Large and Small Magellanic Clouds (LMC, SMC) or in the Galactic plane () were excluded from the sample, as were supernova remnants with .
In summation, a source was included if it:
-
•
is in the region
-
•
is extragalactic (not including LMC, SMC).
-
•
was detected as a multiple-component (hotspots/core) source within the AT20G followup beam with a total flux of Jy.
or -
•
is marked in PMN as extended, with Jy.
If a source obeyed all the above criteria, it was included in our sample.
The resulting list from the searching process consisted of nine
objects. However, we did not observe Fornax A due to its highly
diffuse emission, most of which would remain undetected even in ATCA’s
most compact configuration (furthermore, attempts to detect the
nucleus of the galaxy at 20 GHz during unscheduled ATCA telescope
time were unsuccessful down to a few milliJansky). For some sources, only
subregions containing compact structure were observed. The full nine
sources detected by our criteria are listed in table
1, which provides information on what part of the source was observed (if
applicable).
Below, the radio morphology of each source is described, and significant
literature and interesting properties for each object are summarised.
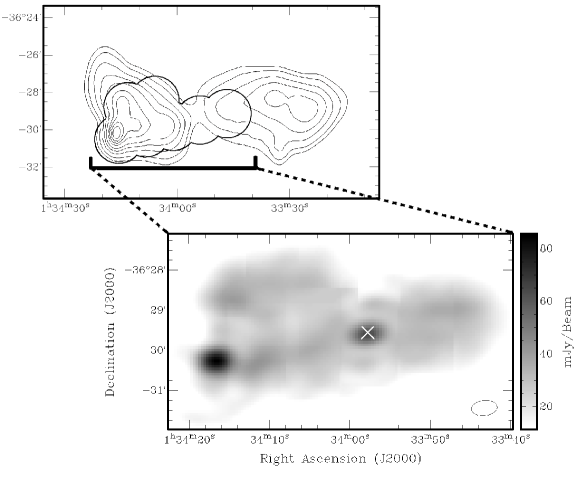
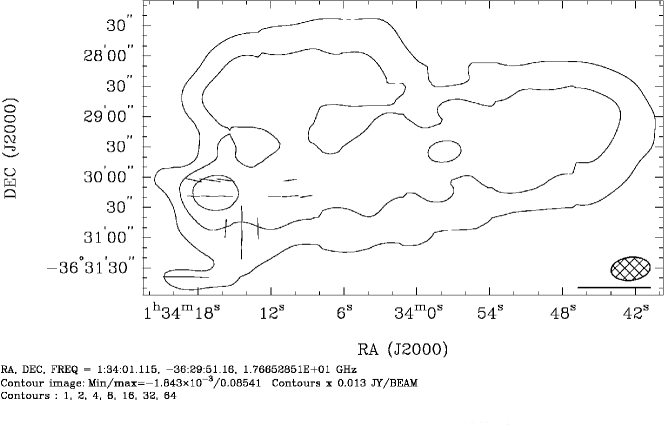
PKS 0131-36 (NGC612), figure 2: An asymmetric, Faranoff-Reilly II
source with a bright knot in one jet at low radio frequency (Mauch et al., 2003).
Associated at optical wavelengths with a magnitude 15 S0-type galaxy
(Bolton, Gardener, and Mackey, 1964). Westerlund and Smith (1966) note a radio-optical morphology similar to
Centaurus A, with a dust lane crossing the core and an asymmetric positioning
of the core along the axis of the two radio lobes. Recently, a study of HI gas in the galaxy demonstrated the existence of a huge, 140 kpc disk along NGC612’s dust lane and a faint bridge of HI emission to the nearby galaxy NGC619, indicating a possibly recent or ongoing interaction in this system (Emonts et al., 2008).
The source resides near the centre of a cluster of galaxies
(Schilizzi, 1975). Redshift measured by Ekers et al. (1978).
Fornax A (NGC1316): Fornax A is a highly diffuse,
symmetrical double-lobed galaxy extending approximately one degree along its
major axis. Source is associated with the peculiar S0 galaxy NGC1316
(Mills, 1954; Ferguson, 1989). The source resides in the Fornax cluster. The high
resolution observations of Geldzahler and Fomalont (1984) across 1.5, 4.9, and 15.0 GHz indicate
a steep-spectrum core and nonlinear jets. The large-scale structure of the
radio source was studied by Ekers et al. (1983), who noted a bridge of emission
extending between the lobes that is displaced from NGC1316’s centre; this
morphological feature and the complicated dynamics of the galaxy lead to their
description of a formation scenario involving multiple galaxy collisions.
Caon, Capaccioli, and D’Onofrio (1994) further suggest Fornax A’s host as a merger remnant, noting
tidal tails, filaments, dust lanes, and a low velocity dispersion. Although
too diffuse to make useful measurements with our telescope configuration, the
source was detected in WMAP at 23 GHz with a flux of
(Bennett et al., 2003). The redshift given in the table is as measured by Longhetti et al. (1998).
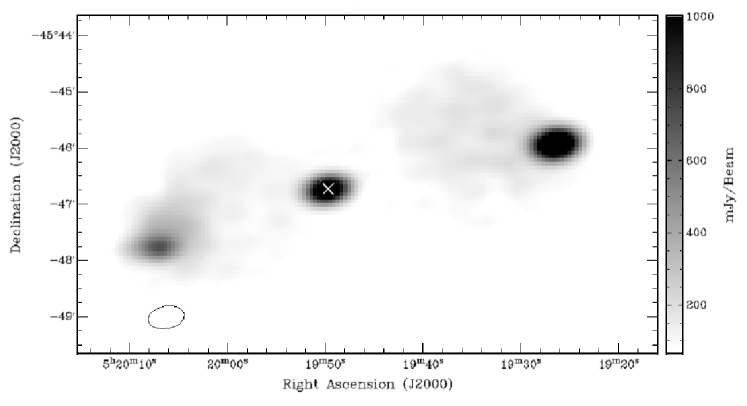
Pictor A, figure 3: A classic double radio galaxy with
significant hotspots, identified both as a D type galaxy (Schilizzi, 1975) and as
an N type galaxy with strong X-ray emission by Marshall et al. (1978). It is known to
be hosted by a smooth, elliptical galaxy with a sharp nucleus and
little to no filamentary structure (Danziger, Fosbury, and Penston, 1977). Extensive observations and
analysis have been done of this source. These include studies of its rotation
measure, for instance Berge and Seielstad (1967) and Haves (1975) give and , respectively, where
is the calculated zero-wavelength polarization angle. In addition, there have been high-resolution
observations (Preuss and Fosbury (1983) note a radio nucleus of parsec scale) and central
black hole mass estimations (Lewis and Eracleous (2006) estimate using stellar
velocity dispersion).The western radio lobe contains a bright hotspot that shows highly
polarised (optical polarisation degree 55 percent) optical
synchrotron emission and coincident X-ray signal from which
Roeser and Meisenheimer (1987) conclude pure synchrotron emission from radio to X-ray
wavelengths. A deep optical study of the western hotspot by
Thomson, Crane, and Mackay (1995) confirm this conclusion. The study also notes strong
polarisation of the hotspot with a magnetic field oriented
perpendicularly to the jet axis. A thorough X-ray study of Pictor A
was done by Wilson, Young, and Shopbell (2001), noting significant emission in the core,
bright western hotspot, and along a jet extending from the core to the
hotspot. High quality imaging of Pictor A is available at various
wavelengths (e.g. Tingay et al. (2000); Simkin et al. (1999); Malkan, Gorjian, and Tam (1998); Perley, Roeser, and Meisenheimer (1997)). Redshift
measured by Schmidt (1965).
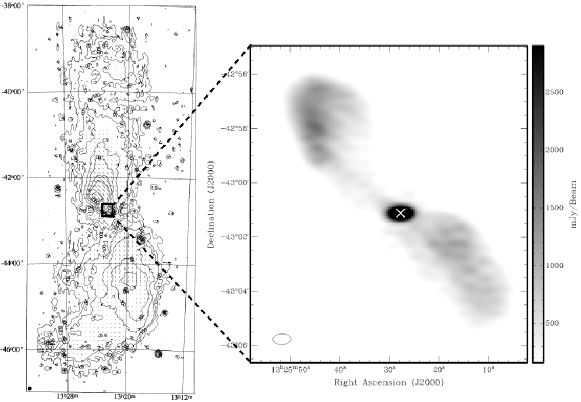
Centaurus A (NGC5128), figure 4: A very
complex and highly extended radio source associated with a spherical
galaxy crossed by large, absorptive dust lanes. Being the nearest and
one of the first radio galaxies identified, the literature is
incredibly extensive and too vast to summarise here. A seminal study of the large scale radio structure of the source from 500 MHz to 5 GHz was made by Cooper, Price, and Cole (1965); the optical
identification was made by Bolton, Stanley, and Slee (1949). The redshift measurement
is available from Graham (1978).
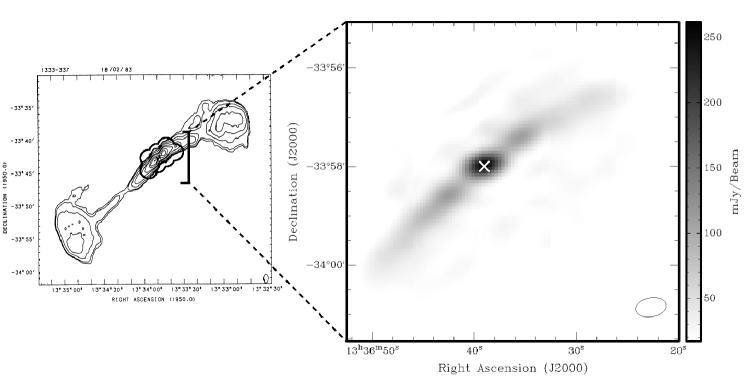
PKS 1333-33 (IC4296), figure 5:
A “triple” radio source called thus for its bright inner jets and diffuse
outer lobes that are in alignment along the jet axes. The major lobes extend
approximately 30 arcminutes and the inner lobes are within 2 arcminutes of the
centroid (Goss et al., 1977; Jones and McAdam, 1992). The radio source is associated with the E1 galaxy
IC 4296, which is a companion to IC 4299 and is centrally located in the
galaxy cluster Abell 3565 (Younis, Meaburn, and Stewart, 1985; Huchra and Geller, 1982). The host galaxy is claimed to
have a dusty disk by Colbert, Mulchaey, and Zabludoff (2001) and Schmitt et al. (2002); however, Sadler and Gerhard (1985)
and Michard (1998) saw no significant dust features. Killeen, Bicknell, and Ekers (1986) and
Killeen, Bicknell, and Carter (1986) provide thorough multi-wavelength studies of the radio
polarisation and rotation measures, and studies of the optical, infrared, and
X-ray form of the source with an extensive analysis presented in Killeen and Bicknell (1988).
The redshift was most recently measured by Smith et al. (2000).
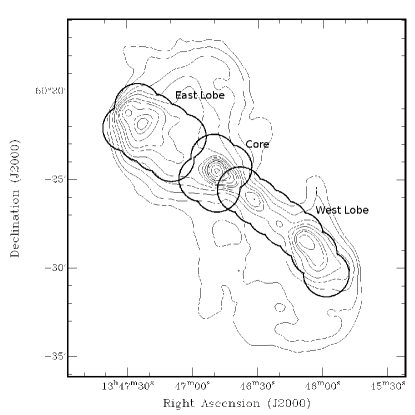
Centaurus B, figure 6: This is a double-lobed source spanning
approximately 15 arcminutes, identified with a large, red E0 galaxy by
Laustsen, Schuster, and West (1977). The galaxy is close to the galactic plane (), and
as noted by Jones, Lloyd, and McAdam (2001), literature flux estimates are often confused by
galactic foregrounds. However, Jones, Lloyd, and McAdam (2001) present a comprehensive
multi-frequency study of the radio galaxy, finding a close power-law fit to
the spectrum with a spectral index of -0.73. Extrapolating their published
measurements, we predict an integrated 20 GHz flux value of Jy. The redshift quoted in the table was measured by West and Tarenghi (1989).
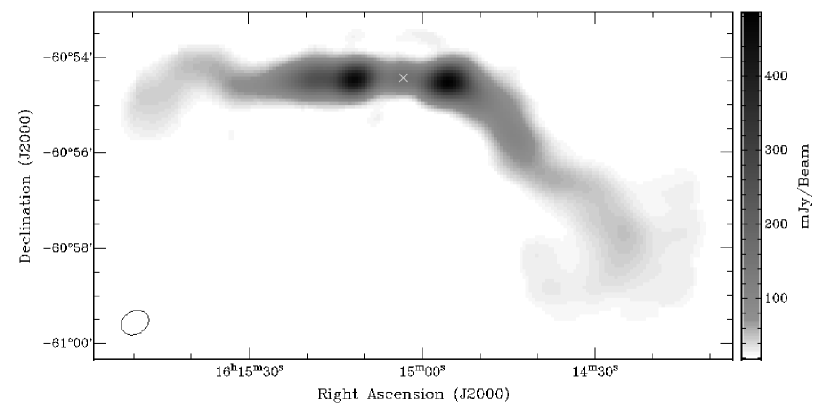
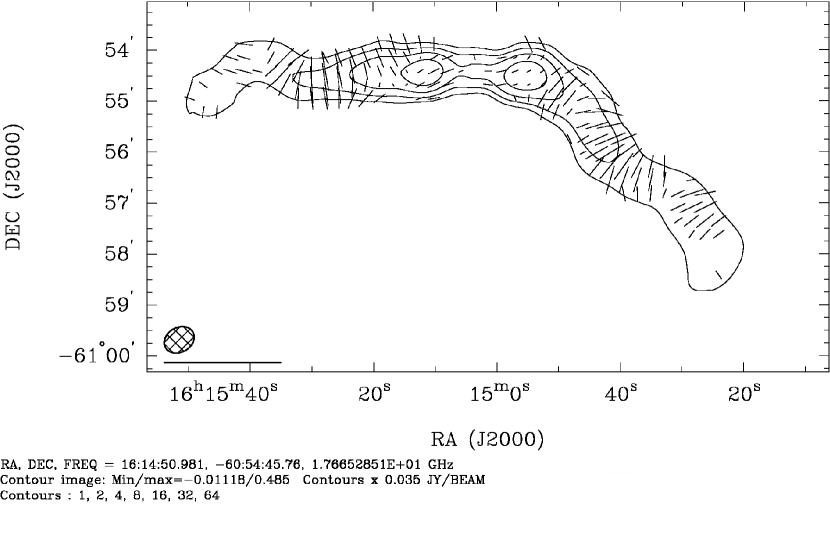
PKS 1610-60, figure 7: The radio source is a wide angle
head-tail galaxy with bright inner lobes and diffuse tails (mapped by
Schilizzi and McAdam (1975); Jones and McAdam (1992); Christiansen et al. (1977); Gregory et al. (1994) at 408, 843, 1415, and 4850 MHz, respectively).
Ekers (1970) identified the source with an E3 galaxy at J2000
16:15:1.7, :55:13.7. The galaxy is thought (but not yet
proved) to be a central member of the local massive cluster Abell 3627
(Robertson and Roach, 1990; Brown and Burns, 1991; Boehringer et al., 1996). Another head-tail galaxy lies within one degree of
PKS 1610-60; Jones and McAdam (1996) mapped the two sources at 1360 MHz, explaining PKS
1610-60’s morphology (sharp kinks in the jets and the wide tail separation)
through probable interaction with an intercluster medium and influence from
subcluster mergers. Most recently, a redshift was determined by
Woudt et al. (2004).
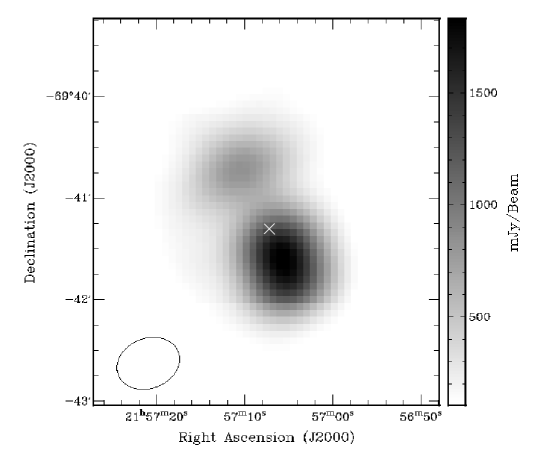
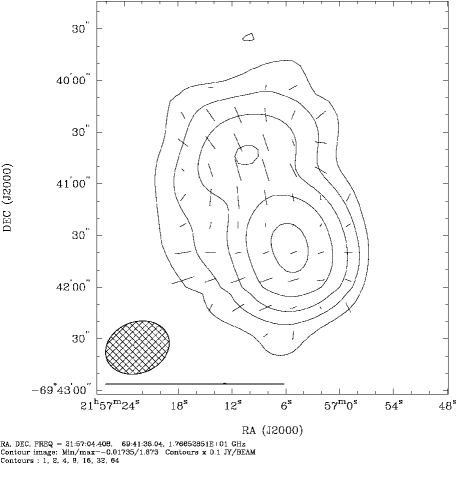
PKS 2153-69, figure 8: Less than 3 arcminutes in extent, the
radio structure of this Seyfert II galaxy consists of a core-lobe morphology.
A presumably unrelated source lies approximately 2.5 arcminutes to the east
(Ekers, 1969; Christiansen et al., 1977). The host galaxy is an early type of class E0
(Schilizzi, 1975; Marenbach and Appenzeller, 1982), and has been shown to have an extra-nuclear ionised gas
cloud with which the jets are interacting (Tadhunter et al., 1988; Tingay et al., 1996). Further deep
radio and X-ray studies have been performed by Fosbury et al. (1998) and
Young et al. (2005). The galaxy was modelled to have a long-period (y) jet precession by Lu and Zhou (2005). Redshift given by Da Costa et al. (1991).
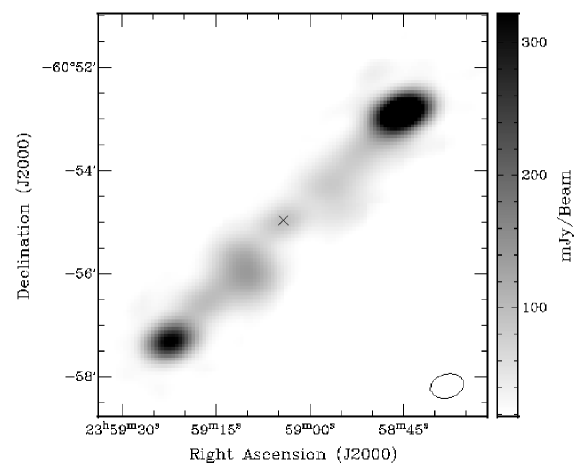
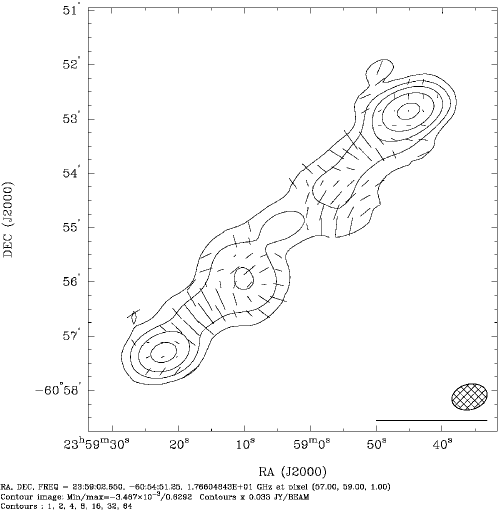
PKS 2356-61, figure 9: A Faranoff-Riley II galaxy marked
by four bright regions of emission that are slightly asymmetric about
a core. In addition, there is a diffuse arm of emission extending
south-west from the western inner lobe (see e.g. low radio frequency
images111An unpublished image of this source is
available from the ATNF at
http://www.narrabri.atnf.csiro.au/public/images/pks2356-61 by
Christiansen et al. (1977); Jones and McAdam (1992); Subrahmanyan, Saripalli, and Hunstead (1996); Burgess and Hunstead (2006)). Identified with an E3 galaxy by
Whiteoak (1972) and Schilizzi (1975). Suspected to be a member of galaxy
cluster SC 2357-61 (Westerlund and Smith, 1966; Teague, Carter, and Gray, 1990). Source was detected as a hard
X-ray emitter by Landi, Malizia, and Bassani (2005). Redshift measured by Loveday et al. (1996).
3 Observations and Data Reduction
All sources were observed with the Australia Telescope Compact Array (ATCA). The compact configuration H75 has five 22m dishes extending on perpendicular north-south and east-west arms with a maximum baseline of approximately 80 metres. The array was well-suited to obtain sufficient (u,v) coverage to sample and image large, diffuse structures at high radio frequencies over a short period of time. Each source was observed simultaneously at 16.7 and 19.4 GHz in two polarisations using linear feeds with 128 MHz bandwidth at each frequency. Observations took place on October 1, 2006.
The dish size and maximum baseline correspond to a field of view of 2.6 arcminutes and a resolution of 43 arcseconds at our mean observing frequency of 18.0 GHz. Because all the sources extended beyond the primary beam size of the telescope, each source was observed using ATCA’s “mosaic mode”; the mosaicing technique is commonly used for wide-field imaging at the ATCA. Overlapping, adjacent telescope pointings that were later jointly deconvolved as one observation were taken in a hexagonal pattern with field centres spaced at approximately 1.5 arcminutes. The field spacings, given by the Nyquist sampling limit for a hexagonal grid,
| (1) |
(where is the angular size of pointing separation and is the primary beam FWHM) ensure a constant noise level across overlapping regions of observation. Additionally, the joint processing of the hexagonally interleaved telescope pointings give the interferometer a sensitivity to large scale emission that is comparable to single-dish (zero-spacing) scales. Each mosaic subfield was observed for 40 seconds, and a secondary calibrator was observed before and after each mosaiced source. Calibrator and mosaic sets were performed four times for each source at a range of hour angles.
All data were calibrated using the Miriad software package (Sault, Teuben, and Wright, 1993).Throughout calibration the two IF bands were treated independently. After opacity corrections and xy feed phase difference solutions were applied, the bandpass was calibrated using a standard bandpass calibrator (PKS B1921-293), and a primary flux density scaling was solved for using a standard ATCA primary flux calibrator, PKS B1934-638. These calibrators were both observed once only, directly prior to the observing run. Each secondary calibrator was used to simultaneously solve for antenna gain matrices, the residual xy-phase difference, and polarisation leakage terms (which result from slight imperfections in feed alignment). Solutions from this process were then applied to each subfield. In the case of Centaurus A, additional self-calibration with a single Gaussian component model was needed for fields containing the bright core of the source.
Due to current limitations and software incompatibility in some of the deconvolution algorithms, our measurement of total polarised flux and the images published in this work show the results of Miriad’s joint deconvolution polarisation maximum entropy method algorithm (pmosmem), while the total intensity measurements are extracted from a new multi-scale clean deconvolution algorithm implemented in the Common Astronomical Software Applications (CASA) software package (Cornwell, 2008; McMullin et al., 2007). In Miriad’s joint deconvolution scheme, all subfields are inverted as one image, and the dirty Stokes Q and U maps are set to the same gridding as the total intensity image. The algorithm performs a maximum entropy method deconvolution simultaneously for all polarisations, using morphological information from bright emission in the total intensity image to solve for the Q and U polarised Stokes images. Images are then restored using a gaussian with the same half-power beam width of the synthesised beam222See http://www.atnf.csiro.au/computing/software/miriad for further details of mosaic observations. While this method does produce a morphologically correct total intensity image, the MEM algorithm is not optimum for computing total intensities, causing integrated intensity measurements to be systematically high by about 1 to 20 percent. For this reason, we used CASA’s multi-scale clean (again joining mosaic subfields) to deconvolve images and gather intensity information. While CASA does compute polarisation values, a known error in the data interface for ATCA polarisation information currently renders their output erroneous.
Polarisation images were created by combining aligned Q and U images pixel by pixel, calculating total polarised intensity, , using . A noise term, was estimated from the RMS of a region of the Stokes Q image that did not contain source emission. Polarised signal below 3 was considered undetected and was masked from the polarised intensity map. The masked polarised maps were then corrected for a debiasing factor333The debiasing term is necessary to correct the Ricean bias that occurs from the calculation of P from Q and U terms; there are multiple methods of correction as detailed in Leahy and Fernini (1989), using a first order correction that again uses : .
Position angle maps are also calculated on a per pixel basis, with , where is the observed angle of polarisation. Vector maps of fractional polarised intensity were formed by dividing the masked total polarisation maps by the total intensity maps; in this way, the maps will only show fractional polarisation above the detection threshold. Polarisation vectors were then calculated using lengths determined by fractional polarisation levels, and position angles from PA maps. Note that the orientation of a polarisation “vector” is ambiguous by 180 degrees, and does not provide a preferred electric or magnetic field direction along the printed rods.
| Source Name | RA (core) | Dec (core) | ||||||
|---|---|---|---|---|---|---|---|---|
| PKS 0131-36 | 01:33:57.9 | -36:29:35.3 | 0.030.01 | 0.44 | 0.02∗ | 4.6 | — | — |
| Pictor A | 05:19:49.7 | -45:46:43.7 | 1.320.04 | 6.320.11 | 0.500.06 | 7.9 | -0.70 | 6.80 |
| Centaurus A | 13:25:27.6 | -43:01:04.9 | 5.980.17 | 28.35 | 3.81∗ | 13.4 | — | 46.2† |
| PKS 1333-33 | 13:36:39.0 | -33:57:57.7 | 0.300.05 | 0.74 | 0.07∗ | 9.8 | — | 1.70 |
| Centaurus B | 13:46:49.1 | -60:24:30.0 | 5.020.06 | 8.89 | 0.080.01 | 0.9 | -0.87 | — |
| PKS 1610-60 | 16:15:05.6 | -60:54:27.1 | 0.140.05 | 2.110.04 | 0.1280.008 | 6.0 | -0.93 | 1.7† |
| PKS 2153-69 | — | — | — | 3.400.21 | 0.050.03 | 1.5 | -0.96 | 3.60 |
| PKS 2356-61 | 23:59:04.9 | -60:55:03.4 | 0.090.03 | 1.640.05 | 0.0320.004 | 1.9 | -0.94 | 1.80 |
4 Images and Discussion
4.1 Results and Image Description
Table 2 gives various observed and calculated parameters from the data. The columns are as follows: (1) Source name; sources with a detected nucleus have a core position fitted with a point source model, which also provides a measurement for the flux density of the nucleus; (2-3) J2000 position of galaxy nucleus, if detected; (4) Core flux density and error in Jy. (5) Total flux density and error in Jy; sources with lower limits for total integrated flux density are those for which we believe we have acquired a minimal measurement for the flux density due to observing a subregion of the source. Total source fluxes were taken from an integration over the MSclean-deconvolved maps, normalised by the synthesised beam. Note that this process has corrected for the primary beam. Errors were quantified by the image RMS; (6) Integrated detected () polarised intensity in Jy (, where the sums represent the integrated and beam-normalized values over the and Stokes pixels in the deconvolved Stokes Q and U images). Because of possible depolarisation effects when imaging the missed source regions, we cannot provide accurate total integrated polarisation measurements for sources which were incompletely observed. Such measurements, indicated with an asterisk, give the integrated value of the observed source subregion; (7) The fractional polarisation of the observed source region in percentage (8) The spectral index between 4.850 and 18.0 GHz, using PMN flux densities for all sources except Pictor A, where the 5 GHz measurement of Kuehr et al. (1981) was used and Centaurus B, for which the 5 GHz measurement of Wright and Otrupcek (1990) was used ; (9) WMAP flux density at 23 GHz (Bennett et al., 2003); flux densities marked with † are as given in the NEWPS catalogue (Lopez et al., 2007).
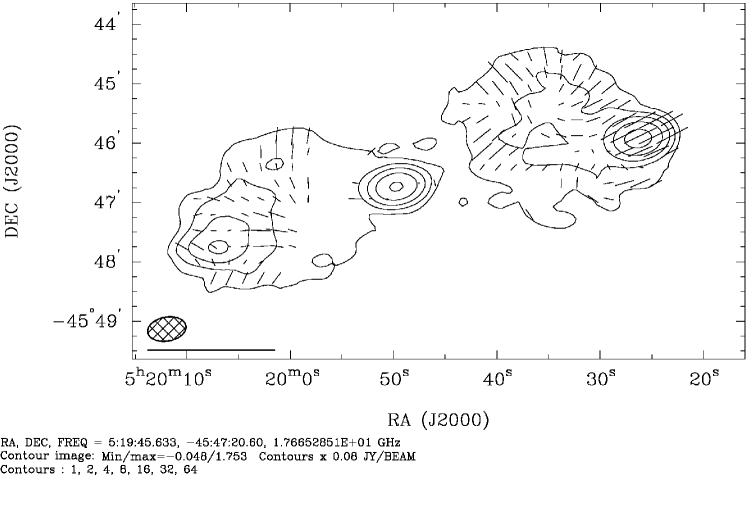
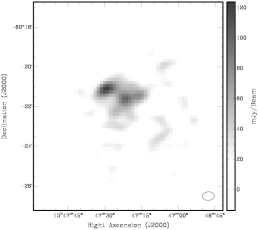
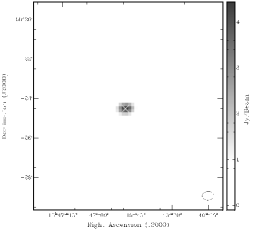
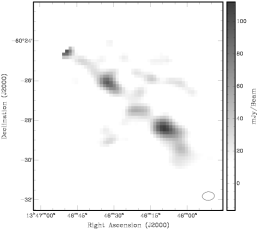
The total intensity and fractional polarisation vector maps whose production are described in the previous section are presented in Figures 2-9. Greyscale images show the total intensity of emission with an “X” indicating the position of the suspected host galaxy for each source based on previous identification (as noted in section 2) with an associated optical galaxy. Sources for which we did not image the full extent of the low-frequency radio structure are accompanied by a radio map from previous low-frequency observations to give a visual reference of the observed subregion. Greyscale images have a linear colour gradient.
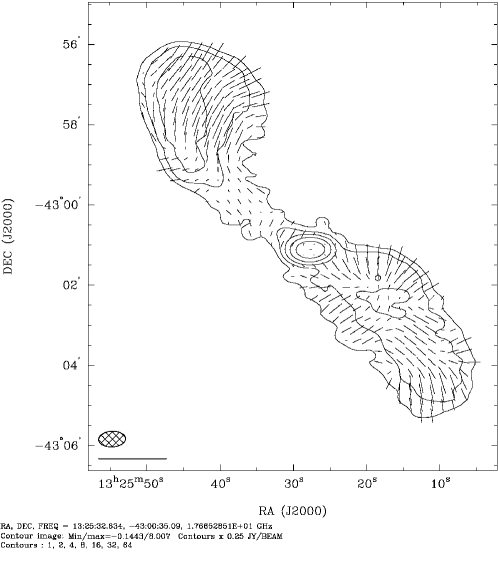
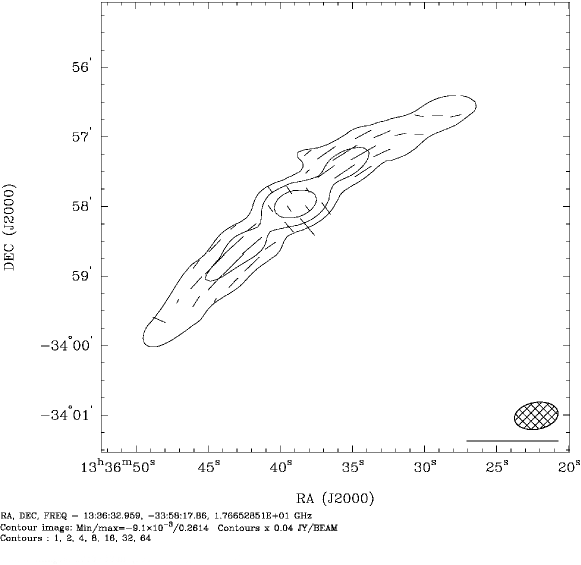
The polarisation images indicate the observed degree and angle of polarisation E-field vectors, with contour levels as indicated below the image. The synthesised beam and a vector showing 100 percent polarisation are indicated in the lower corner of the image.
4.2 General Properties at 20 GHz
There are several striking and perhaps expected similarities between all the sources. Six of the objects (apart from PKS 2153-69) have clearly detected emission from their nuclei, which in some cases were not easily visible in lower-frequency images; all cores have either undetected or very low values of polarisation (an upper limit on the polarisation of the cores can be calculated by taking from Table 2). The undetected polarisation of the cores could be the result of several different effects. The low values of polarisation can be explained by a complex scattering medium surrounding the inner regions of jet formation, or by a dense plasma. Furthering this supposition are the high () rotation measures noted in the inner regions of some AGN. However, studies of galactic nuclei have been yet unable to characterise the spectral properties for emission from active galactic nuclei; the complex spectra are unable to be fit by pure synchrotron self absorption or free-free spectra. An equally likely case is the beam depolarisation of close, compact regions of structure that we have not resolved due to our lower angular resolution. With milliarcsecond resolution, the pilot VLBA Imaging Polarimetry Survey (VIPS, Taylor et al. (2005)) has demonstrated that a sample of 24 active galactic nuclei average below 3 percent polarisation at 15 GHz, however the full VIPS sample will provide a more numerically significant assessment for high resolution polarisation.
In several of the sources (esp. in the lobes of Pictor A, Centaurus A, and the inner hotspots of PKS 1610-60), a notable edge-brightening effect in fractional polarisation is visible. While this is a feature common to many extended extragalactic sources, it appears in only a few of the sources here. The interpretation given by Perley, Roeser, and Meisenheimer (1997) for this effect and of the perpendicularity of polarisation alignment to isocontours of total flux density in the western hotspot in Pictor A calls upon the change in field geometry across the lobe. This interpretation can be supported by the absence of these effects in the geometry and strength of observed polarisation in the linear jet regions in several of the sources here (for instance, the narrow regions of PKS 1610-60 at 16:15:27 and 16:14:35-50, and of PKS 2356-61 at 23:59:17 and 23:58:53). In these cases, if there is insignificant or no rotation of polarised signal, the magnetic field along the jets appears to be aligned with the jet axis, and across the entire region there is no apparent change in geometry, nor any apparent limb brightening in polarisation.
4.3 Individual properties at 20 GHz
The inner jets of PKS 1333-33 are unique for this sample in their alignment; the perpendicular change in magnetic field orientation witnessed in transition from the core to the jets agrees with that observed by Killeen, Bicknell, and Ekers (1986). The reason for this transition is unclear, though could be explained through relativistic shock interactions with a medium surrounding the nucleus. Transverse orientations of magnetic fields are often observed in BL Lacertae objects, for instance in the VLBI observations of Gabuzda et al. (2000).
Centaurus B in addition shows a striking alignment fidelity in the outer regions of the source, with magnetic fields running perpendicularly to the jet axis along the brighter areas of the lobes. There is a sharp change in direction and a brightening at the edge of the lobes, and the core is polarised at approximately 90 degrees to the jet emission.
In a qualitative way, we can compare the observed electric field vectors in our images with the lower frequency images of polarised structure published in previous papers that have been corrected for rotation measure. Often images are published of magnetic field orientation, in which case vector images will show vectors perpendicular to the electric field lines. In the case of Pictor A, the 5 GHz images of Perley, Roeser, and Meisenheimer (1997), which have been corrected for a rotation measure of 45 (which corresponds to a rotation at 18 GHz of 0.7 degrees) are in good alignment with our uncorrected images, where polarisation has been detected by both observations across all regions of the source. The detailed 20cm images published by Killeen, Bicknell, and Ekers (1986) of the inner lobes of PKS 1333-33 show rotation-corrected magnetic fields in the lobes that are perpendicular to the jet axis. This is again in agreement with the results of our polarimetry, which show electric field vectors running directly parallel to the jet axis. To quantify the relative changes in spectral index and polarisation for different source components in each source, a more rigourous wide field multifrequency observing campaign will be necessary.

4.4 Prospects for CMB mission calibration
Beam depolarisation imposes a restriction on sources as suitable CMB mission calibrator candidates. The requirements for a good flux density and polarisation calibrator for the lower end of Planck’s observing frequencies (the lowest band centre on the LFI is 30 GHz) include integrated emission 1 Jy across the observation bands, polarised intensity at levels 200 mJy, and unresolved emission within the telescope beam. The LFI beam resolutions range from 33’ at 30 GHz to 14’ at 70 GHz (The Planck Consortium, 2005). The flight path and pointing path of the Planck Satellite are such that the north and south ecliptic poles will be observed often, such that a source in the region around the south ecliptic pole would be in an ideal position. A limitation on source size coupled with the depolarisation that will certainly occur within the large Planck beams means that the brightly polarised northern inner lobe of Centaurus A, for example, cannot be easily isolated and used for calibration.
The best candidate to arise from this data set is Pictor A, which fits the Planck requirements in several ways. In total, the source extends approximately 10 arcminutes; the source yields Jy of integrated polarised intensity, which is dominated by the brightly polarised western hotspot. Because the emission from the hotspot is highly diffuse and many light years in linear size, total and polarised emission from this region cannot change rapidly with time, making the source particularly useful for the long observing term of the Planck mission and more useful than highly polarised sources which are more compact, variable sources. Conveniently, Pictor A is located within 20 degrees of the south ecliptic pole. The usability of Pictor A as a high-frequency calibrator is limited by its angular size, which may be marginally resolved at the highest frequency, and its spectral index, which is in decline at GHz; both of these could limit the use of Pictor A as a flux density calibrator at the upper ends of the LFI bands. The integrated spectrum of Pictor A is plotted in figure 1. Overplotted is the log-linear spectral fit of Perley, Roeser, and Meisenheimer (1997), which was fit to data below 5GHz; the higher frequency WMAP data and the data from our observations generally follow this log-linear trend, implying that this spectral index will continue into the relevant Planck bands. Currently, Pictor A stands as the best candidate from all known extragalactic sources.
5 Summary
We have used interferometric wide-field imaging techniques to image seven of the brightest and most extended sources in the 20 GHz southern sky region , with the goal of enhancing the statistical total intensity and polarisation samples of Massardi et al. (2008) and Burke et al. (in prep). The data analysis included flux density and polarisation measurements and maps for each of the seven sources. The images have revealed clearly detected 20 GHz emission from all galactic nuclei except that of PKS 2153-69. In all cases, the fractional polarisation of the galactic core was not detected or less than 1 percent (in the case of Centaurus A and PKS 1333-33). While edge-brightening and a perpendicularity of electric field polarisation vectors to brightness isocontours was observed in some sources, the lack of such features in compact jet regions supported the hypothesis that the features may be due to reorientation of field geometries across broad lobe and hotspot components. All sources for which we imaged the entire source had declining spectra across 5 to 18 GHz at an average spectral index of -0.88.
PKS 1333-33 was one of the three sources exhibiting detected polarisation in its core, and it showed a perpendicular field geometry to the close jets spanning the core. The jets exhibited a transverse magnetic field configuration to the jet axis, a feature usually observed in BL Lacertae objects. Centaurus B exhibited a similar change in alignment between its core and outer regions with very little variation in angle along the peaks of the eastern and western hotspot regions, however the smaller-scale jets did not have detectable polarisation.
We have put forward Pictor A as an excellent extragalactic calibrator candidate for the ESO Planck Satellite mission that aims to measure the polarised signature of the CMB. Pictor A’s integrated polarised intensity at 0.500.06 Jy, its total intensity of 6.320.11 Jy, its position in the sky and its angular size contribute to its suitability as a candidate.
6 Acknowledgements
R. D. Ekers is the recipient of an Australian Research Council Federation Fellowship, which also provided financial support for S. Burke. M. Massardi wishes to recognize the financial support from ASI and MUR. TM acknowledges the support of an ARC Australian Postdoctoral Fellowship (DP0665973).
References
- Baade and Minkowski (1954) Baade W., Minkowski R., ApJ, 1954, 119, 215
- Bekenstein (1973) Bekenstein J. D., ApJ, 1973, 183, 657
- Bennett et al. (2003) Bennet C. L., Hill R. S., Hinshaw G., Nolta M. R., Odegard N., Page L., Spergel D. N., Weiland J. L., Wright E. L., Halpern M., Jarosik N., Kogut A., Limon M., Meyer S. S., Tucker G. S., Wollack E., ApJS, 2003, 148, 97
- Berge and Seielstad (1967) Berge G. L. and Seielstad G. A., ApJ, 1967, 148, 367
- Bersanelli and Mandolesi (2000) Bersanelli M. and Mandolesi N., Astroph. Lett. and Comm., 2000, 37 171
- Boehringer et al. (1996) Boehringer H., Neumann D. M., Schindler S., Kraan-Korteweg R. C., ApJ, 1996, 467, 168
- Bolton, Stanley, and Slee (1949) Bolton J. G., Stanley G. J., and Slee O. B., Nature, 1949, 164, 101
- Bolton, Gardener, and Mackey (1964) Bolton J. G., Gardner F. F., Mackey M. B., Aust. J. Phys., 1964, 17, 340
- Brown and Burns (1991) Brown D. L., Burns J. O., AJ, 1991, 102, 1917
- Burgess and Hunstead (2006) Burgess A. M., Hunstead R. W., AJ, 2006, 131, 114
- Caon, Capaccioli, and D’Onofrio (1994) Caon N., Capaccioli M., and D’Onofrio M., AA Supplement, 1994, 106, 199
- Christiansen et al. (1977) Christiansen W. N., Frater R. H., Watkinson A., O’Sullivan J. D., Lockhart I. A., Goss W. M., MNRAS, 1977, 181, 183
- Colbert, Mulchaey, and Zabludoff (2001) Colbert J. W., Mulchaey J. S., Zabludoff A. I., AJ, 2001, 121, 808
- Condon, Griffith, and Wright (1993) Condon J. J., Griffith M. R., Wright A. E., ApJ, 2003, 106, 1095
- Cooper, Price, and Cole (1965) Cooper B. F. C., Price R. M., Cole D. J., AuJPh, 1965, 18, 589
- Cornwell (2008) Cornwell T., 2008, submitted to “IEEE Special Issue on Signal Processing”, arXiv:0806.2228
- Da Costa et al. (1991) Da Costa L. N., Pellegrini P. S., Davis M., Meiksin A., Sargent W. L. W., Tonry J. L., ApJS, 1991, 75, 935
- Danziger, Fosbury, and Penston (1977) Danziger I. J., Fosbury R. A. E., Penston M. V., MNRAS short communication, 1977, 179p, 41
- Ekers (1969) Ekers R. D., Aust. J. Phys. Supplement, 1969, 6
- Ekers (1970) Ekers R. D., Aust. J. Phys., 1970, 23, 217
- Ekers et al. (1983) Ekers R. D., Goss W. M., Wellington K. J., Bosma A., Smith R. M., Schweizer F., AA, 1983, 127, 361
- Ekers et al. (1978) Ekers R. D., Goss W. M., Kotanyi C. G., Skellern D. J., AA, 1978, 69, L21
- Emonts et al. (2008) Emonts B. H. C., Morganti R., Oosterloo T. A., Hold J., Tadhunter C. N., van der Hulst J. M., Ojha R., Sadler E. M., MNRAS, 2008, 387, 197
- Ferguson (1989) Ferguson H. C., AJ, 1989, 98, 367
- Fosbury et al. (1998) Fosbury R. A. E., Morganti R., Wilson W., Ekers R. D., di Serego Alighieri S., Tadhunter C. N., MNRAS, 1998, 296, 701
- Gabuzda et al. (2000) Gabuzda D. C., Pushkarev A. B., Cawthorne T. V., MNRAS, 2000, 319, 1109
- Gardner and Whiteoak (1966) Gardner F. F., Whiteoak J. B., Ann. Rev. in Astronomy and Astrophysics, 1966, 4, 245
- Geldzahler and Fomalont (1984) Geldzahler B. J., Fomalont E. B., AJ, 1984, 89, 1650
- Glass (1979) Glass I. S., MNRAS, 1979, 186, 29
- Goodlet and Kaiser (2005) Goodlet, J. A. and Kaiser, C. R., MNRAS, 2005, 359, 1456
- Goss et al. (1977) Goss W. M., Wellington K. J., Christiansen W. N., Watkinson A., Frater R. H., Little A. G., Lockhart I. A., MNRAS, 1977, 178, 525
- Graham (1978) J. A. Graham, PASP, 1978, 90, 237
- Gregory et al. (1994) Gregory P. C., Vavasour J. D., Scott W. K., Condon J. J., ApJS, 1994, 90, 173
- Haves (1975) Haves P., MNRAS, 1975, 173, 553
- Herrmann et al. (2007) Herrmann F., Hinder I., Shoemaker D., Laguna P., Matzner R. A., ApJ, 2007, 661, 430
- Hu, Hedman, and Zaldarriaga (2003) Hu W., Hedman M.M., Zaldarriaga M., Phys. Rev. D, 2003, 67, 4, id. 043004
- Huchra and Geller (1982) Huchra J. P., Geller M. J., ApJ, 1982, 257, 423
- Jones, Lloyd, and McAdam (2001) Jones P. A., Lloyd B. D., McAdam W. B., MNRAS, 2001, 325, 817
- Jones and McAdam (1992) Jones P. A., McAdam W. B., ApJS, 1992, 80, 137
- Jones and McAdam (1996) Jones P. A., McAdam W. B., MNRAS, 1996, 282, 137
- Killeen, Bicknell, and Ekers (1986) Killeen N. E. B., Bicknell G. V., Ekers R. D., ApJ, 1986, 302, 306
- Killeen, Bicknell, and Carter (1986) Killeen N. E. B., Bicknell G. V., Carter D., ApJ, 1986, 309, 45
- Killeen and Bicknell (1988) Killeen N. E. B., Bicknell G. V., ApJ, 1988, 324, 198
- Kuehr et al. (1981) Kuehr H., Witzel A., Pauliny-Toth I. I. K., Nauber U., AA Supplement, 1981, 45, 367
- Landi, Malizia, and Bassani (2005) Landi R., Malizia A., Bassani L., 2005, AA Letters, 441 69L
- Laustsen, Schuster, and West (1977) Laustsen S., Schuster H. E., and West R. M., AA, 1977, 59, L3
- Leahy and Fernini (1989) Leahy P. and Fernini, I., 1989, VLA Scientific Memorandum No. 161
- Lewis and Eracleous (2006) Lewis K. T., Eracleous M., ApJ, 2006, 624, 711
- Loeb (2007) Loeb A., PhRvL, 2007, v99, issue 4, id 041103
- Longhetti et al. (1998) Longhetti M., Rampazzo R., Bressan A., Chiosi C., AA Supplement, 1998, 130, 267
- Lopez et al. (2007) Lopez-Caniego M., Gonzalez-Nuevo J., Herranz D., Massardi M., Sanz J. L., DeZotti G., Toffolatti L., Argueso F., ApJ Supplement, 2007, 170, 108
- Loveday et al. (1996) Loveday J., Peterson B.A., Maddoz S.J., Efstathiou G., ApJS, 1996, 107, 201
- Lu and Zhou (2005) Lu J., Zhou B., ApJ, 2005, 635, L17
- Malkan, Gorjian, and Tam (1998) Malkan M. A., Gorjian V., Tam R., ApJS, 1998, 117, 25
- Marenbach and Appenzeller (1982) Marenbach G., Appenzeller I., AA, 1982, 108, 95
- Marshall et al. (1978) Marshall F. E., Mushotzky R. F., Boldt E. A., Holt S. S., Rothschild R. E., Serlemitsos P. J., Nature, 1978, 275, 624
- Massardi et al. (2008) Massardi M., Ekers R. D., Murphy T., Ricci R., Sadler E. M., Burke S., DeZotti G., Edwards P. G., Hancock P. J., Jackson C. A., Kesteven M. J., Mahony E., Phillips C. J., Staveley-Smith L., Subrahmanyan R., Walker M. A., Wilson W. E., MNRAS, 2008, 384, 775
- Matthews, Morgan, and Schmidt (1964) Matthews T. A., Morgan W. W., Schmidt M., ApJ, 1964, 140, 35
- Mauch et al. (2003) Mauch T., Murphy T., Buttery H.J., Curran J., Hunstead R.W., Piestrzynski B., Robertson J.G., Sadler E.M., MNRAS, 2003, 342, 1117
- McMullin et al. (2007) McMullin J. P., Waters B., Schiebel D., Young W., Golap K., Astronomical Data Analysis Software and Systems XIV ASP Conference Series, 2007, Vol. 76, Ed. R. Shaw, F. Hill, D.J. Bell, Astronomical Society of the Pacific, p.127
- Michard (1998) Michard R., AA, 1998, 334, 453
- Mills (1954) Mills B. Y., Observatory, 1954, 74, 248
- Perley, Roeser, and Meisenheimer (1997) Perley R. A., Roeser H. J., Meisenheimer K., AA, 1997, 328, 12
- The Planck Consortium (2005) The Planck Scientific Programme, European Space Agency, available from http://www.rssd.esa.int/Planck
- Preuss and Fosbury (1983) Preuss E. and Fosbury R. A. E., MNRAS, 1983, 204, 783
- Ricci et al. (2004) Ricci R., Sadler E. M., Ekers R. D., Stavley-Smith L., Wilson W. E., Kesteven M. J., Subrahmanyan R., Walker M. A., Jackson C. A., DeZotti G., MNRAS, 2004, 354, 305
- Robertson and Roach (1990) Robertson J. G., Roach G. J., MNRAS, 1990, 247, 387
- Roeser and Meisenheimer (1987) Roeser H. and Meisenheimer K., ApJ, 1987, 314, 70
- Sadler and Gerhard (1985) Sadler E. M., Gerhard O. E., MNRAS, 1985, 214, 177
- Sadler et al. (2006) Sadler E. M., Ricci R., Ekers R. D., Ekers J. A., Hancock P. J., Jackson C. A., Kesteven M. J., Murphy T., Phillips C., Reinfrank R. F., Staveley-Smith L., Subrahmanyan R., Walker M. A., Wilson W. E., de Zotti G., MNRAS, 2006, 371, 898
- Sault, Teuben, and Wright (1993) Sault R. J., Teuben P .J., and Wright M. H. C, 1995, ASPC, 77, 433
- Schilizzi (1975) Schilizzi R. T., Mem. R. astr. Society, 1975, 79, 75
- Schilizzi and McAdam (1975) Schilizzi R. T., McAdam W. B., MmRAS, 1975, 79, 1
- Schmidt (1965) Schmidt M., ApJ, 1965, 141, 1
- Schmitt et al. (2002) Schmitt H. R., Pringle J. E., Clarke C. J., Kinney A. L., ApJ, 2002, 575, 150
- Simkin et al. (1999) Simkin S. M., Sadler E. M., Sault R., Tingay S. J., Callcut J., ApJS, 1999, 123, 447
- Smith et al. (2000) Smith R. J., Lucey J. R., Hudson M. J., Schlegel D. J., Davies R. L., MNRAS, 2000, 313, 469
- Subrahmanyan, Saripalli, and Hunstead (1996) Subrahmanyan R., Saripalli L., Hunstead R. W., MNRAS 1996, 279, 257
- Tadhunter et al. (1988) Tadhunter C. N., Fosbury R. A. E., di Serego Alighieri S., Bland J., Danziger I. J., Goss W. M., McAdam W. B., Snijders M. A. J., MNRAS, 1988, 235, 403
- Taylor et al. (2005) Taylor G. B., Fassnacht C. D., Sjouwerman L. O., Myers S. T., Ulvestad J. S., Walker R. C., Fomalont E. B., Pearson T. J., Readhead A. C. S., Gehrels N., Michelson P. F., ApJ Supplement, 2005, 159, 27
- Teague, Carter, and Gray (1990) Teague P. F., CarterD. , GrayP. M. , ApJS, 1990, 72, 715
- Thomson, Crane, and Mackay (1995) Thomson R. C., Crane P., Mackay C. D., ApJ Letters, 1995, 446L, 93
- Tingay et al. (1996) Tingay S. J., Jauncey D. L., Reynolds J. E., Tzioumis A.K., Migenes V., Gough R., Lovell J. E. J., McCulloch P., Costa M. E., Preston R. A., Harbison P., AJ, 1996, 111, 718
- Tingay et al. (2000) Tingay S. J., Jauncey D. L., Reynolds J. E., Tzioumis A. K., McCulloch P. M., Ellingsen S. P., Costa M. E., Lovell J. E. J., Preston R. A., Simkin S. M., AJ, 2000, 119, 1695
- West and Tarenghi (1989) West R. M., Tarenghi M., AA, 1989, 223, 61
- Westerlund and Smith (1966) Westerlund B. E., Smith L. F., Aust. J. Phys., 1966, 19, 181
- Whiteoak (1972) Whiteoak J. B., Aust. J. Phys., 1972, 25, 233
- Wills (1975) Wills B. J., Aust. J. Phys. and Astrophysics Supplement, 1975, 38, 1
- Wilson, Young, and Shopbell (2001) Wilson A. S., Young A. J., Shopbell P. L., ApJ, 2001, 547, 740
- Woudt et al. (2004) Woudt P. A., Kraan-Korteweg R. C., Cayatte V., Balkowski C., Felenbok P., AA, 2004, 415, 9
- Wright and Otrupcek (1990) Wright A., Otrupcek R., PKS Catalog, 1990
- Wright et al. (1994) Wright A. E., Griffith M. R., Burke B. F., Ekers R. D., ApJS, 1994, 91, 111
- Wright et al. (1996) Wright A. E., Griffith M. R., Hunt A. J., Troup E., Burke B. F., Ekers R. D., ApJS, 1996, 103, 145
- Young et al. (2005) Young A. J., Wilson A. S., Tingay S. J., Heinz S., ApJ, 2005, 622, 830
- Younis, Meaburn, and Stewart (1985) Younis S., Meaburn J., Stewart P., AA, 1985, 147, 178