A new analysis of the short-duration, hard-spectrum GRB 051103, a possible extragalactic SGR giant flare
Abstract
GRB 051103 is considered to be a candidate soft gamma repeater (SGR) extragalactic giant magnetar flare by virtue of its proximity on the sky to M81/M82, as well as its time history, localization, and energy spectrum. We have derived a refined interplanetary network localization for this burst which reduces the size of the error box by over a factor of two. We examine its time history for evidence of a periodic component, which would be one signature of an SGR giant flare, and conclude that this component is neither detected nor detectable under reasonable assumptions. We analyze the time-resolved energy spectra of this event with improved time- and energy resolution, and conclude that although the spectrum is very hard, its temporal evolution at late times cannot be determined, which further complicates the giant flare association. We also present new optical observations reaching limiting magnitudes of , about 4 magnitudes deeper than previously reported. In tandem with serendipitous observations of M81 taken immediately before and one month after the burst, these place strong constraints on any rapidly variable sources in the region of the refined error ellipse proximate to M81. We do not find any convincing afterglow candidates from either background galaxies or sources in M81, although within the refined error region we do locate two UV bright star forming regions which may host SGRs. A supernova remnant (SNR) within the error ellipse could provide further support for an SGR giant flare association, but we were unable to identify any SNR within the error ellipse. These data still do not allow strong constraints on the nature of the GRB 051103 progenitor, and suggest that candidate extragalactic SGR giant flares will be difficult, although not impossible, to confirm.
keywords:
gamma-rays: bursts – stars: neutron.1 Introduction
Giant flares are the most spectacular manifestations of soft gamma repeaters (SGRs). Their time histories are characterized by a very rapid ( 1 ms) rise to an intense peak lasting several hundred milliseconds, followed by a weaker, oscillatory phase which exhibits the period of the neutron star. The spectrum of the peak is very hard and extends to MeV energies. The most energetic giant flare to date is that of 2004 December 27 from SGR1806-20, with an isotropic energy of well over 1046 erg. (Hurley et al. 2005, Palmer et al. 2005, Mereghetti et al. 2005, Terasawa et al. 2005, Frederiks et al. 2007b). The observation of this event raised the question once more of the existence of extragalactic giant magnetar flares, and their relation to the short cosmic gamma-ray bursts (GRBs). Viewed from a large distance, only the initial peak of a giant flare would be detectable, and it would resemble a several hundred millisecond long, hard spectrum GRB. The energetics of giant flares make it a virtual certainty that such events can be detected in distant galaxies, but recognizing them and demonstrating their origin beyond a reasonable doubt remain difficult tasks. Predictions of the rates of extragalactic giant flares, and the percentage of short cosmic bursts which might actually be giant flares, vary widely (from a few to 15% - Lazzati et al. 2005, Nakar et al. 2006, Popov and Stern 2006, Tanvir et al. 2005), in part because of their unknown number-intensity relation (no SGR has yet been observed to emit more than one giant flare, and their distances are uncertain in most cases). However, they generally agree that the rate is small enough that the majority of short bursts are indeed not due to SGR giant flares. On the other hand, the rate is not expected to be zero, so it is important to examine all possible cases exhaustively. In this paper, we revisit GRB 051103, a short burst whose location, time history, and energy spectrum are consistent with an origin as a giant flare in M81. We make use of the full interplanetary network (IPN) data set to obtain a refined localization (an error ellipse). We utilize the capability of the RHESSI spacecraft to obtain time-resolved energy spectra with good energy resolution, at a time resolution which is limited only by counting statistics, and we take advantage of the fact that three instruments recorded energy spectra with good statistics to obtain joint fits. Our analysis follows that of Frederiks et al. (2007a), which was based on the Konus-Wind data.
We also present new, much deeper optical data than previously reported for the section of the refined error ellipse closest to M81, taken 3 days after GRB 051103 (and approximately 16 hours after the Golenetskii et al., 2005, GCN notice). We use these data to search for possible optical counterparts of this short burst (SGRB), and discuss the implications of its non-detection for its progenitor and putative association with M81. Throughout this paper, we utilize the distance modulus of M81 determined by HST observations of Cepheids, 27.8 (3.6 Mpc, Freedman et al., 1994).
2 IPN observations and localization
GRB 051103 occurred at 09:25:42 UT at Earth, and was observed by HETE-FREGATE (Atteia et al. 2003), RHESSI (The Ramaty High Energy Solar Spectroscopic Imager - Smith et al. 2002), Suzaku-WAM (Yamaoka et al. 2009), and Swift-BAT (Gehrels et al. 2004) in low-Earth orbit; the burst was outside the coded fields of view of Swift-BAT and the HETE-II imaging instruments, and was therefore not localized by them. It was also observed by INTEGRAL SPI-ACS (Rau et al. 2005) at 0.5 light-seconds from Earth, Konus-Wind (Aptekar et al. 1995) at 4.5 light-seconds from Earth, and by Mars Odyssey (HEND and GRS experiments, Hurley et al. 2006) at 232 light-seconds from Earth. A preliminary IPN error box was announced in a GCN Circular, where it was pointed out that this event had the largest peak flux ever observed by Konus-Wind for a short burst (Golenetskii et al. 2005). Optical follow-up observations were reported by Lipunov et al. (2005a,b), Klose et al. (2005), and Ofek et al. (2005, 2006), and a radio observation was reported by Cameron and Frail (2005). All yielded negative results. A MILAGRO GeV/TeV observation similarly produced only upper limits (Parkinson et al. 2005).
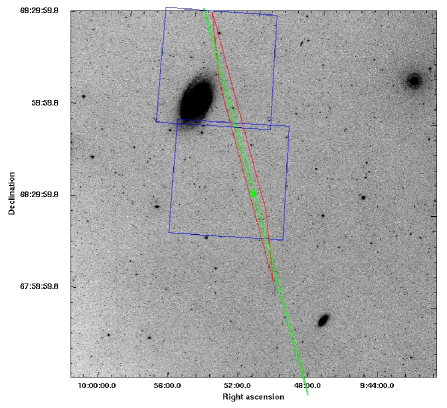
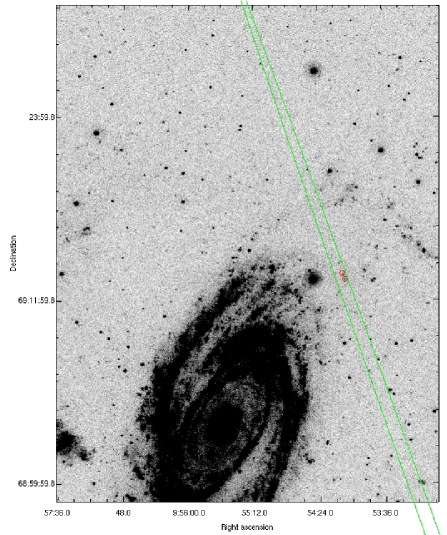
The observations of each statistically independent spacecraft pair can be analyzed to produce an annulus of location, and the annuli can be combined to yield an error ellipse using the method described in Hurley et al. (2000). In this case, we have combined the Konus-HETE, Konus-RHESSI, Konus-INTEGRAL, Konus-Swift, and Konus-Odyssey annuli. Under these conditions (several relatively short baselines and one relatively long one), the error ellipse has a long major axis, corresponding to the annuli derived from the closer spacecraft pairs, and a short minor axis, corresponding to the annulus from the distant spacecraft pair. We obtain a 3 error ellipse centered at =147.933, =+68.589, with major and minor axes 137′and 0.96′respectively, and area 104 square arcminutes. The chi-square for the error ellipse center is 0.9 for 3 degrees of freedom (5 annuli minus 2 fitted coordinates). The area of the initial error box was 240 square arcminutes111A typographical error in GCN 4197 incorrectly gave the area as 120 square arcminutes. The initial error box and the final error ellipse are shown in figure 1.
3 Time history
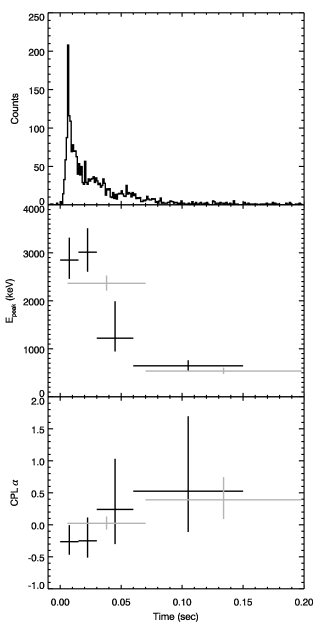
The RHESSI time history of GRB 051103 is shown in the top panel of figure 2. A distinctive signature of all three previously observed giant SGR flares within our Galaxy and the LMC to date is the periodic extended component following the initial short-duration peak. Among these three events, the periods of this extended tail have clustered around a narrow range of 5–8 seconds and also have a relatively narrow range of total isotropic energy releases of erg. This signal lasts for many minutes following the bursts but falls off rapidly after a few hundred seconds. While extended emission is frequently detected following cosmological short-hard bursts, such emission is not periodic. Therefore detection of a periodic component of emission would be considered a strong confirmation of an SGR origin.
None of the IPN light curves shows obvious evidence for extended emission (pulsed or otherwise) following the burst. However, it is conceivable that a marginally detected signal could be present within the noise. To search for such a component, we acquired Swift-BAT data for GRB 051103 (binned at 64 ms) and used the Lomb (1976) periodogram to calculate the relative power in the signal following the burst at periods up to about 20 seconds. We created periodograms for all of the four BAT energy channels, which cover the energy range 15 to 350 keV (and for combinations of channel sums) and for various time ranges following the emission (ranging from the first 60 s to the first 300 s.) To assess the significance of any peaks in the power spectrum, we performed a Monte Carlo analysis by repeatedly randomizing the order of the 64 ms time bins for each data set over the range of interest and measuring the rate of occurrence of independent peaks above various power levels. We identified no peaks with greater than 98% significance in any channel or time range.
This non-detection is expected. To assess the general detectability of periodic post-flare emission from extragalactic giant magnetar flares, we also acquired the Swift-BAT light curve of the the 2004 December 27th flare from SGR 1806-20. We then scaled the signal down by a factor of and added it to the light curve of GRB 051103 (both scrambled and unscrambled). No signal is detected in the periodogram at the known periodicity of 7.56 seconds at the distance of M81/82 ( kpc). The maximum distance for detecting periodicity with our analysis greater than 3 sigma is only about kpc (if a distance of kpc to SGR 1806-20 is assumed, or to 130 kpc if the 8.7 kpc distance of Bibby et al. 2008 is assumed), less than the distance even to M31. This limit may not be exact: both SGR1806-20 and GRB 051103 were detected off-axis by BAT and the comparative satellite sensitivity will depend on the specifics of the off-axis angle. For the giant flare from 1806-20, BAT was pointing 105°away, and slewed to 61°away starting around 38 s after the peak. For 051103, BAT was pointing 122°from the source. However, as the expected signal from a December 27-like event at the distance of M81/M82 would be only 0.01 sigma assuming similar sensitivities for the two events, we consider it extremely unlikely that any possible angle outside the BAT FOV would lead to a detection unless the periodic component were several orders of magnitude stronger than that observed in the three Galactic/LMC events to date.
4 Energy spectrum
A key signature of the spectra of the three SGR giant flares observed to date is a very hard energy spectrum for the initial, several hundred millisecond long burst, and a dramatic spectral evolution to a soft spectrum for the subsequent pulsating component. As these bursts were observed by various instruments, with different temporal resolutions, spectral resolutions, and energy ranges, and all of them were in some degree of saturation at the peak, a precise description of the spectra is impossible. Nevertheless, all of them can be characterized as very hard spectra at the peak, sometimes consistent with a very high temperature blackbody (e.g. Mazets et al. 1979, Fenimore et al. 1981, Hurley et al. 1999, Mazets et al. 1999, Hurley et al. 2005, Frederiks et al. 2007b). Accordingly, we have analyzed the time-resolved energy spectra of GRB 051103. RHESSI, Konus, and Suzaku obtained energy spectra for GRB 051103 over a wide energy range, with good statistics, although with different time resolutions. (Due to the off-axis arrival angles at Swift and HETE-II, the detector response matrices are not well known, and we have not used these data.) Because the finest time resolution can be obtained from the RHESSI data, we have analyzed the RHESSI spectra both separately, to obtain the best time resolution, limited only by counting statistics, and combined with the Konus and Suzaku data, to obtain the best statistics, albeit at the cost of temporal resolution.
RHESSI uses nine unshielded coaxial germanium detectors to observe a broad energy band (30 keV–17 MeV) with excellent energy (1–5 keV) and time resolution (1 binary s) and moderate effective area (150 cm2). The data are recorded event-by-event, which provides great flexibility in choosing analysis intervals.
To determine RHESSI’s spectral response to GRB 051103, we used the Monte Carlo package MGEANT (Sturner et al. 2000). We simulated monoenergetic photons in 192 logarithmic energy bins ranging from 30 keV–30 MeV generated along a 60°azimuthal arc at the 97°off-axis angle of GRB 051103. We fit a polynomial background and extracted the burst data in SolarSoftWare-IDL routine222http://www.lmsal.com/solarsoft/. Because of radiation damage to some of the detectors, we used only data from rear segments 1, 4, 6, 7, and 8. Spectral fitting was conducted with ISIS v1.4.9 (Houck 2000). In general, the full 30 keV–17 MeV energy band was employed, except when sufficient counts could not be accumulated at high energies.
We fit the data with a Band (Band et al. 1993) function:
with and . For and , corresponds to the peak of the spectrum. The normalization has units photons/(cm2 s keV), and is here taken to be 100 keV. For joint fits, the Band function parameters , , and Epeak were tied for both instruments, but the normalizations were allowed to vary independently.
For the RHESSI-only time-resolved fits, we identified time intervals with background-subtracted S/N of 20 in the 60 keV–3 MeV band. This yielded three intervals, to which a fourth tail interval of S/N 12 was added. For most intervals, the cutoff power law model (CPL), equivalent to the Band function below , provided the best fit. The time evolution of the parameters of the best-fit spectral model (a cutoff power-law) is presented in the lower panels of Figure 2. The initial spike of emission has a significantly higher peak energy than the decaying tail; however, the spectral index of the power law appears to harden throughout the burst. The results are reported in table 1.
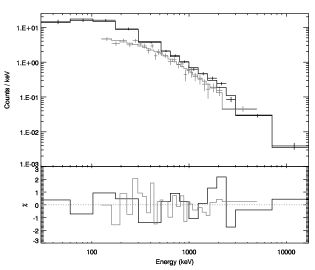
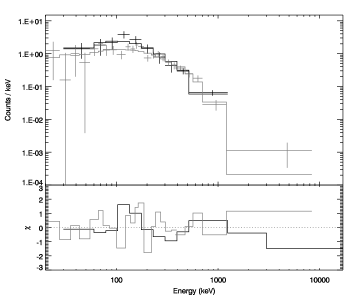
Suzaku-WAM did not trigger on GRB 051103, so the only data available are for a 1-second spectrum containing the entire burst, in the 50 keV – 5 MeV energy range. The RHESSI-WAM joint fit is shown in Figure 3 and the fit results are reported in table 1. The WAM fluence is a factor of 5 lower than the RHESSI fluence; this deficit appears to be a result of data lost due to deadtime during the intense peak of emission.
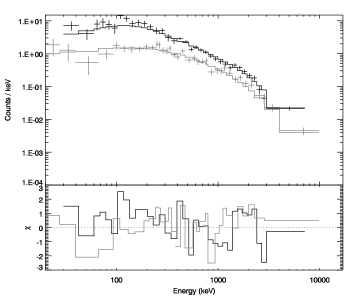
Konus-Wind triggered on GRB 051103 and recorded 64 ms spectra in the 20 keV – 10 MeV range; we conducted joint fits between RHESSI and Konus-Wind for the 64 ms and 128 ms intervals analyzed in Frederiks et al. 2007a. These fits are presented in Figures 3 and 4, and the details are reported in table 1. Good correspondence was obtained in the best-fit parameters between the two instruments, although a normalization offset was necessary.
| Instruments | Interval | RHESSI Fluence | Normalization | /dof | |||
|---|---|---|---|---|---|---|---|
| (sec) | (keV) | (10-5 erg/cm2) | Offset | ||||
| RHESSI + WAM | -0.011 – 0.989 | 2235 | -0.63 | -2.59 | 4.80 | 0.196 | 44.7/37 = 1.21 |
| RHESSI + KW | 0.000 – 0.064 | 2080 | 0.13 | -2.78 | 3.17 | 1.00 | 93.0/65 = 1.43 |
| RHESSI + KW | 0.064 – 0.192 | 536 | 0.39 | — | 0.156 | 1.23 | 30.9/32 = 0.96 |
| RHESSI | -0.006 – 0.009 | 2850 | -0.26 | — | 1.66 | — | 38.5/11 = 3.50 |
| RHESSI | 0.009 – 0.024 | 3010 | -0.25 | — | 1.10 | — | 7.5/11 = 0.68 |
| RHESSI | 0.024 – 0.054 | 1220 | 0.24 | — | 0.66 | — | 3.7/4 = 0.93 |
| RHESSI | 0.054 – 0.144 | 645 | 0.53 | — | 0.145 | — | 17.8/7 = 2.54 |
The spectrum of the 2004 December 27 giant flare from SGR1806-20 was measured by many different instruments, using many different methods (Hurley et al. 2005, Boggs et al. 2007, Palmer et al. 2005, Frederiks et al. 2007b). While they do not agree on the exact shape of the spectrum, none found evidence for the existence of a high energy power law component in the Band model. Our RHESSI-only spectral fits of GRB 051103 are consistent with this, but in two of the joint fits this component is preferred (table 1). A blackbody can be fit to the RHESSI data, but only over the 800 keV - 5 MeV range; kT is approximately 550 keV for this fit, and the chi-square is about 1.5 per degree of freedom.
Table 2 contains a comparison of the energetics of the giant flares observed to date. Because of the uncertainties in the SGR distances, as well as the different energy ranges, time resolutions, and characteristics of the various instruments which observed these events, comparisons between the values given are probably uncertain by at least a factor of 3. The total energy of GRB 051103 at the distance of M81, 7.51046 erg, does not strain the possibilities of the magnetar model. However, PGC 2719634, whose distance is unknown, also remains a possible host (Lipunov et al. 2005b).
| SGR | Energy, erg | Peak Luminosity, erg cm-2 s-1 | Assumed distance, kpc |
|---|---|---|---|
| 0525-66333Mazets et al. 1979 | 55 | ||
| 1900+14444Hurley et al. 1999; Tanaka et al. 2007 | 15 | ||
| 1806-20555Hurley et al. 2005; Terasawa et al. 2005; Frederiks et al. 2007b | 15 | ||
| GRB 070201666Mazets et al. 2008 | 780 | ||
| GRB 051103 | 3600 |
5 Optical Observations and Analysis
Observations were obtained on 6th November 2005 using the Mosaic wide field optical imaging camera at the KPNO 4m telescope. These data reach a limiting magnitude of in the R band, which is considerably deeper than the study completed by Ofek et al. (2006). The observations covered the majority of the original error region, and in particular that part nearest to the galaxy M81. The images were flat-fielded and sky subtracted using standard tasks within Iraf 777Iraf is distributed by the National Optical Astronomy Observatories, which are operated by the Association of Universities for Research in Astronomy, Inc., under cooperative agreement with the National Science Foundation..
For comparison, pipeline-reduced images of the region from CFHTLS were obtained via the Virtual Observatory (Walton et al., 2006). These formed part of the wide synoptic survey in the R band, also to a limiting magnitude of 25 (Ilbert et al., 2006). Coincidentally, the region was imaged on 1st November 2005, 2 days prior to the burst, and re-imaged within 1 month after the burst. This provided an ideal data set for comparison to the KPNO images as the timescale between the first images by CFHT and our images from KPNO is only 6 days, minimising any modulation in long-period variable stars in the disk/halo of M81.
Figure 1 shows the previous error quadrilateral, the refined 3 error ellipse and the fields covered by our KPNO observations, in relation to M81. Our observations were positioned to cover the original error quadrilateral but still cover 62% of the refined 3 ellipse and contain 76% of the total likelihood. It is important to note that our observations cover the region closest to M81, and therefore our search addresses the possible association of GRB 051103 with M81.
Initially, we searched the images for variability of afterglow counterparts, either at the distance of M81 or in the background, by visual inspection and no obvious afterglow candidate was found. The magnitudes of sources within these images were then studied using SExtractor within Gaia. They were all calibrated to the r band magnitudes of stars in the surrounding region as published in the Sloan Digital Sky Survey (SDSS) (Adelman-McCarthy et al., 2008). The r band filter used by CFHT matched the filter used in SDSS and the filter used by KPNO was a Cousins R band filter. Although this is partially taken into account in the calibration to r band magnitudes, there are some sources which have large colour differences, for example very red sources. If a source appeared to differ in magnitude between the CFHT and KPNO images, the colour correction was calculated using a formula developed by Lupton (2005) and it was then determined if the magnitude difference was due to colour effects. If it was not due to colour effects, the source was investigated further. It is important to note that there may be a source within the field which was varying but has not been identified due to this colour correction method. However, this method would only miss objects with a variability of 0.3 magnitude (the average colour correction factor used).
Although the magnitude of some stars differed between the images, these were found to be caused by other factors, for example, being near chip edges or large diffuse galaxies unidentified by SExtractor. One of the stars in the region studied has a varying magnitude on the images studied and further investigation confirmed it is likely a variable star.
We checked extended sources to look for a conventional SGRB afterglow within a moderately distant host galaxy, with a limiting magnitude of . If an extended source appeared to be varying due to a possible point source being superimposed on it, the colour correction was calculated and the object was studied in more depth by eye. This involved using the software to match seeing conditions and measure the size of the object, and then to check if there was an indication of a change in shape which might indicate a superimposed afterglow component.
In addition to the photometry described above we also searched for afterglow candidates with PSF-matched image subtraction, using a modified version of the ISIS code (Alard & Lupton, 1998; Alard, 2000). This method gives us a better chance of finding sources that are blended with other, brighter objects (i.e. bright host galaxies). After cosmic ray cleaning and resampling on a common pixel grid, we subtract the KPNO data with the CFHT data taken before and with the data taken after the burst. We found no credible afterglow candidates.
The analysis of the images found no optical afterglow candidate in the region studied 3 days after GRB 051103. This can place constraints on the progenitor of GRB 051103 by considering the expected results for the potential progenitors.
5.1 Progenitor option 1: a Short GRB (SGRB)
| SGRB | Fluence | R band Magnitude at 3 days |
| erg cm-2 | ||
| 051221A | 11.60.4 (1) | 24.120.28 (2) |
| 051227 | 2.30.3 (3) | 25.490.09 (4) |
| 060121 | 26.7 (5) | 250.25 (6) |
| 060614 | 2174 (7) | 22.740.31 (8) |
| 061006 | 14.31.4 (9) | 23.960.12 (10) |
| 070707 | 0.334 (11) | 26.620.18 (12) |
| 070714B | 7.20.9 (13) | 25.5 (14) |
| 071227 | 2.20.3 (15) | 24.9 (16) |
| 080503 | 20.01 (16) | 25.900.23 (17) |
(1) Cummings et al. (2005) (2) Soderberg et al. (2006) Hullinger et al. (2005) (4) D’Avanzo et al. (2009) (5) an approximate fluence calculated using spectral parameters published by Golenetskii et al. (2006) (6) based on observations by Levan et al. (2006a) (7) Barthelmy et al. (2006) (8) Mangano et al. (2007) (9) Krimm et al. (2006) (10) an upper limit based on observations 2 days after the burst completed by D’Avanzo et al. (2009) (11) an approximate fluence calculated using spectral parameters published by Golenetskii et al. (2007) (12) Piranomonte et al. (2008) (13) Barbier et al. (2007) (14) a lower limit based on observations 4 days after the burst completed by Perley et al. (2009) (15) Sato et al. (2007) (16) a 3 upper limit published by D’Avanzo et al. (2009) (17) Ukwatta et al. (2008) (18) Perley et al. (2009)
The optical afterglows of various SGRBs have been studied and these data can be used to predict the range of afterglow properties of an SGRB of a particular gamma-ray fluence. There is evidence for a reasonable correlation, to first order, between gamma-ray fluence and afterglow flux (Nysewander, Fruchter, & Pe’er, 2008; Gehrels et al., 2008). Using Xspec, we created a model spectrum of GRB 051103, using the RHESSI + KW joint fits in Table 1, and estimated the fluence of GRB 051103 in the energy band 15-150 keV to be approximately erg cm-2.
It is possible to compare GRB 051103 to other SGRBs in the BAT catalogue (Sakamoto et al., 2008) using the approximate fluence, calculated for the energy band 15-150 keV, and the photon indices given in Table 1. GRB 051103 is isolated at the extreme bright, hard end of the SGRBs in the Swift distribution (c.f. Figure 14 from Sakamoto et al., 2008). Similarly, in the study of short bursts by Mazets et al. (2004) over the much wider Konus energy range, of the 109 spectra which could be characterized by an Epeak, none exceeded 2.53 MeV. The peak energy of GRB 051103 is approximately 3 MeV (table 1). Thus if GRB 051103 is an SGRB rather than an SGR giant flare, it is a fairly extreme case.
We compared the fluence of this burst to other SGRBs observed by the Swift Satellite. Table 3 provides the data of SGRB with fluences in the band 15-150keV and late optical observations, obtained from the relevant GCNs, and measured optical afterglows in the R band, approximately 3 days after each burst 111It is important to note the classification of some of these SGRBs are currently being debated (Zhang et al., 2009). For two of the bursts it was necessary to estimate the fluence in the correct energy band using the same method as with GRB 051103. This is not a complete sample of SGRBs, as there are a number with a relatively low gamma-ray fluence that were either not observed optically, were not observed for longer than a few hours, or did not have a detected optical afterglow. We chose this sample so we did not have to rely on the assumption that we can extrapolate the light curve to later epochs and because they are of a similar gamma-ray fluence to GRB 051103. We compared the SGRBs in Table 3 to GRB 051103 and predict the optical afterglow would have an R band magnitude of as it is at the higher end of the fluence distribution. This is within the limiting magnitude of the KPNO and CFHTLS images used, but would have been unobservable in the images obtained by Ofek et al. (2006). As no afterglow was observed, this rules out most typical SGRBs in the region of the error ellipse covered by our imaging. However, there are cases of SGRBs with extremely faint optical afterglows, for example GRB 080503, which had a similar fluence to GRB 051103 and an r band magnitude of 25.900.23 at 3 days (Perley et al., 2009). So the observations cannot rule out an unusually faint SGRB in this region similar to GRB 080503. Additionally, GRB 051103 could be a classical SGRB in the part of the error ellipse not studied in this paper.
5.2 Progenitor option 2: an SGR giant flare in M81
Conversely, GRB 051103 could be an SGR giant flare in M81 with similar energy to the giant flare from SGR 1806-20 (Golenetskii et al., 2005) and a very faint optical afterglow (Eichler, 2002; Levan et al., 2008). Using observations of the giant flare from SGR 1806-20, we can predict the apparent optical magnitude of an SGR in M81. The distance to SGR 1806-20 has proven difficult to determine; the distance modulus adopted by many authors is 15.8 (Corbel et al., 1997), although Bibby et al. (2008) recently obtained a revised distance modulus estimate of 14.70.35mag. Here we continue to use the larger distance modulus as this will provide an approximate upper limit on the absolute magnitude. The giant flare from SGR 1806-20 had an observed radio afterglow and this has been used by Wang et al. (2005) to make predictions of the apparent R band magnitude of the afterglow. Their analysis suggests that the giant flare would have had an apparent magnitude of at 3 days, and hence an absolute magnitude of . Taking this as the absolute magnitude of any afterglow of GRB 051103 if it is an SGR giant flare, and using the distance modulus to M81 of 27.8 (Freedman et al., 1994), we conclude the afterglow would be expected to have an apparent magnitude of . Despite the many uncertainties involved in this calculation, we can have some confidence that such an afterglow would not be detectable with the data available. For future reference, it is important to note that with more accurate positions and rapid follow up observations it may be possible to observe the optical afterglows of extragalactic giant flares. For example, if there were a second potential giant flare in M81 we predict the optical afterglow would have a peak apparent K band magnitude of 20 at 86s after the giant flare and would fall to 26 at 1 hour. This is observable with current and upcoming facilities, for example the European Extremely Large Telescope (E-ELT). However, these predictions are based upon the theoretical models of SGR giant flares being similar to the blast wave model used to describe classical GRBs. Wang et al. (2005) use the blast wave model and radio observations of the giant flare from SGR 1806-20 to extrapolate the optical afterglow. SGRs have been observed during periods of activity using ROTSE-I (Akerlof et al., 2000) and Swift (for example Cummings et al., 2009), and IR observations have been obtained for SGR 1900+14 4.1 days after outburst detecting no variability (Oppenheimer et al., 1998). These have provided upper limits on the optical afterglows from the softer spectrum, shorter, and weaker bursts seen during active phases of SGRs but it is important to note that there have been no reported rapid optical follow up observations of galactic SGR giant flares, which have a significantly higher fluence and are spectrally harder than these bursts. Therefore, we are completely reliant on theoretical predictions and future observations may show discrepancies with these predictions. Indeed, our observations with a limiting magnitude of 24.5, giving an absolute magnitude -3.3 assuming it is at a distance of 3.6 Mpc, constitute one of the deepest absolute magnitude searches for an afterglow from a possible SGR giant flare. This absolute magnitude is only exceeded by the search for an afterglow from GRB 070201, which is a candidate SGR giant flare in M31, corresponding to an absolute magnitude of -7.4 obtained 10.6 hours after the burst (Ofek et al., 2008). However, as we discuss later, it is unlikely that both of these events were SGR giant flares (Chapman, Priddey, & Tanvir, 2009).
From the GALEX UV imaging (Martin et al., 2005), there is evidence that the error ellipse does contain star forming regions in the outer disk of M81. The two brightest UV sources are marked on Figure 6 (Ofek et al., 2006). These young stellar regions in M81 could host an SGR which could emit a giant flare. Similarly, these UV regions could be the locations of massive star clusters, and SGRs 1900+14 and 1806-20 have been associated with massive star clusters (Mirabel & Fuchs, 1999; Vrba et al., 2000). However, if GRB 051103 is an SGR giant flare in M81, we might also expect to find a young (up to years old, Duncan & Thompson (1992)) SNR in the nearby region, although this association is still being debated (Gaensler et al., 2001, 2005). When an SGR is formed, it is theoretically possible that it is given a kick of up to km s-1 or more (Duncan & Thompson, 1992) and therefore could have traveled a distance of 10pc from the SNR. However, this is only equivalent to an angular separation of arcsec at a distance of 3.6Mpc (Freedman et al., 1994). Hence, an accompanying SNR would still be expected to fall within the error ellipse. Of the known SNR in M81 (Matonick & Fesen, 1997), there are none within the error ellipse.
M81 has been studied by the Chandra X-Ray Observatory (Swartz et al., 2003) and three X-ray sources are within the error ellipse. However, they have not been identified in visible or radio observations. Additionally, they have not been identified with known SNR, nearby stars, are not co-incident with HII starforming regions (the expected location of SGRs – Duncan & Thompson (1992)) and are more likely to be X-ray binary systems than unidentified SNR (Swartz et al., 2003). This survey had a limiting luminosity of erg s-1, which means it would detect very young supernovae, as the oldest supernovae with detected X-ray afterglows had a luminosity of erg s-1 and an age of years (Soria & Perna, 2008). Additionally, this survey would detect the X-ray luminous SNR as these have a luminosity of up to erg s-1 but would not detect the X-ray faint SNRs which have a luminosity of erg s-1 (Immler & Kuntz, 2005). SGRs are well known to be quiescent soft X-ray emitters and Mereghetti et al. (2000) have measured the soft X-ray flux of SGR 1806-20 to be approximately erg cm-2 s-1. Frederiks et al. (2007a) determined that the Chandra Observatory would be unable to observe directly the persistent X-ray flux from an SGR like SGR 1806-20 in M81.
An alternative method of searching for SNR is to use H and OIII narrow band observations. The Isaac Newton Telescope (INT) has been used to search for planetary nebulae in M81 by Magrini et al. (2001) and they have found 171 potential candidates, some of which are in the nearby region of the refined error ellipse. Their criteria for differentiating between an SNR and a planetary nebula is that planetary nebulae cannot be spatially resolved and SNR are. A young SNR, as required for an SGR, could be misidentified as a planetary nebula by this criterion, since a one arcsecond region corresponds to a physical size of pc. Young SNRs may well be significantly smaller than this, since an expansion velocity of a few thousand km s-1 over a magnetar lifetime of years leads to sizes of pc. Indeed, many SNRs in M82 appear (based on radio maps) to be fairly compact (Fenech et al., 2008). However, the nearest is still 23 arcsec from the error ellipse, and we showed earlier that an SGR in M81 would only be able to travel 0.6 arcsec from its birthplace. The H luminosity of SNRs in nearby disk galaxies tends to be greater than erg s-1 (de Grijs et al., 2000) and the work by Magrini et al. (2001) had a limiting H flux of less than erg cm-2 s-1 which corresponds to a limiting luminosity of erg s-1. Therefore, we would expect their survey to find a candidate SNR. We used the recently published H and OIII images from the INT Wide Field Camera Imaging Survey (McMahon et al., 2001), with a limiting luminosity of erg s-1 at the distance of M81 as these are the same images as used by Magrini et al. (2001), and compared them with 21cm radio images from THINGS (Walter et al., 2008) and Chandra X-ray source positions (Swartz et al., 2003) to search for previously unidentified SNRs within the error ellipse. There is a possible circular 21cm radio source coincident with a Chandra X-ray source of approximately the right flux for an SNR in M81 (source 15 in Swartz et al., 2003). However, the 21cm radio source is too large for an SNR of the required age and there is no convincing supporting evidence of a source within the other images studied. Using the published known X-ray sources we might have expected to find an SNR if it was very young or bright and we would have expected to find an associated SNR using the H images. We identified no convincing associated SNR candidates within the error ellipse.
Although it has been determined that the error ellipse does cross potential star formation regions as required by the majority of SGR models, it should also be noted that this is not essential for all. An alternative route has been proposed for producing a magnetar by white dwarf (WD) mergers (King, Pringle, & Wickramasinghe, 2001; Levan et al., 2006b). As WD have long lifetimes, WD-WD mergers would be associated with older populations of stars. It is possible that accretion induced collapse (AIC) will drive off a fraction of the envelope, leaving something akin to an SNR behind (e.g. Baron et al., 1987). The mechanisms underlying AIC are poorly understood, and the physical characteristics and detectability of such remnants are not clear. Therefore a SGR produced through this channel could be formed in an old stellar population within the outer disk or halo, and the non-detection of an SNR within the region does not place constraints on this model.
If the progenitor was an SGR giant flare, then there might be significant similarities in the light curve and spectrum of GRB 051103 to the giant flare from SGR 1806-20. Ofek et al. (2006) noted that the light curve of these two events were consistent, i.e. the light curve of GRB 051103 is similar to what would be expected from an extragalactic version of the giant flare from SGR 1806-20. In Table 1, we have shown, for the joint RHESSI + KW fits, that initially and softens to . Although this is unusually hard for a GRB, it is consistent with the photon index of the giant flare from SGR 1806-20, (Palmer et al., 2005). The peak luminosity of GRB 051103, assuming it was from an SGR in M81, is approximately erg s -1. This is a factor of 10 brighter than the peak luminosity of the giant flare from SGR 1806-20, which is erg s-1 assuming it is at a distance of 15kpc (Hurley et al., 2005). With the revised distance estimate from Bibby et al. (2008), the peak luminosity of the giant flare from SGR 1806-20 would be erg s -1, suggesting that a much smaller percentage of SGRBs are SGR giant flares. This value is 30 times fainter than the peak luminosity of GRB 051103 if it was from an SGR giant flare in M81 and in this case GRB 051103 would be the most luminous SGR giant flare observed. In comparison, the peak luminosity of GRB 070201 is erg s -1 assuming it was in M31 (Ofek et al., 2008), which is an order of magnitude fainter than GRB 051103 and comparable to the giant flare from SGR 1806-20. It is important to note however, that there is currently no theoretical upper limit for the energy of a giant flare. Duncan & Thompson (1992) showed that the total energy available is given by where . Therefore, the magnetic dipole (B) of SGR 1806-20 would only need to increase by a factor of 5 to produce a giant flare with an energy that is 30 times greater than the one from SGR 1806-20.
Although the gamma-ray data suggest that GRB 051103 may be an extragalactic SGR giant flare, it is important to note that SGR giant flares are rare events. Considering plausible luminosity functions, Chapman, Priddey, & Tanvir (2009) calculated the probability that the IPN would observe a giant flare, with energy greater than the energy emitted by the giant flare from SGR 1806-20, in the region surveyed during the 17 years it has operated. For one giant flare, they calculated the probability to be 10%. However, as we discussed in the introduction, there are four potential candidates for extragalactic SGR giant flares, including GRB 070201 near M31 which has been identified as an SGR giant flare by Mazets et al. (2008). The probablility that the IPN has detected two SGR giant flares, with energy greater than the giant flare from SGR 1806-20, is 0.6% (Chapman, Priddey, & Tanvir, 2009). Recently, several new SGR candidates have been identified including 0501+4516, 1550-5418 and possibly 0623-0006 (Barthelmy et al., 2008a; Krimm et al., 2008; Barthelmy et al., 2008b), which may imply that the number of SGRs in the Milky Way is higher than previously thought. In this case, the luminosity of the giant flare from SGR 1806-20 would have to be at the peak of the luminosity function of SGR giant flares and therefore giant flares of this luminosity must be extremely rare events. This argues that GRB 051103 is unlikely to be a second SGR giant flare in the nearby universe.
6 Conclusions
GRB 051103 illustrates the difficulties of identifying a short burst as an extragalactic giant magnetar flare beyond a reasonable doubt. Even setting aside the questions of detecting and localizing such events, and establishing their associations with nearby galaxies, their interpretation is problematic. On the one hand, the localization, short duration, and hard energy spectra of GRB 051103 suggest that it is a giant flare from M81. However, a deeper analysis of its time history demonstrates that the periodic component, which is a key signature of giant flares, is unlikely to ever be detected at great distances by the IPN if all giant flares are similar to the three observed to date. The energy spectrum at the peak of the emission is very hard (E3 MeV), and is detected to 7 MeV at the 3 level, with marginal emission up to 17 MeV. Yet it is not inconceivable that a short duration GRB could have these properties. Although the Epeak of GRB 051103 evolves from hard to soft, the evolution to a very soft spectrum, which is expected during the oscillatory phase of an SGR giant flare, is undetectable, as is the oscillatory phase itself. Thus evidence for an extragalactic giant flare origin of GRB 051103 remains tantalizing, but inconclusive. On a more positive note, if an extragalactic magnetar flare occured within the Swift-BAT field of view, so that the XRT could begin observing within a minute or so, the periodic component would be detectable at low energies to at least 10 Mpc (Hurley et al. 2005).
We have presented new optical observations of GRB 051103 and have determined that there is no R band optical afterglow with a limiting magnitude of (for an afterglow overlapping a host galaxy, the limiting magnitude is ) in the region of the error ellipse covered by our observations. Comparison of the prompt emission of GRB 051103 with a sample of other SGRBs leads us to conclude that if it was a classical SGRB we would expect to have located an optical afterglow in our observations.
In contrast, if GRB 051103 were an SGR giant flare in M81, non-detection of an afterglow would not be surprising as the expectations for optical afterglow emission lie significantly below the limits obtained here, or the limits likely to be attained via current technology. The case for an SGR origin would be strengthened if there were an accompanying SNR within the error ellipse, but there is no evidence of this. An SGR produced via accretion induced collapse of a WD (Levan et al., 2006b) would, however, remove the requirement for an SNR. Additionally, the luminosity of GRB 051103, assuming it is from an SGR giant flare in M81, is significantly higher than known SGR giant flares but still attainable with current theoretical models. Giant flares with luminosity similar to the giant flare from SGR 1806-20 are extremely rare and it is unlikely that GRB 051103 and GRB 070201 are both extragalactic SGR giant flares.
Although we have not considered this option in detail, it is possible that the progenitor of GRB 051103 was a compact binary merger in M81. In this case, it would just be within the reach of current gravitational wave searches. This scenario was ruled out at 99% confidence for GRB 070201 in M31 using the Laser Interferometer Gravitational-wave Observatory (LIGO) observations, and distances out to 3.5 Mpc were ruled out to 90% confidence (Abbott et al., 2008). The LIGO Scientific Collaboration is currently considering a search for gravitational-wave signals in the data surrounding GRB 051103 (G. Jones and P. Sutton, private communication).
Acknowledgments
KH is grateful for IPN support from the NASA Guest Investigator programs for Swift (NASA NNG04GQ84G), INTEGRAL (NAG5-12706), and Suzaku (NNX06AI36G); for support under the Mars Odyssey Participating Scientist Program, JPL Contract 1282046; and under the HETE-II co-investigator program, MIT Contract SC-A-293291. We are also grateful to the Konus-Wind team - E. Mazets, S. Golenetskii, D. Frederiks, V. Pal’shin, and R. Aptekar - for contributing the Konus data to this study.
AR, KW and ER, NRT & AJL would like to acknowledge funding from the Science and Technology Funding Council.
This research has made use of data obtained using, or software provided by, the UK’s AstroGrid Virtual Observatory Project, which is funded by the Science and Technology Facilities Council and through the EU’s Framework 6 programme.
The National Optical Astronomy Observatory (NOAO) consists of Kitt Peak National Observatory near Tucson, Arizona, Cerro Tololo Inter-American Observatory near La Serena, Chilie, and the NOAO Gemini Science Centre. NOAO is operated by the Association of the Universities for Research in Astronomy (AURA) under a cooperative agreement with the National Science Foundation.
Based on observations with MegaPrime/MegaCam, a joint project of CFHT and CEA/DAPNIA, at the Canada-France-Hawaii Telescope (CFHT) which is operated by the National Research Council (NRC) of Canada, the Institut National des Sceicne de l’Univers of the Centre National de la Recherche Scientifique (CNRS) of France, and the University of Hawaii. This work is based in part on data products produced at TERAPIX and the Canadian Astronomy Data Centre as part of the Canada-France-Hawaii Telescope Legacy Survey, a collaborative project of NRC and CNRS.
The Digitized Sky Surveys were produced at the Space Telescope Science Institute under U.S. Government grant NAG W-2166. The images of these surveys are based on photographic data obtained using the Oschin Schmidt Telescope on Palomar Mountain and the UK Schmidt Telescope. The plates were processed into the present compressed digital form with the permission of these institutions.
Based on observations made through the Isaac Newton Group’s Wide Field Camera Survey Programme with the Isaac Newton Telescope operated on the island of La Palma by the Isaac Newton Group in the Spanish Observatorio del Roque de los Muchachos of the Instituto de Astrofísica de Canarias.
This work made use of THINGS, ’The HI Nearby Galaxy Survey’ (Walter et al., 2008).
We also acknowledge useful discussions with G. Jones and P. Sutton.
References
- Abbott et al. (2008) Abbott B., et al., 2008, ApJ, 681, 1419
- Adelman-McCarthy et al. (2008) Adelman-McCarthy J. K., et al., 2008, ApJS, 175, 297
- Akerlof et al. (2000) Akerlof C., et al., 2000, ApJ, 542, 251
- Alard (2000) Alard C., 2000, A&AS, 144, 363
- Alard & Lupton (1998) Alard C., Lupton R. H., 1998, ApJ, 503, 325
- Aptekar et. al. (1995) Aptekar, R. et al., 1995, Space Sci. Rev. 71, 265
- Atteia et. al. (2003) Atteia, J.-L. et al., 2003, AIP Conf. Proc. 662, Eds. G. Ricker and R. Vanderspek, (AIP: New York), 17
- Band et. al. (1993) Band, D. et al., 1993, Ap. J. 413, 281
- Barbier et al. (2007) Barbier L., et al., 2007, GCN, 6623, 1
- Baron et al. (1987) Baron E., Cooperstein J., Kahana S., Nomoto K., 1987, ApJ, 320, 304
- Barthelmy et al. (2006) Barthelmy S., et al., 2006, GCN, 5256, 1
- Barthelmy et al. (2008a) Barthelmy S. D., et al., 2008a, GCN, 8113, 1
- Barthelmy et al. (2008b) Barthelmy S. D., et al., 2008b, GCN, 8458, 1
- Bibby et al. (2008) Bibby J. L., Crowther P. A., Furness J. P., Clark J. S., 2008, MNRAS, 386, L23
- (15) Boggs, S. et al., 2007, Ap. J. 661, 458
- (16) Cameron, P., and Frail, D., 2005, GCN Circ. 4266
- Chapman, Priddey, & Tanvir (2009) Chapman R., Priddey R. S., Tanvir N. R., 2009, MNRAS, 395, 1515
- Corbel et al. (1997) Corbel S., Wallyn P., Dame T. M., Durouchoux P., Mahoney W. A., Vilhu O., Grindlay J. E., 1997, ApJ, 478, 624
- Cummings et al. (2005) Cummings J., et al., 2005, GCN, 4365, 1
- Cummings et al. (2009) Cummings J. R., Page K. L., Beardmore A. P., Gehrels N., 2009, ATel, 2127, 1
- D’Avanzo et al. (2009) D’Avanzo P., et al., 2009, arXiv, arXiv:0901.4038
- de Grijs et al. (2000) de Grijs R., O’Connell R. W., Becker G. D., Chevalier R. A., Gallagher J. S., III, 2000, AJ, 119, 681
- Duncan & Thompson (1992) Duncan R. C., Thompson C., 1992, ApJ, 392, L9
- Eichler (2002) Eichler D., 2002, MNRAS, 335, 883
- Fenech et al. (2008) Fenech D. M., Muxlow T. W. B., Beswick R. J., Pedlar A., Argo M. K., 2008, MNRAS, 391, 1384
- Fenimore et al. (1981) Fenimore, E., Evans, W., Klebesadel, R., Laros, J., and Terrell, J., 1981, Nature, 289, 42
- Frederiks et al. (2007a) Frederiks D. D., Palshin V. D., Aptekar R. L., Golenetskii S. V., Cline T. L., Mazets E. P., 2007a, AstL, 33, 19
- (28) Frederiks, D., et al., 2007b, Astron. Lett. 33(1), 1
- Freedman et al. (1994) Freedman W. L., et al., 1994, ApJ, 427, 628
- Gaensler et al. (2001) Gaensler B. M., Slane P. O., Gotthelf E. V., Vasisht G., 2001, ApJ, 559, 963
- Gaensler et al. (2005) Gaensler B. M., McClure-Griffiths N. M., Oey M. S., Haverkorn M., Dickey J. M., Green A. J., 2005, ApJ, 620, L95
- Gehrels et al. (2004) Gehrels N., et al., 2004, ApJ, 611, 1005
- Gehrels et al. (2008) Gehrels N., et al., 2008, ApJ, 689, 1161
- Golenetskii et al. (2007) Golenetskii S., Aptekar R., Mazets E., Pal’Shin V., Frederiks D., Cline T., 2007, GCN, 6615, 1
- Golenetskii et al. (2006) Golenetskii S., Aptekar R., Mazets E., Pal’Shin V., Frederiks D., Cline T., 2006, GCN, 4564, 1
- Golenetskii et al. (2005) Golenetskii S., et al., 2005, GCN, 4197, 1
- (37) Houck, J. 2000, in Astronomical Data Analysis Software and Systems IX, Eds. N. Manset, C. Veillet, and D. Crabtree, Astronomical Society of the Pacific Conf. Series 216, 591
- Hullinger et al. (2005) Hullinger D., et al., 2005, GCN, 4400, 1
- (39) Hurley, K. et al., 1999, Nature 397, 41
- (40) Hurley, K. et al., 2000, Ap. J. 537, 953
- Hurley et al. (2005) Hurley K., et al., 2005, Nature, 434, 1098
- (42) Hurley, K., et al., 2006, Ap. J. Supp. Ser. 164, 124
- Ilbert et al. (2006) Ilbert O., et al., 2006, A&A, 457, 841
- Immler & Kuntz (2005) Immler S., Kuntz K. D., 2005, ApJ, 632, L99
- King, Pringle, & Wickramasinghe (2001) King A. R., Pringle J. E., Wickramasinghe D. T., 2001, MNRAS, 320, L45
- (46) Klose, S. et al., 2005, GCN Circ. 4207
- Krimm et al. (2006) Krimm H., et al., 2006, GCN, 5704, 1
- Krimm et al. (2008) Krimm H. A., Beardmore A. P., Gehrels N., Page K. L., Palmer D. M., Starling R. L. C., Ukwatta T. N., 2008, GCN, 8312, 1
- (49) Lazzati, D., et al., 2005, Mon. Not. R. Astron. Soc. 362, L8
- Levan et al. (2006a) Levan A. J., et al., 2006a, ApJ, 648, L9
- Levan et al. (2006b) Levan A. J., Wynn G. A., Chapman R., Davies M. B., King A. R., Priddey R. S., Tanvir N. R., 2006b, MNRAS, 368, L1
- Levan et al. (2008) Levan A. J., et al., 2008, MNRAS, 384, 541
- (53) Lipunov, V. et al. 2005a, GCN Circ. 4198
- (54) Lipunov, V. et al. 2005b, GCN Circ. 4206
- (55) Lomb, N., 1976, Astrophys. Space Sci. 39, 447
- Lupton (2005) Lupton, R. 2005, http://www.sdss.org/dr4/
- Magrini et al. (2001) Magrini L., Perinotto M., Corradi R. L. M., Mampaso A., 2001, A&A, 379, 90
- Mangano et al. (2007) Mangano V., et al., 2007, A&A, 470, 105
- Martin et al. (2005) Martin D. C., et al., 2005, ApJ, 619, L1
- Matonick & Fesen (1997) Matonick D. M., Fesen R. A., 1997, ApJS, 112, 49
- Mazets et al. (1979) Mazets E. P., et al., 1979, Nature, 282, 587
- Mazets et al. (1999) Mazets E. P., et al., 1999, Astron. Lett., 25, 635
- (63) Mazets, E. et al., 2004, in Proc. of the Third Rome Workshop on Gamma-Ray Bursts in the Afterglow Era, Eds. M. Feroci, F. Frontera, N. Masetti, and L. Piro, ASP Conf. Ser. 312, 102
- Mazets et al. (2008) Mazets E. P., et al., 2008, ApJ, 680, 545
- McMahon et al. (2001) McMahon R. G., Walton N. A., Irwin M. J., Lewis J. R., Bunclark P. S., Jones D. H., 2001, NewAR, 45, 97
- Mereghetti et al. (2000) Mereghetti S., Cremonesi D., Feroci M., Tavani M., 2000, A&A, 361, 240
- (67) Mereghetti, S., et al., 2005, Ap. J. 624, L105
- Mirabel & Fuchs (1999) Mirabel F. I., Fuchs Y., 1999, astro, arXiv:astro-ph/9912446
- (69) Nakar, E., et al., 2006, Ap. J. 640, 849
- Nysewander, Fruchter, & Pe’er (2008) Nysewander M., Fruchter A. S., Pe’er A., 2008, arXiv, arXiv:0806.3607
- (71) Ofek, E. et al., 2005, GCN Circ. 4208
- Ofek et al. (2006) Ofek E. O., et al., 2006, ApJ, 652, 507
- Ofek et al. (2008) Ofek E. O., et al., 2008, ApJ, 681, 1464
- Oppenheimer et al. (1998) Oppenheimer B. R., Bloom J. S., Eikenberry S. S., Matthews K., 1998, ATel, 26, 1
- Palmer et al. (2005) Palmer D. M., et al., 2005, Nature, 434, 1107
- (76) Parkinson, P. et al., 2005, GCN Circ. 4249
- Perley et al. (2009) Perley D. A., et al., 2009, ApJ in press
- Piranomonte et al. (2008) Piranomonte S., et al., 2008, A&A, 491, 183
- (79) Popov, S., and Stern, B., 2006, Mon. Not. R. Astron. Soc. 365, 885
- (80) Rau, A., et al., 2005, Astron. Astrophys. 438, 1175
- Sakamoto et al. (2008) Sakamoto T., et al., 2008, ApJS, 175, 179
- Sato et al. (2007) Sato G., et al., 2007, GCN, 7148, 1
- (83) Smith, D. M. et al., 2002, Solar Physics, 210, 33
- Soderberg et al. (2006) Soderberg A. M., et al., 2006, ApJ, 650, 261
- Soria & Perna (2008) Soria R., Perna R., 2008, ApJ, 683, 767
- Sturner et al. (2000) S. J. Sturner, H. Seifert, C. Shrader, and B. J. Teegarden, 2000, in American Institute of Physics Conference Series, edited by M. L. McConnell, and J. M. Ryan, vol. 510 of American Institute of Physics Conference Series, p. 814.
- Swartz et al. (2003) Swartz D. A., Ghosh K. K., McCollough M. L., Pannuti T. G., Tennant A. F., Wu K., 2003, ApJS, 144, 213
- (88) Tanaka, Y., et al., 2007, Ap. J. 665, L55
- (89) Tanvir, N., et al., 2005, Nature 438, 991
- (90) Terasawa, T., et al., 2005, Nature 434, 1110
- Ukwatta et al. (2008) Ukwatta T., et al., 2008, GCN, 7673, 1
- Vrba et al. (2000) Vrba F. J., Henden A. A., Luginbuhl C. B., Guetter H. H., Hartmann D. H., Klose S., 2000, ApJ, 533, L17
- Walter et al. (2008) Walter F., Brinks E., de Blok W. J. G., Bigiel F., Kennicutt R. C., Thornley M. D., Leroy A., 2008, AJ, 136, 2563
- Walton et al. (2006) Walton N. A., Richards A. M. S., Padovani P., Allen M. G., 2006, IAUS, 232, 398
- Wang et al. (2005) Wang X. Y., Wu X. F., Fan Y. Z., Dai Z. G., Zhang B., 2005, ApJ, 623, L29
- (96) Yamaoka, K., et al., 2009, PASJ 61, S35
- Zhang et al. (2009) Zhang B., et al., 2009, arXiv, arXiv:0902.2419