Dust coagulation in star formation with different metallicities
Abstract
Dust grains coagulate into larger aggregates in dense gas. This changes their size distribution and possibly affects the thermal evolution of star-forming clouds. We here investigate dust coagulation in collapsing pre-stellar cores with different metallicities by considering the thermal motions of grains. We show that coagulation does occur even at low metallicity . However, we also find (i) that the H2 formation rate on dust grains is reduced only after the majority of H2 is formed; and (ii) that the dust opacity is modified only after the core becomes optically thick. Therefore, we conclude that the effects of dust coagulation can safely be neglected in discussing the temperature evolution of the pre-stellar cores for any metallicity as long as the grain motions are thermal.
keywords:
dust, extinction — galaxies: evolution — galaxies: high-redshift — ISM: abundances — molecular processes — stars: formation1 Introduction
The first generation of stars is believed to be very massive (; e.g. Bromm & Larson 2004), while those in the solar neighbourhood have typical masses of (e.g. Larson, 2005). The transition in the characteristic stellar mass should have occurred in the history of the Universe. The most widely accepted cause for this transition is metal enrichment in the interstellar medium (Omukai, 2000; Bromm et al., 2001; Schneider et al., 2002). In other words, the transition of the characteristic stellar mass occurs at a ‘critical metallicity’.
Dust grains should be produced in supernovae of first stars and thus be present in metal-enriched gas (Todini & Ferrara, 2001; Nozawa et al., 2003; Schneider, Ferrara, & Salvaterra, 2004). Their thermal emission becomes effective for gas cooling through collisional coupling at such high density that the Jeans mass is below . With a sufficient amount of dust, dust cooling is able to induce fragmentation into subsolar mass cores. If most of the metals condense into dust, the critical metallicity is as low as (Omukai et al., 2005), although difference in grain composition and grain size distribution alters the exact value by about an order of magnitude (Schneider et al., 2006).
In such dense clumps where dust cooling is efficient, however, coagulation of dust grains could proceed and modify the dust opacity as well as the H2 formation efficiency on dust grains, consequently affecting the thermal evolution of star-forming clouds. Therefore, coagulation may have a large influence on the critical metallicity. In spite of this potential importance, the effects of coagulation on the thermal evolution of star-forming clouds have not been considered in previous studies.
In this paper, we assess the effects of coagulation on the thermal evolution of star-forming clouds. We focus on low metallicity in the context of the critical metallicity, but we treat all the range of metallicity from nearly zero to . Therefore, the methods and results in this paper are applicable to star-forming clouds at any metallicity. This paper is organized as follows. The method used in this paper is explained in Section 2. We describe some basic properties of the thermal evolution of collapsing cores in Section 3. The effects of coagulation are discussed in Section 4. Finally, Section 5 gives the conclusion.
2 Method
We examine the effect of coagulation on the thermal evolution of star-forming collapsing cores. First, the density and temperature evolution of collapsing cores are calculated with a fixed grain size distribution (i.e. without coagulation). Then, under these calculated density and temperature, we estimate the effect of dust coagulation. We explain the basic ingredients of our calculations in the following with particular emphasis on physics related to dust grains.
2.1 Basic equations for pre-stellar collapse
We calculate the thermal evolution of star-forming cores by using the formulations developed by Omukai (2000) and improved by Omukai et al. (2005). Here we briefly review the methods.
The collapsing gas in a star-forming core is treated as one zone with a homogeneous hydrogen nuclei number density and a single gas temperature . These density and temperature can be interpreted as those in the central region of the core, whose size is given by the Jeans length. The evolution of density is calculated by
| (1) |
where is the free-fall time and is the gravitational constant. The temperature evolution is calculated by solving the energy equation,
| (2) |
where is the specific thermal energy, is the pressure, is the density, and is the net cooling rate. The net cooling rate includes all the important processes: molecular/atomic line emission, dust and gas continuum emission, and chemical heating and cooling. For the details of the cooling/heating processes and of their treatment, we refer to Omukai (2000), although we review the processes related to dust grains in the following subsections. We additionally impose a cosmic background radiation at (i.e. K), so that the temperature does not drop below it. However, our results on coagulation are not sensitive to the background temperature.
2.2 Dust cooling
Dust grains achieve the following balance between dust thermal emission and heating due to collisions with gas particles:
| (3) |
where is the Stefan–Boltzmann constant, is the dust temperature, is the Planck mean opacity of dust grains per unit dust mass, is the photon escape probability, is the dust-to-gas mass ratio, and is the collisional heating (cooling) rate of dust (gas) particles. Following Omukai (2000), the photon escape probability is written as by using the optical depth .
The collisional heating rate of dust particles can be written as (Hollenbach & McKee, 1979)
| (4) |
where is the mean interval between two successive collisions, and are the grain number density and cross-section, respectively, is the average speed of hydrogen nuclei under a Maxwellian distribution, and (, corresponding to a He mass fraction of ) measures the contribution from species other than protons. Once the grain temperature exceeds the sublimation temperature, , the grains are assumed to disappear.
The grain cross-section is related to the total surface area of grains per unit dust mass, , as
| (5) |
Given the grain size distribution functions per unit dust mass, (i.e. gives the number of dust grains of species with radius between and per unit dust mass and the grains are assumed to be spherical), and the mass fractional abundance, , of each grain species , is quantified as
| (6) |
The grain surface area determines the H2 formation rate on grain surface, and the line emission from formed H2 contributes to gas cooling.
The total absorption coefficient at frequency per unit dust mass is written in a similar way as
| (7) |
where is the absorption cross-section of species normalized to the geometrical cross-section.
2.3 H2 formation on dust grains
The H2 formation rate on grain surface per unit volume can be expressed as , where is the number density of H atoms in the gas phase. We use the rate coefficient (Tielens & Hollenbach, 1985)
| (8) |
where is the total surface area of dust grains, is that for the MRN grain size distribution (Section 2.5) for ( is the metallicity),
| (9) |
and
| (10) |
Note that, without coagulation, is simply . The rate coefficient (equation 8) with is consistent with observationally derived rates for a sample of clouds in the solar neighbourhood (Jura, 1975; Hollenbach & McKee, 1979). Thus we expect that equation (8) with is valid for the MRN grain size distribution and solar metallicity.
2.4 Grain coagulation
The time evolution of the grain size distribution by coagulation is calculated by adopting the formulation of Hirashita & Yan (2009). Since they treated coagulation under a constant density, we modified the formulation to treat the varying gas density in collapsing cores. We briefly review the calculation method. The details are described in Hirashita & Yan (2009). In this subsection, we omit the index specifying the species.
As assumed in Hirashita & Yan (2009), we consider grains to be compact and spherical. In other words, we do not consider fluffy aggregates, which are suggested to form after sticking of grains (Meakin & Donn, 1988; Ossenkopf, 1993).111We note that aggregation rather than coagulation may be more appropriate terminology to express the grain growth after grain–grain collisions, especially when we consider fluffy aggregates. However, we use the term ‘coagulation’ throughout this paper, since we only consider compact (i.e. not fluffy) grains. There are two competing effects of the fluffiness. Fluffy grains would increase the coagulation rate (Ormel, Spaans, & Tielens, 2007), which could enhance the decrease of . On the other hand, fluffy grains have larger than compact grains. Because of these competing effects on , it is not obvious if the change of is under- or overestimated by assuming a compact structure.
We solve the coagulation equation discretized for the grain size. The total grain mass density is normalized to . Thus, as becomes denser in the evolution of collapsing cores, the grain density also becomes proportionally larger.
We consider silicate and graphite as grain species. In order to avoid complexity in compound species, we only treat collisions between the same species. The time evolution of (grain density contained in the -th size bin; all the subscripts in the following equation specify the bin number) by coagulation can be written as
| (11) |
where
| (14) |
( is the sticking probability) and if the mass of the coagulated particle is in the mass range of the -th bin; otherwise . Coagulation is assumed to occur only if the relative velocity is less than the coagulation threshold velocity . The cross-section for the coagulation is . The coagulation threshold velocity is given by (Chokshi, Tielens, & Hollenbach, 1993; Dominik & Tielens, 1997; Yan, Lazarian, & Draine, 2004)
| (15) |
where is the surface energy per unit area, is the reduced radius of the grains, is related to Poisson’s ratios ( and ) and Young’s modulus ( and ) by . We also assume for the sticking probability. A sticking probability of order unity below the coagulation threshold is shown by experimental studies (Blum, 2000). The effect of is also addressed in Section 4.1.
We adopt a single velocity for each grain size. The velocity is given by the thermal (Brownian) velocity as
| (16) |
Smaller grains have larger thermal velocities, and the effect of coagulation first appears for the smallest grains (see also Section 4). As shown in Ossenkopf (1993), motions other than the thermal motion are potentially important. In particular, large grains tend to be coupled with turbulent motion if it exists (Ossenkopf, 1993; Weidenschilling & Ruzmaikina, 1994; Ormel et al., 2009).222Recently, Ormel et al. (2009) show that even if turbulent velocity is considered, large grains with m do not coagulate significantly on the free-fall timescale. However, they consider relatively small densities ( cm-3), and the effect of turbulence on the higher density range is still open. For the sake of simplicity and exploratory nature of this work, the contribution of other velocity sources is ignored here and remains open for further study.
Each time-step is divided into four equal small steps, and we apply , , , and in each step, following Hirashita & Yan (2009). A relative velocity of , where the reduced mass, is often adopted, but the difference caused by the different treatment of relative velocity is too small to change our conclusion.
2.5 Adopted parameters for dust grains
As stated above, we assume a mixture of silicate and graphite species. We adopt for both silicate and graphite, and the contribution from these two species are summed with weights and 0.46 for silicate and graphite, respectively (Hirashita & Yan, 2009). The dust-to-gas ratio in solar metallicity environments (0.006) is taken from Spitzer (1978). The material densities are adopted from Draine & Lee (1984) (3.3 and 2.26 g cm-3 for silicate and graphite, respectively).
The quantities for coagulation are taken from Chokshi, Tielens, & Hollenbach (1993) (the data for quartz and graphite are used for silicate and graphite, respectively; i.e. and 12 erg cm-2, and dyn cm-2, and and 0.5 for silicate and graphite, respectively). The sublimation temperatures ( and 1750 K for silicate and graphite, respectively) are taken from Laor & Draine (1993).
The absorption cross-section of grains is calculated by using the Mie theory (Bohren & Huffman, 1983). The optical constants of silicate (astronomical silicate) and graphite are taken from Draine & Lee (1984). The grain size distribution is assumed to be in the size range m and out of this range for both silicate and graphite as indicated by Mathis, Rumpl, & Nordsieck (1977) (MRN).
3 Thermal evolution without coagulation
First, density and temperature evolutions are calculated without coagulation (i.e. with the fixed MRN grain size distribution; Section 2.5). Then, the density and temperature given in this section are used as the background density and temperature under which grain coagulation is calculated in the next section.
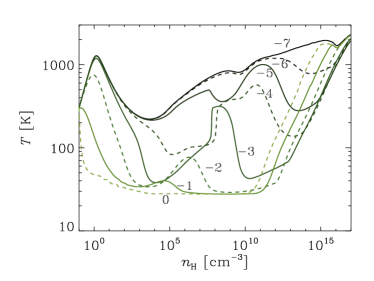
The evolutions of collapsing cores are shown in Fig. 1 in the metallicity range . In the case with , metal effects are negligible and its temperature evolution is identical to the metal-free one. In cores with metallicity , H2 is mainly formed via gas-phase reactions. With higher metallicity, i.e. higher dust abundance, the majority of H2 is formed via the dust surface reactions. H2 line cooling contributes significantly to the thermal evolution at relatively low densities ( cm-3) as seen by the dips of the temperature evolution in this density range, although carbon and oxygen fine-structure lines contribute more to the cooling at . Therefore, the modification of grain surface area (if any) is the most relevant around this density range. On the other hand, the impact of dust cooling appears around cm-3 for metallicities as seen by the dips of the temperature evolution. At higher densities, dust cooling has minor influence on the thermal evolution, since the system becomes optically thick to dust continuum. Although the metallicity range where the effect of dust cooling appears is broadly consistent with Omukai et al. (2005), the effect is more pronounced at the same metallicity in our case, especially for the lowest values . This is because our assumed composition of carbonaceous grains, graphite, is more refractory than organic compounds adopted in Omukai et al. (2005). Grains survive up to cm-3 in our case. Our choice is conservative in the sense that the coagulation effect becomes more visible as the dust survives and coagulates up to higher temperature and density.
4 Effects of coagulation
Here we evaluate the effect of coagulation under the density–temperature evolution calculated in the previous section. Coagulation could affect the thermal evolution of collapsing cores through the changes of and . The former and latter quantities have influence on the H2 formation rate and the dust cooling rate, respectively. In Fig. 2, we show the evolution of these two quantities. Both quantities are divided by the values without coagulation (i.e. the MRN grain size distribution) and are denoted as and . The effects of coagulation appear if these ratios deviate significantly from unity. In fact, they change at high density, which indicates that coagulation really takes place efficiently enough to affect the grain opacity and the grain surface area.
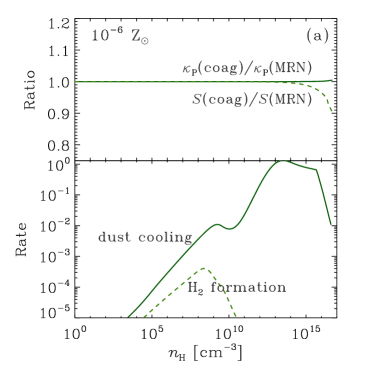
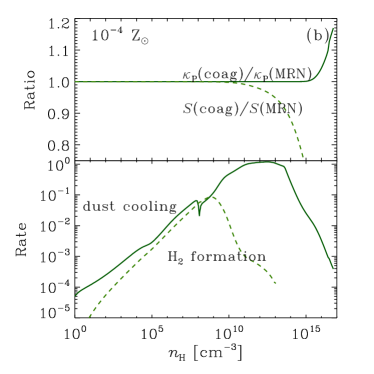
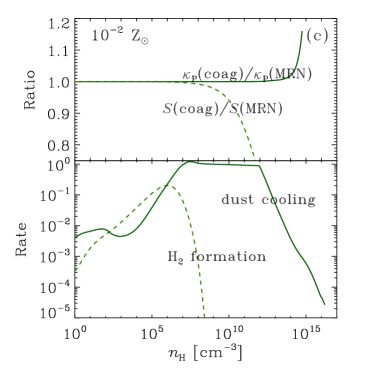
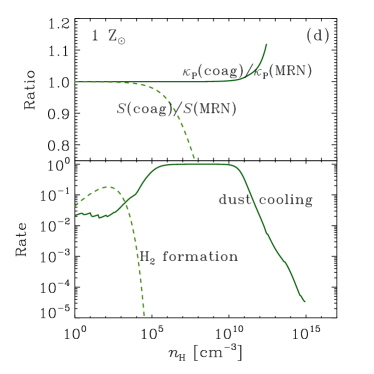
In Fig. 2, we also show the dust cooling rate relative to the total (compressional and chemical) heating rate and the increase rate of H2 fraction per free-fall time. The latter is equal to , where is the H2 fraction ( if hydrogen is fully molecular), and the subscript “dust” indicates the contribution from grain surface reaction.
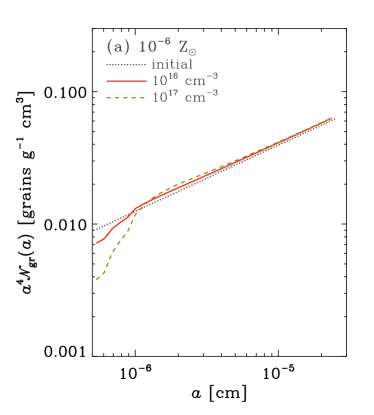
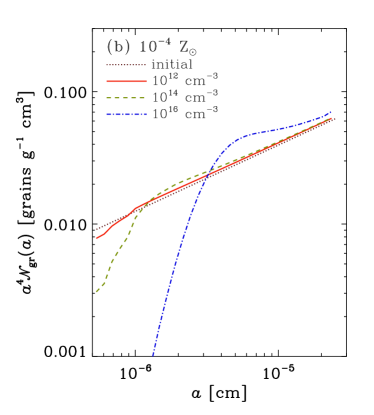
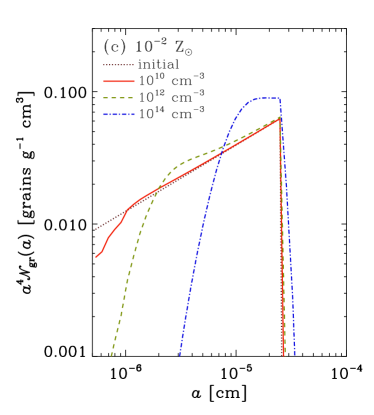
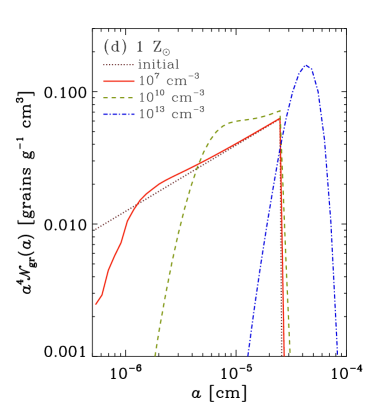
In order to have an idea about how coagulation proceeds, we also show the grain size distributions in Fig. 3, where the grain size distribution is multiplied by to show the grain mass distribution per logarithmic size (the largest contribution to the dust mass comes from the grain size range where peaks). By comparing Fig. 3 with Fig. 2, we observe that the decrease of grains with is indeed seen at the density range where decreases in Fig. 2. The increase of , on the other hand, occurs when the grains are coagulated to cm. In the following, we will discuss further details.
4.1 Grain surface area and coagulation criterion
We compare the dashed lines of the upper and lower panels (i.e. grain surface area vs. H2 formation rate by grain surface reaction) in Fig. 2. We observe that the drop of grain surface area generally occurs well after the H2 formation on grain surface is completed. This means that coagulation has no influence on the thermal evolution of collapsing cores either through H2 line cooling or H2 formation heating. The main reason why H2 formation is faster than grain coagulation is that the thermal velocity of H atoms is much larger than that of grains.
The coagulation time-scale can be estimated by the grain–grain collision time-scale. The condition that coagulation takes place on a free-fall time-scale () is expressed as , where is called “critical density for coagulation” in this paper. The critical density for coagulation is estimated as
| (17) | |||||
where is the grain material density. This equation is derived in the Appendix, where the grain size is represented by a single value for the simplicity of estimation. Indeed as shown in Figs. 2 and 3, if , coagulation significantly decreases the grain surface area, and the grain size distributions at cm are indeed affected by coagulation. This criterion can be used generally, as long as a grain size distribution similar to MRN is adopted and the grain velocity is thermal. Equation (17) can also be solved for under a given hydrogen number density to obtain a condition for the grain size affected by coagulation.
As shown in equation (17), if we assume a smaller sticking efficiency (), increases in proportion to . Thus, the conclusion that coagulation has no influence on the thermal evolution of collapsing cores is strengthened if we adopt .
4.2 Grain opacity
We compare the solid lines of the upper and lower panels (i.e. Planck mean opacity vs. dust cooling) in Fig. 2. We find that the change of appears after the epoch in which dust cooling dominates. In other words, before coagulation affects the grain opacity, the contribution from dust cooling has already declined because the system becomes optically thick to dust continuum. This indicates that the change of grain opacity by coagulation has no influence on the thermal evolution. In particular, is kept to be unity even after drops significantly. This is because does not depend on the grain radius under a fixed total grain mass. In fact, from equation (7), ( is the total grain number per unit dust mass) with evaluated at a typical grain radius, while if (Draine & Lee, 1984) and from the conservation of the total dust mass.
Since the grain opacity is proportional to the grain mass, Fig. 3 is useful to understand which grain size dominates the grain opacity. The largest grains dominate the grain mass in the MRN grain size distribution, which means that the grain opacity is also dominated by the largest grains.
In all the metallicities except for , we find that increases at a high density depending on metallicity. At this density, the dust temperature, which is almost equal to the gas temperature, is –1000 K, and the radiation spectrum has a peak around wavelengths of –30 m. At this wavelength range, of graphite increases as a function of if m because of the contribution from magnetic dipole radiation (Draine & Lee, 1984). Moreover, the fraction of grains with m is enhanced after coagulation. These two effects (temperature increase and grain growth) are the reason for the increase of .
5 Conclusion
By calculating the thermal evolution and the grain coagulation in collapsing cores, we have shown that coagulation does not affect their thermal evolution for any metallicity () as long as the grain velocities are governed by thermal motions.
Although the above statement is the most important conclusion in this paper, there are two things that are worth raising. First, coagulation really takes place when the density is high enough. Coagulation is important at cm-3 for and the density range with efficient coagulation shifts to higher densities because of lower grain abundance (i.e. lower grain collision rate). The condition that is equivalent to . This can be widely used as the criterion that coagulation occurs in a free-fall time as long as the grain size distribution is MRN and the grain velocities are dominated by the thermal motions. Second, is unaffected by coagulation up to high densities where the contribution from dust cooling drops. The reason why is insensitive to coagulation is that is almost independent of the grain radius if ( is the wavelength at which the radiation spectrum peaks) holds and the dust temperature is K.
Acknowledgments
We thank the anonymous referee for useful and constructive comments which improved this paper considerably. We thank A. Ferrara for helpful suggestions. This study is supported in part by the Grants-in-Aid by the Ministry of Education, Culture, and Science of Japan (19047004, 21684007; KO).
Appendix A Derivation of equation (17)
We provide an estimate of coagulation time-scale. The coagulation time-scale, , can be estimated by the time-scale on which a grain encounter another grain:
| (18) |
where we have assumed that the grains have typical representative radius and velocity , and is the grain number density. We explicitly write the sticking probability , which is assumed to be 1 in the text. The grain velocity can be estimated by the thermal velocity,
| (19) |
where the typical grain mass is estimated to be
| (20) |
The grain number density, can be related to the dust-to-gas ratio as
| (21) |
Using equations (19), (20), and (21), equation (18) is written as
| (22) | |||||
Now we examine if coagulation takes place within the collapsing timescale, i.e. the free-fall timescale. The free-fall time-scale is numerically estimated as
| (23) |
Significant coagulation occurs if is satisfied, which is equivalent to the condition . The critical density for coagulation, , is given in equation (17), where we have replaced with by assuming that dust-to-gas ratio is proportional to metallicity.
References
- Blum (2000) Blum, J. 2000, Space Sci. Rev., 92, 265
- Bohren & Huffman (1983) Bohren, C. F., & Huffman, D. R. 1983, Absorption and Scattering of Light by Small Particles, Wiley, New York
- Bromm et al. (2001) Bromm, V., Ferrara, A., Coppi. P. S. & Larson, R. B. 2001, MNRAS, 328, 969
- Bromm & Larson (2004) Bromm, V., & Larson, R. B. 2004, ARA&A 42, 79
- Chokshi, Tielens, & Hollenbach (1993) Chokshi, A., Tielens, A. G. G. M., & Hollenbach, D. 1993, ApJ, 497, 806
- Draine & Lee (1984) Draine, B. T., & Lee, H. M. 1984, ApJ, 285, 89
- Dominik & Tielens (1997) Dominik, C., & Tielens, A. G. G. M. 1997, ApJ, 480, 647
- Hirashita & Yan (2009) Hirashita, H., & Yan, H. 2009, MNRAS, 394, 1061
- Hollenbach & McKee (1979) Hollenbach, D., & McKee, C. F. 1979, ApJS, 41, 555
- Jura (1975) Jura, M. 1975, ApJ, 197, 575
- Laor & Draine (1993) Laor, A., & Draine, B. T. 1993, ApJ, 402, 441
- Larson (2005) Larson, R. B. 2005, MNRAS, 359, 211
- Mathis, Rumpl, & Nordsieck (1977) Mathis, J. S., Rumpl, W., & Nordsieck, K. H. 1977, ApJ, 217, 425 (MRN)
- Meakin & Donn (1988) Meakin, P., & Donn, B. 1988, ApJ, 329, L39
- Nozawa et al. (2003) Nozawa, T., Kozasa, T., Umeda, H., Maeda, K., & Nomoto, K. 2003, ApJ, 598, 785
- Omukai (2000) Omukai, K. 2000, ApJ, 534, 809
- Omukai et al. (2005) Omukai, K., Tsuribe, T., Schneider, R. & Ferrara, A. 2005, ApJ, 626, 627
- Ormel et al. (2009) Ormel, C. W., Paszun, D., Dominik, C., & Tielens, A. G. G. M. 2009, A&A, in press
- Ormel, Spaans, & Tielens (2007) Ormel, C. W., Spaans, M., & Tielens, A. G. G. M. 2007, A&A, 461, 215
- Ossenkopf (1993) Ossenkopf, V. 1993, A&A, 280, 617
- Schneider et al. (2002) Schneider, R., Ferrara, A., Natarajan, P. & Omukai, K., 2002, ApJ, 571, 30
- Schneider, Ferrara, & Salvaterra (2004) Schneider, R., Ferrara, A., & Salvaterra, R. 2004, MNRAS, 351, 1379
- Schneider et al. (2006) Schneider, R., Omukai, K., Inoue, A. K., & Ferrara, A. 2006, MNRAS, 369, 1437
- Spitzer (1978) Spitzer, L., Jr 1978, Physical Processes in the Interstellar Medium, New York, Wiley
- Todini & Ferrara (2001) Todini, P. & Ferrara, A. 2001, MNRAS, 325, 726
- Tielens & Hollenbach (1985) Tielens, A. G. G. M. & Hollenbach, D. J. 1985, ApJ, 291, 722
- Weidenschilling & Ruzmaikina (1994) Weidenschilling, S. J., & Ruzmaikina, T. V. 1994, ApJ, 430, 713
- Yan et al. (2004) Yan, H., Lazarian, A., & Draine, B. T. 2004, ApJ, 616, 895